- 重要な情報
- はじめに
- Datadog
- Datadog サイト
- DevSecOps
- AWS Lambda のサーバーレス
- エージェント
- インテグレーション
- コンテナ
- ダッシュボード
- アラート設定
- ログ管理
- トレーシング
- プロファイラー
- タグ
- API
- Service Catalog
- Session Replay
- Continuous Testing
- Synthetic モニタリング
- Incident Management
- Database Monitoring
- Cloud Security Management
- Cloud SIEM
- Application Security Management
- Workflow Automation
- CI Visibility
- Test Visibility
- Intelligent Test Runner
- Code Analysis
- Learning Center
- Support
- 用語集
- Standard Attributes
- ガイド
- インテグレーション
- エージェント
- OpenTelemetry
- 開発者
- 認可
- DogStatsD
- カスタムチェック
- インテグレーション
- Create an Agent-based Integration
- Create an API Integration
- Create a Log Pipeline
- Integration Assets Reference
- Build a Marketplace Offering
- Create a Tile
- Create an Integration Dashboard
- Create a Recommended Monitor
- Create a Cloud SIEM Detection Rule
- OAuth for Integrations
- Install Agent Integration Developer Tool
- サービスのチェック
- IDE インテグレーション
- コミュニティ
- ガイド
- API
- モバイルアプリケーション
- CoScreen
- Cloudcraft
- アプリ内
- Service Management
- インフラストラクチャー
- アプリケーションパフォーマンス
- APM
- Continuous Profiler
- データベース モニタリング
- Data Streams Monitoring
- Data Jobs Monitoring
- Digital Experience
- Software Delivery
- CI Visibility (CI/CDの可視化)
- CD Visibility
- Test Visibility
- Intelligent Test Runner
- Code Analysis
- Quality Gates
- DORA Metrics
- セキュリティ
- セキュリティの概要
- Cloud SIEM
- クラウド セキュリティ マネジメント
- Application Security Management
- AI Observability
- ログ管理
- Observability Pipelines(観測データの制御)
- ログ管理
- 管理
Time Slice SLOs
このページは日本語には対応しておりません。随時翻訳に取り組んでいます。翻訳に関してご質問やご意見ございましたら、お気軽にご連絡ください。
Overview
Time Slice SLOs allow you to measure reliability using a custom definition of uptime. You define uptime as a condition over a metric timeseries. For example, you can create a latency SLO by defining uptime as whenever p95 latency is less than 1 second.
Time Slice SLOs are a convenient alternative to Monitor-based SLOs. You can create an uptime SLO without going through a monitor, so you don’t have to create and maintain both a monitor and an SLO.
Create a Time Slice SLO
You can create a Time Slice SLO through the following ways:
Create an SLO from the create page
- Navigate to Service Management > SLOs.
- Click + New SLO to open up the Create SLO page.
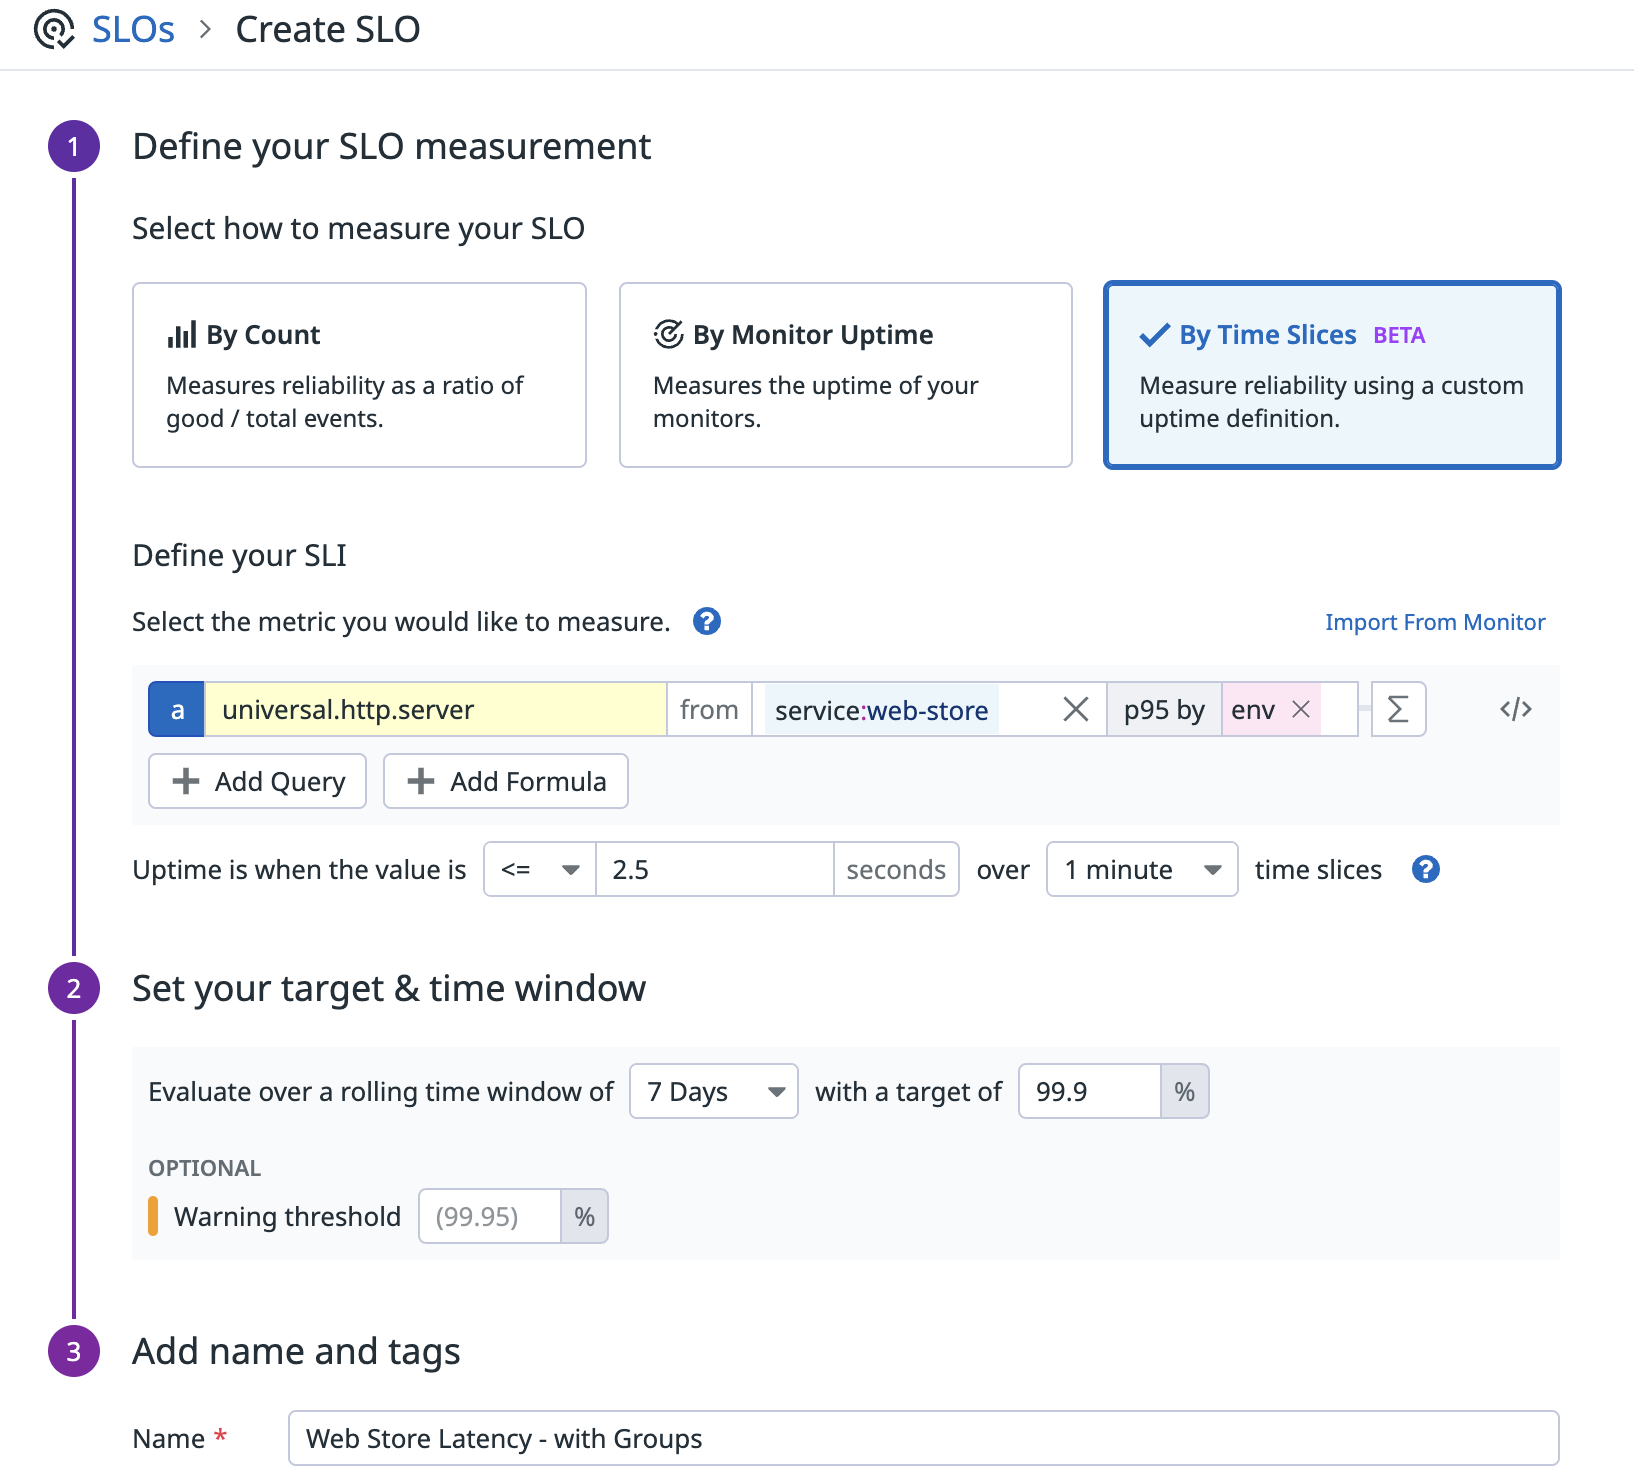
- Select By Time Slices to define your SLO measurement.
- Define your uptime condition by choosing a metric query, comparator and threshold. For example, to define uptime as whenever p95 latency is less than 1s. Alternatively, you can import the uptime from a monitor.
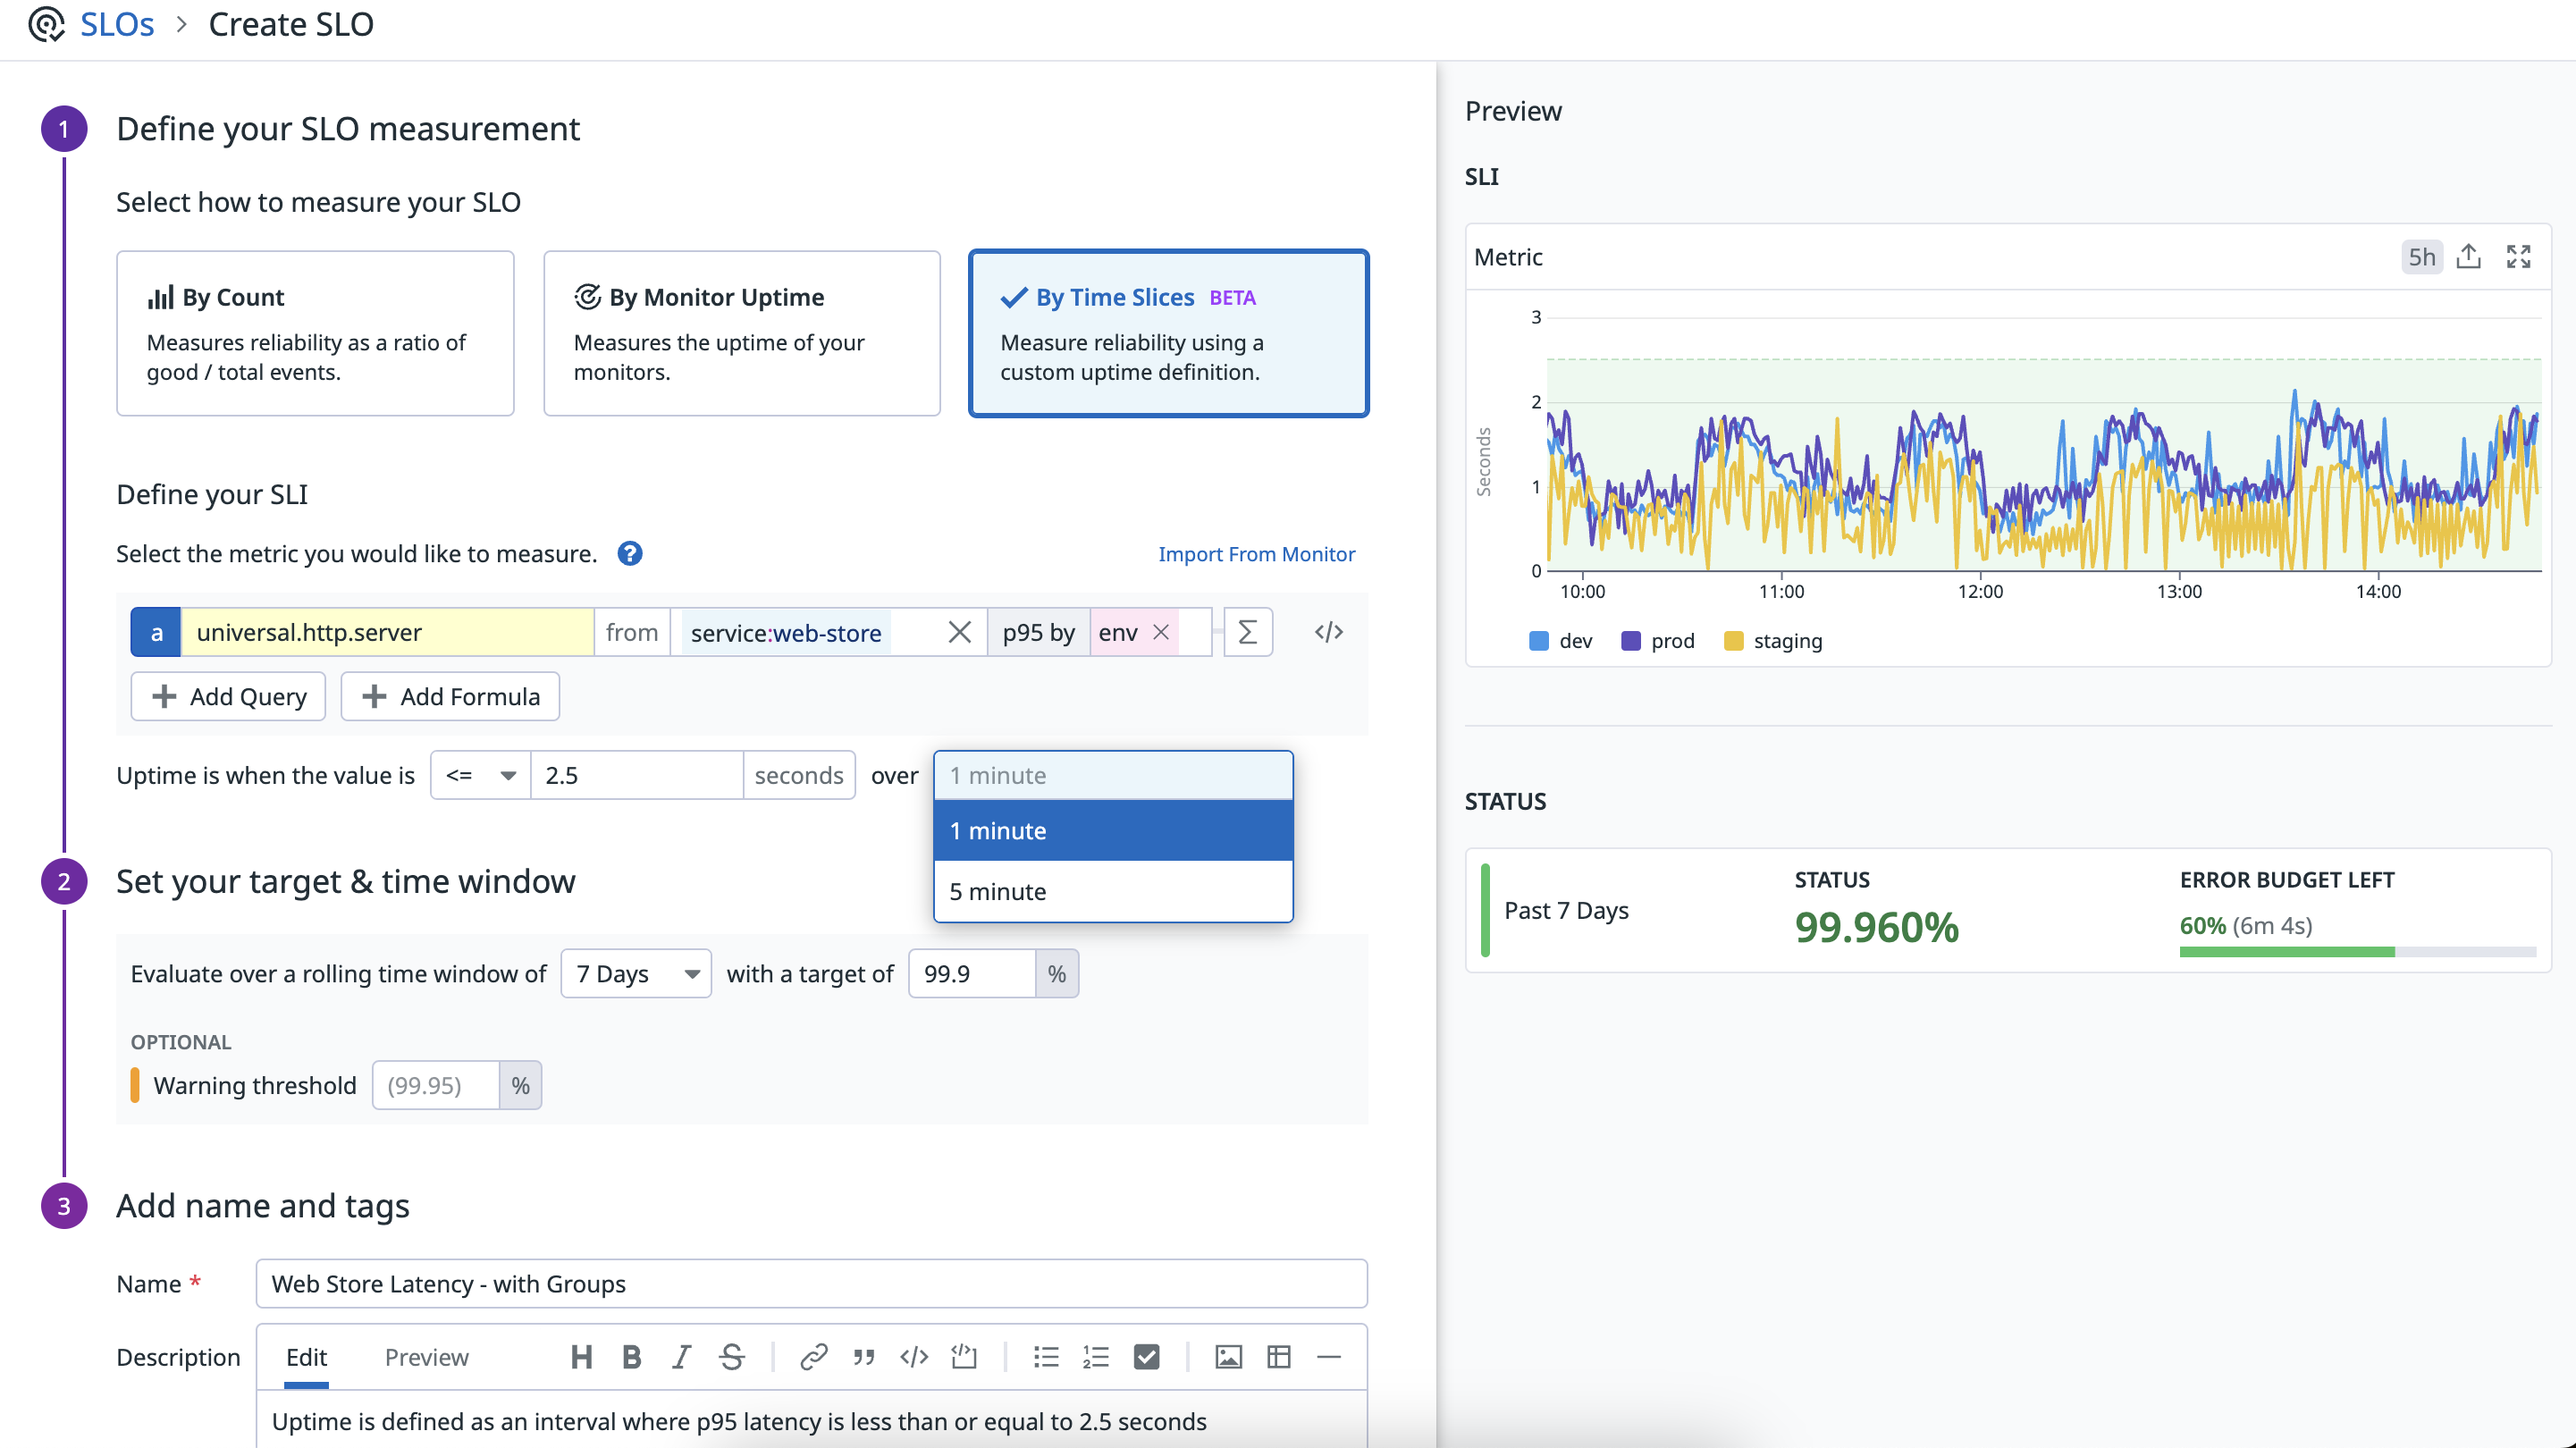
- Configure your SLO to use 1 or 5 minute time slices to calculate uptime.
- Choose your timeframe and target
- Name and tag your SLO.
- Click Create.
Export an existing monitor SLO
Only single metric monitor-based SLOs can be exported. SLOs based on non-metric monitors or multiple monitors cannot be exported.
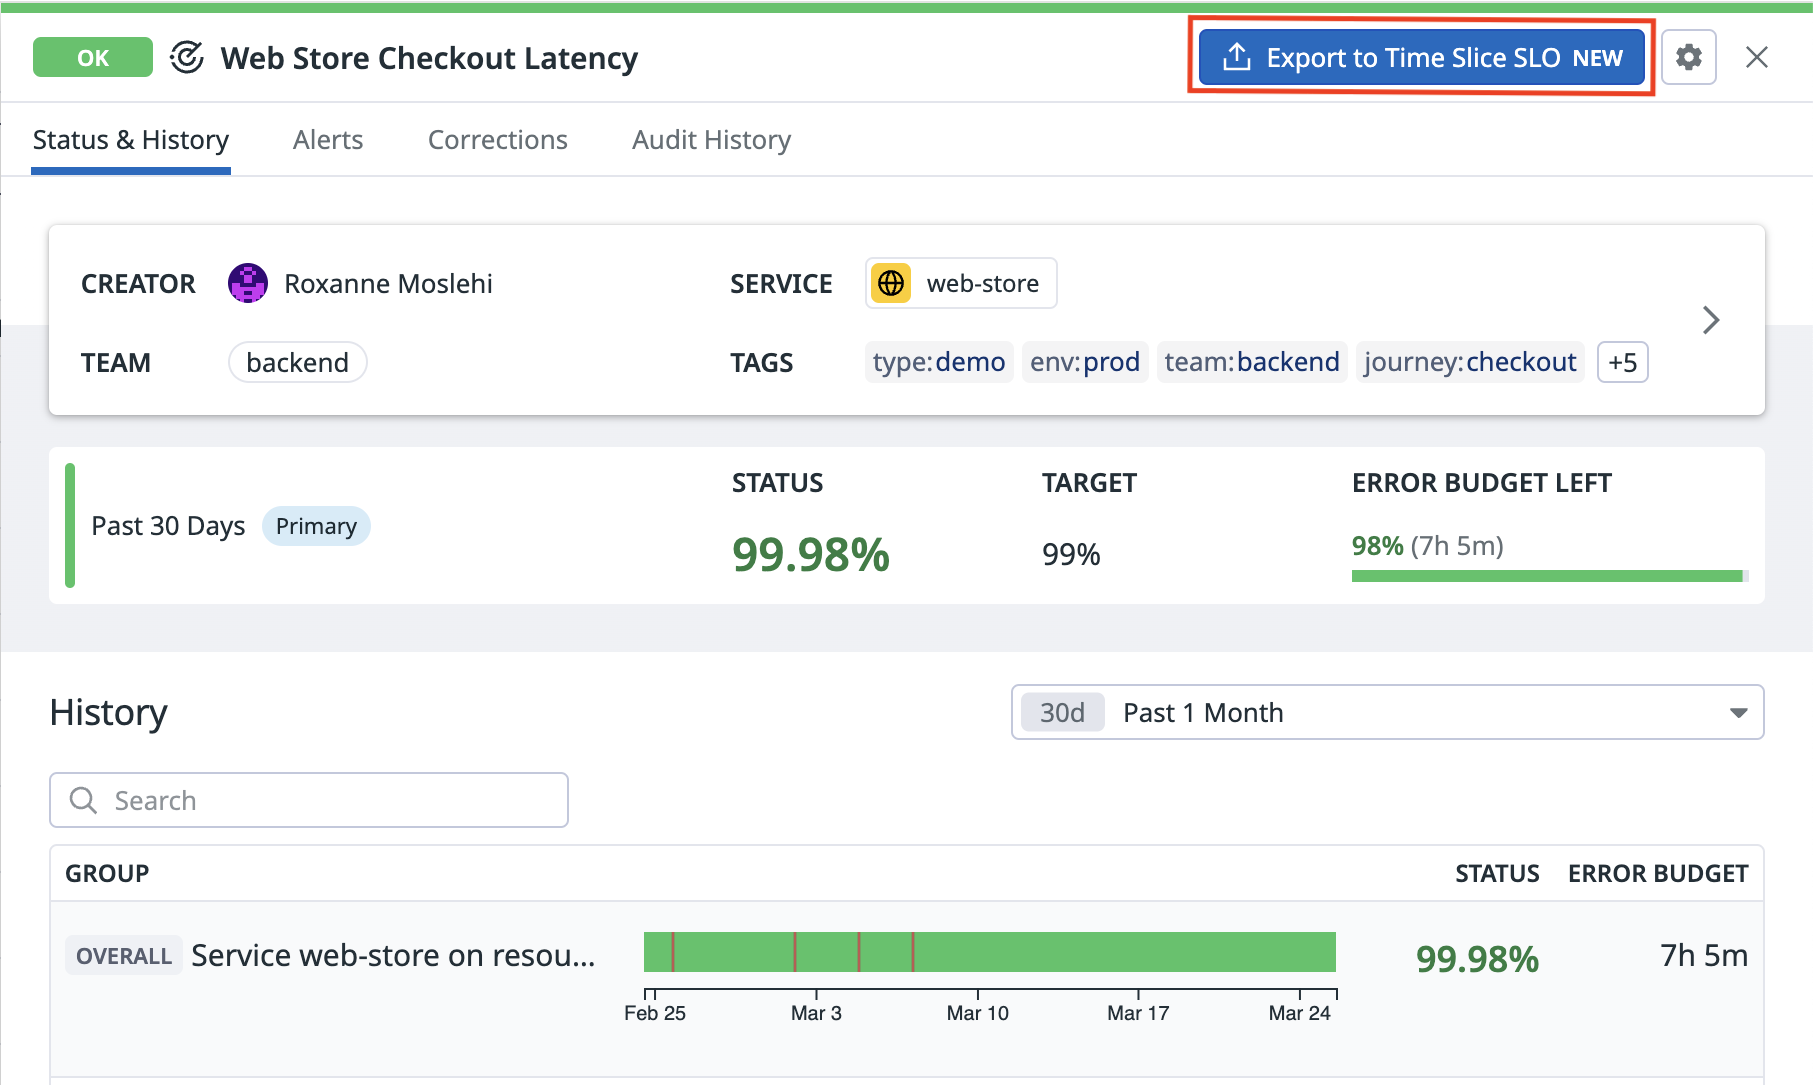
Create a Time Slice SLO by exporting an existing Monitor-based SLO. From a monitor SLO, click Export to Time Slice SLO.
Import from a monitor
Only metric monitor SLOs appear in the monitor selection for import.
From the Create or Edit SLO page, under Define your SLI, click Import from Monitor and select from the dropdown or search in the monitor selector.
Note: Time Slice SLOs do not support rolling periods. Rolling periods do not transfer from a monitor query to a Time Slice query.
Uptime calculations
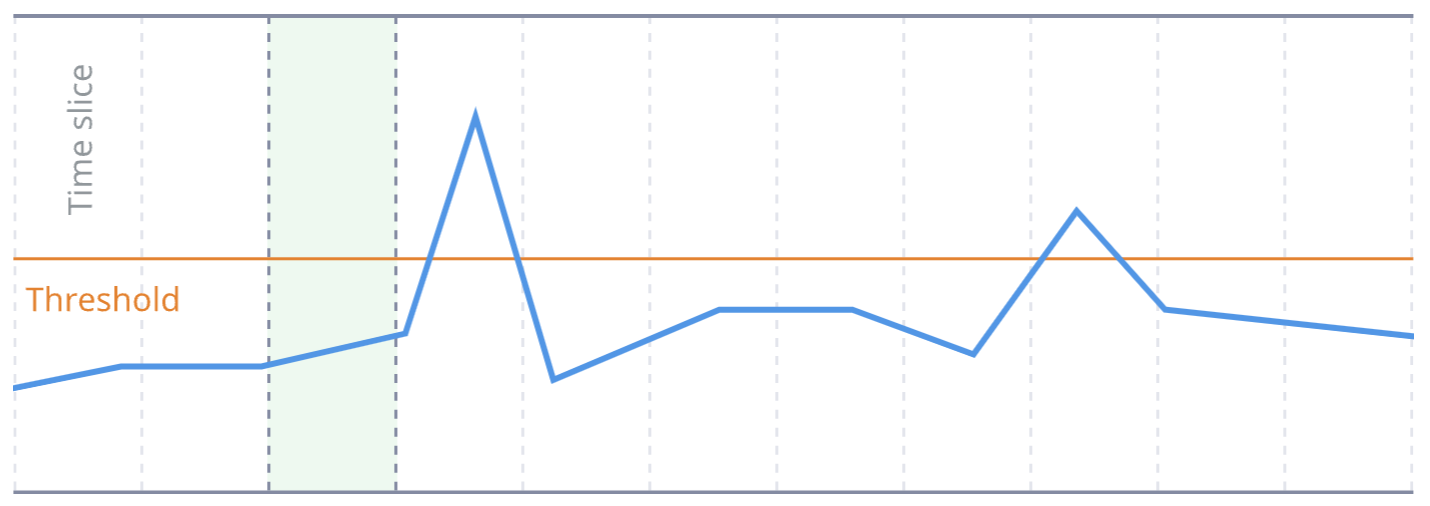
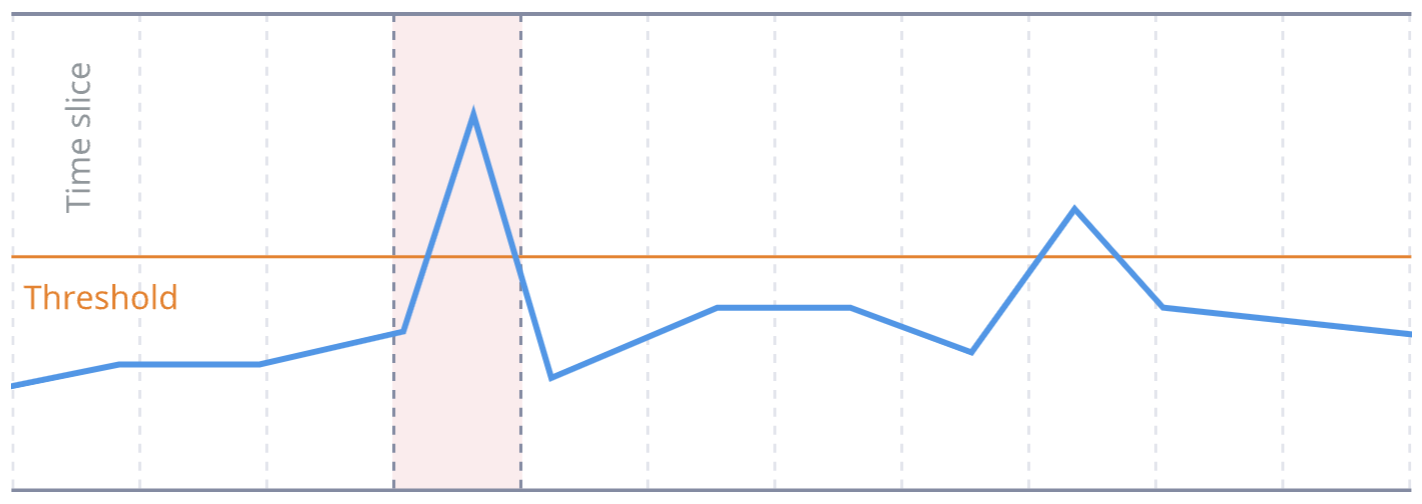
To calculate the uptime percentage for a Time Slice SLOs, Datadog cuts the timeseries into equal-duration intervals, called “slices”. The length of the interval configurable with options of 1 or 5 minutes:
The space and time aggregation are determined by the metric query. For more information on time and space aggregation, see the metrics documentation.
For each slice, there is a single value for the timeseries, and the uptime condition (such as value < 1) is evaluated for each slice. If the condition is met, the slice is considered uptime:
Otherwise, it is considered downtime:
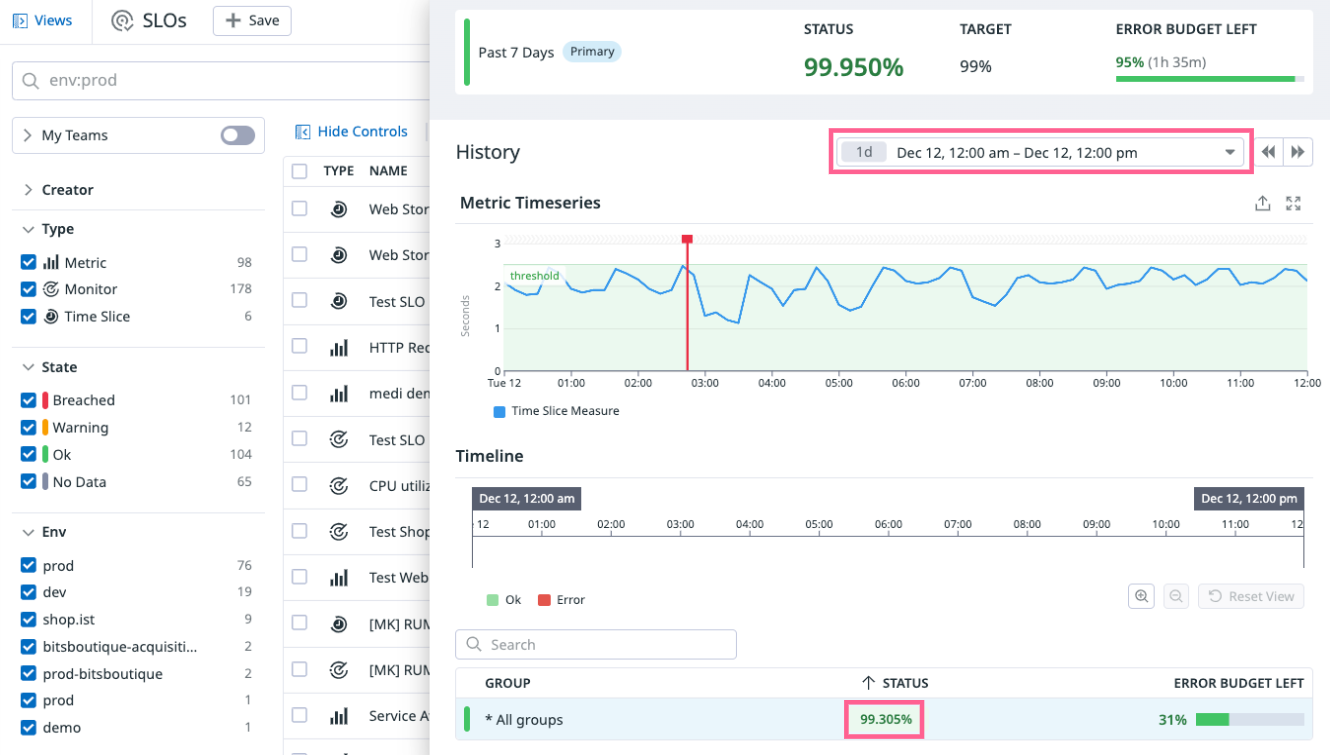
In the example below, there is a Time Slice SLO configured with 5-minute time slices, and exactly one point in the timeseries violates the uptime condition. In this case, the condition is that the p95 latency is less than or equal to 2.5 seconds. Since the total time period shown is 12 hours (720 minutes), and 715 minutes are considered uptime (720 min total time - 5 min downtime), the uptime percentage is 715/720 * 100 = 99.305%
Groups and overall uptime
Time Slice SLOs allow you to track uptime for individual groups, where groups are defined in the “group by” portion of the metric query.
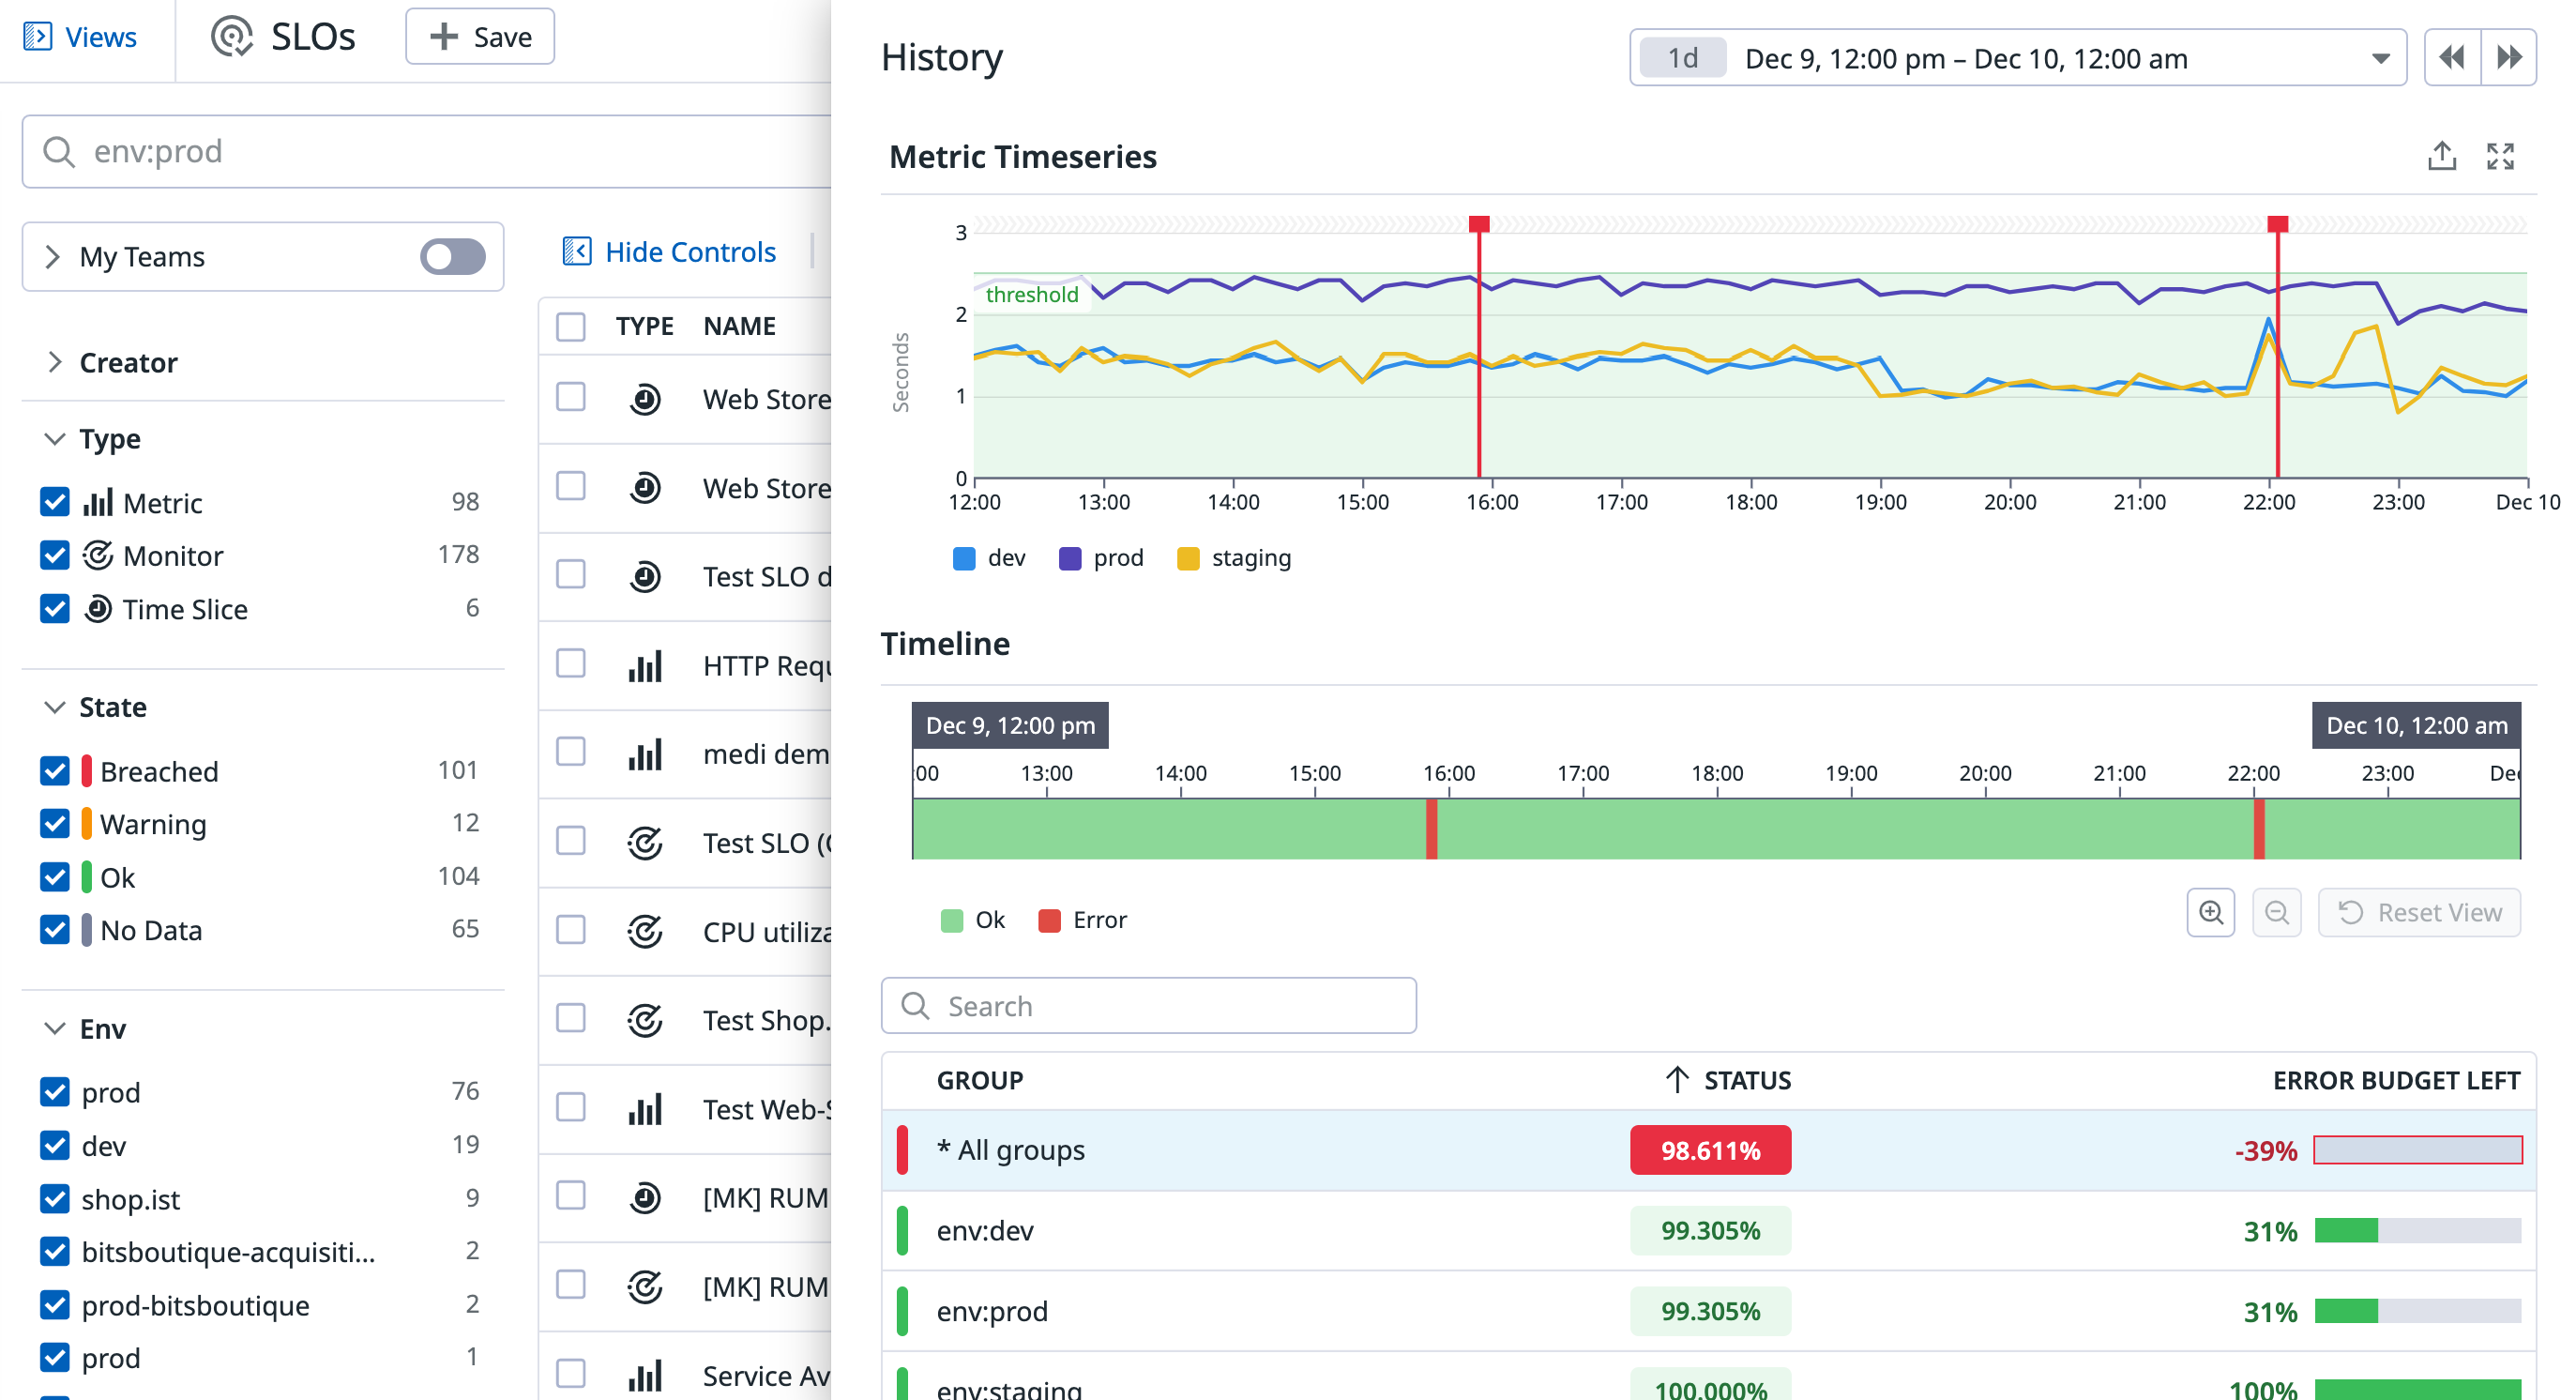
When groups are present, uptime is calculated for each individual group. However, overall uptime works differently. In order to match existing monitor SLO functionality, Time Slice SLOs use the same definition of overall uptime. When all groups have uptime, it is considered overall uptime. Conversely, if any group has downtime, it is considered overall downtime. Overall uptime is always less than the uptime for any individual group.
In the example above, environment “prod” has 5 minutes of downtime over a 12 hour (720 minute) period, resulting in approximately 715/720 * 100 = 99.305% of uptime. Environment “dev” also had 5 minutes of downtime, resulting in the same uptime. This means that overall downtime–when either datacenter prod or dev had downtime–was 10 minutes (since there is no overlap), resulting in approximately (720-10)/720 * 100 = 98.611% uptime.
Corrections
Time Slice SLOs count correction periods as uptime in all calculations. Since the total time remains constant, the error budget is always a fixed amount of time as well. This is a significant simplification and improvement over how corrections are handled for monitor-based SLOs.
For monitor-based SLOs, corrections are periods that are removed from the calculation. If a one-day-long correction is added to a 7-day SLO, 1 hour of downtime counts as 0.7% instead of 0.6%:
$$ 60/8640 *100 = ~0.7% $$
The effects on error budget can be unusual. Removing time from an uptime SLO causes time dilation, where each minute of downtime represents a larger fraction of the total time.
Missing data
In Time Slice SLOs, missing data is always treated as uptime. While missing data is treated as uptime, it is gray on the timeline visualization.
