- Essentials
- Getting Started
- Datadog
- Datadog Site
- DevSecOps
- Serverless for AWS Lambda
- Agent
- Integrations
- Containers
- Dashboards
- Monitors
- Logs
- APM Tracing
- Profiler
- Tags
- API
- Service Catalog
- Session Replay
- Continuous Testing
- Synthetic Monitoring
- Incident Management
- Database Monitoring
- Cloud Security Management
- Cloud SIEM
- Application Security Management
- Workflow Automation
- CI Visibility
- Test Visibility
- Intelligent Test Runner
- Code Analysis
- Learning Center
- Support
- Glossary
- Standard Attributes
- Guides
- Agent
- Integrations
- OpenTelemetry
- Developers
- Authorization
- DogStatsD
- Custom Checks
- Integrations
- Create an Agent-based Integration
- Create an API Integration
- Create a Log Pipeline
- Integration Assets Reference
- Build a Marketplace Offering
- Create a Tile
- Create an Integration Dashboard
- Create a Recommended Monitor
- Create a Cloud SIEM Detection Rule
- OAuth for Integrations
- Install Agent Integration Developer Tool
- Service Checks
- IDE Plugins
- Community
- Guides
- API
- Datadog Mobile App
- CoScreen
- Cloudcraft
- In The App
- Dashboards
- Notebooks
- DDSQL Editor
- Sheets
- Monitors and Alerting
- Infrastructure
- Metrics
- Watchdog
- Bits AI
- Service Catalog
- API Catalog
- Error Tracking
- Service Management
- Infrastructure
- Application Performance
- APM
- Continuous Profiler
- Database Monitoring
- Data Streams Monitoring
- Data Jobs Monitoring
- Digital Experience
- Real User Monitoring
- Product Analytics
- Synthetic Testing and Monitoring
- Continuous Testing
- Software Delivery
- CI Visibility
- CD Visibility
- Test Visibility
- Intelligent Test Runner
- Code Analysis
- Quality Gates
- DORA Metrics
- Security
- Security Overview
- Cloud SIEM
- Cloud Security Management
- Application Security Management
- AI Observability
- Log Management
- Observability Pipelines
- Log Management
- Administration
Send Amazon EKS Fargate Logs with Amazon Data Firehose
Overview
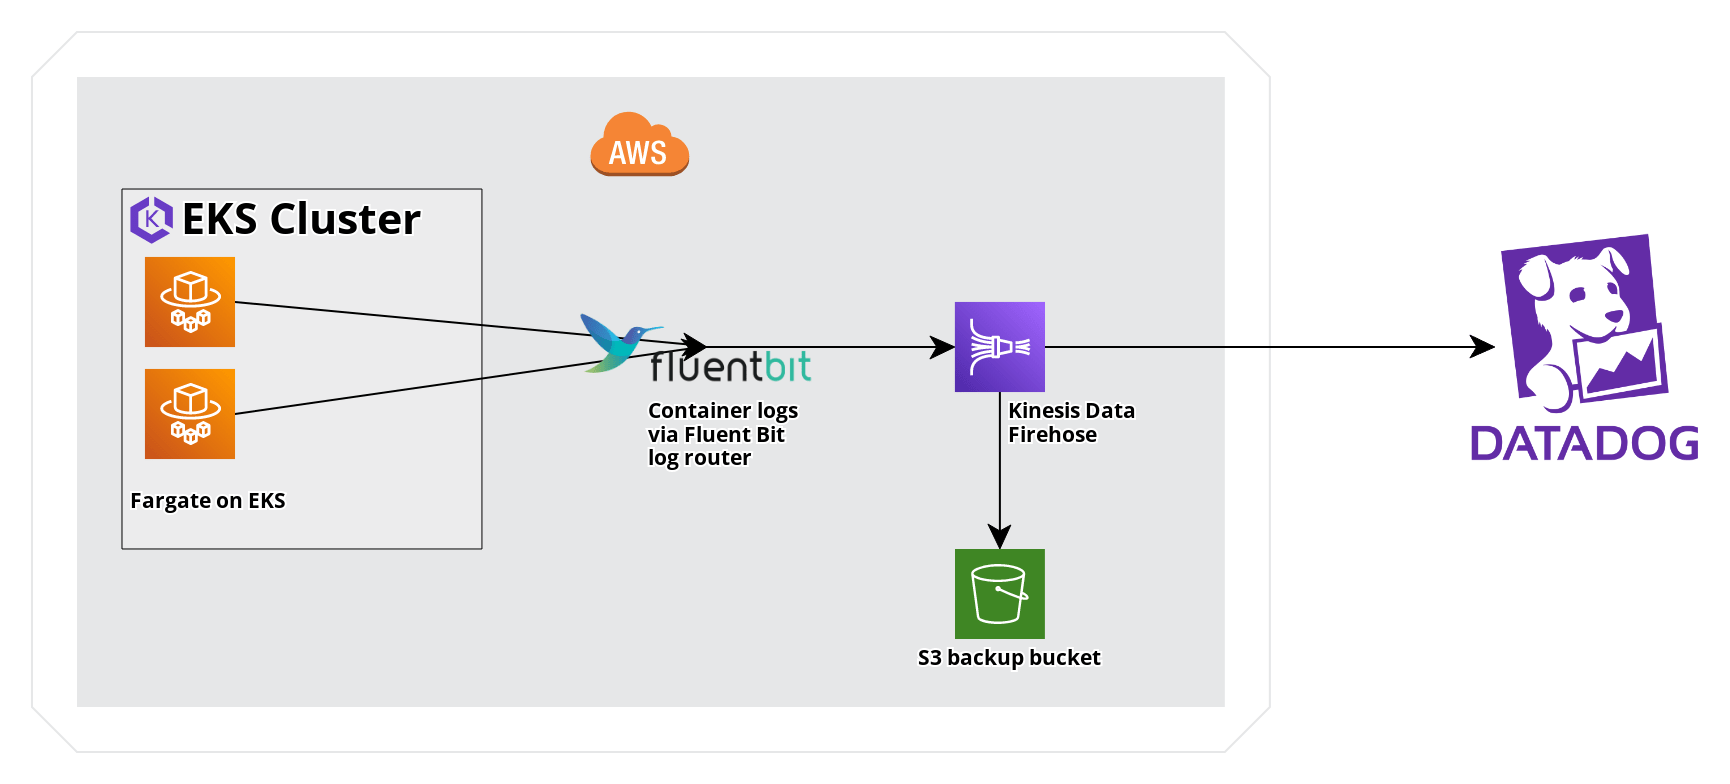
AWS Fargate on EKS provides a fully managed experience for running Kubernetes workloads. Amazon Data Firehose can be used with EKS’s Fluent Bit log router to collect logs in Datadog. This guide provides a comparison of log forwarding through Amazon Data Firehose and CloudWatch logs, as well as a sample EKS Fargate application to send logs to Datadog through Amazon Data Firehose.
Amazon Data Firehose and CloudWatch log forwarding
The following are key differences between using Amazon Data Firehose and CloudWatch log forwarding.
Metadata and tagging: Metadata, such as Kubernetes namespace and container ID, are accessible as structured attributes when sending logs with Amazon Data Firehose.
AWS Costs: AWS Costs may vary for individual use cases but Amazon Data Firehose ingestion is generally less expensive than comparable Cloudwatch Log ingestion.
Requirements
- The following command line tools:
kubectl,aws. - An EKS cluster with a Fargate profile and Fargate pod execution role. In this guide, the cluster is named
fargate-clusterwith a Fargate profile namedfargate-profileapplied to the namespacefargate-namespace. If you don’t already have these resources, use Getting Started with Amazon EKS to create the cluster and Getting Started with AWS Fargate using Amazon EKS to create the Fargate profile and pod execution role.
Setup
The following steps outline the process for sending logs from a sample application deployed on an EKS cluster through Fluent Bit and an Amazon Data Firehose delivery stream to Datadog. To maximize consistency with standard Kubernetes tags in Datadog, instructions are included to remap selected attributes to tag keys.
- Create an Amazon Data Firehose delivery stream that delivers logs to Datadog, along with an S3 Backup for any failed log deliveries.
- Configure Fluent Bit for Firehose on EKS Fargate.
- Deploy a sample application.
- Apply remapper processors for correlation using Kubernetes tags and the
container_idtag.
Create an Amazon Data Firehose delivery stream
See the Send AWS Services Logs with the Datadog Amazon Data Firehose Destination guide to set up an Amazon Data Firehose Delivery stream.
Note: Set the Source as Direct PUT.
Configure Fluent Bit for Firehose on an EKS Fargate cluster
- Create the
aws-observabilitynamespace.
kubectl create namespace aws-observability- Create the following Kubernetes ConfigMap for Fluent Bit as
aws-logging-configmap.yaml. Substitute the name of your delivery stream.
For the new higher performance Kinesis Firehose plugin use the plugin name
kinesis_firehose instead of amazon_data_firehose.apiVersion: v1
kind: ConfigMap
metadata:
name: aws-logging
namespace: aws-observability
data:
filters.conf: |
[FILTER]
Name kubernetes
Match kube.*
Merge_Log On
Buffer_Size 0
Kube_Meta_Cache_TTL 300s
flb_log_cw: 'true'
output.conf: |
[OUTPUT]
Name kinesis_firehose
Match kube.*
region <REGION>
delivery_stream <YOUR-DELIVERY-STREAM-NAME> - Use
kubectlto apply the ConfigMap manifest.
kubectl apply -f aws-logging-configmap.yaml- Create an IAM policy and attach it to the pod execution role to allow the log router running on AWS Fargate to write to the Amazon Data Firehose. You can use the example below, replacing the ARN in the Resource field with the ARN of your delivery stream, as well as specifying your region and account ID.
allow_firehose_put_permission.json
{
    "Version": "2012-10-17",
    "Statement": [
        {
            "Sid": "VisualEditor0",
            "Effect": "Allow",
            "Action": [
                "firehose:PutRecord",
                "firehose:PutRecordBatch"
            ],
            "Resource":
       "arn:aws:firehose:<REGION>:<ACCOUNTID>:deliverystream/<DELIVERY-STREAM-NAME>"
       }
]
}
a. Create the policy.
aws iam create-policy \
         --policy-name FluentBitEKSFargate \
         --policy-document file://allow_firehose_put_permission.json
b. Retrieve the Fargate Pod Execution Role and attach the IAM policy.
 POD_EXEC_ROLE=$(aws eks describe-fargate-profile \
   --cluster-name fargate-cluster \
   --fargate-profile-name fargate-profile \
   --query 'fargateProfile.podExecutionRoleArn' --output text |cut -d '/' -f 2)
 aws iam attach-role-policy \
         --policy-arn arn:aws:iam::<ACCOUNTID>:policy/FluentBitEKSFargate \
         --role-name $POD_EXEC_ROLE
Deploy a sample application
To generate logs and test the Amazon Data Firehose delivery stream, deploy a sample workload to your EKS Fargate cluster.
- Create a deployment manifest
sample-deployment.yaml.
sample-deployment.yaml
 apiVersion: apps/v1
 kind: Deployment
 metadata:
   name: sample-app
   namespace: fargate-namespace
 spec:
   selector:
     matchLabels:
       app: nginx
   replicas: 1
   template:
     metadata:
       labels:
         app: nginx
     spec:
       containers:
       - name: nginx
         image: nginx
         ports:
- containerPort: 80- Create the
fargate-namespacenamespace.
kubectl create namespace fargate-namespace
- Use
kubectlto apply the deployment manifest.
kubectl apply -f sample-deployment.yaml
Validation
- Verify that
sample-apppods are running in the namespacefargate-namespace.
kubectl get pods -n fargate-namespace
Expected output:
 NAME                          READY   STATUS    RESTARTS   AGE
 sample-app-6c8b449b8f-kq2qz   1/1     Running   0          3m56s
 sample-app-6c8b449b8f-nn2w7   1/1     Running   0          3m56s
 sample-app-6c8b449b8f-wzsjj   1/1     Running   0          3m56s
- Use
kubectl describe podto confirm that the Fargate logging feature is enabled.
kubectl describe pod <POD-NAME> -n fargate-namespace |grep Logging
Expected output:
                    Logging: LoggingEnabled
 Normal  LoggingEnabled   5m   fargate-scheduler  Successfully enabled logging for pod
- Inspect deployment logs.
kubectl logs -l app=nginx -n fargate-namespace
Expected output:
 /docker-entrypoint.sh: Launching /docker-entrypoint.d/30-tune-worker-processes.sh
 /docker-entrypoint.sh: Configuration complete; ready for start up
 2023/01/27 16:53:42 [notice] 1#1: using the "epoll" event method
 2023/01/27 16:53:42 [notice] 1#1: nginx/1.23.3
 2023/01/27 16:53:42 [notice] 1#1: built by gcc 10.2.1 20210110 (Debian 10.2.1-6)
 2023/01/27 16:53:42 [notice] 1#1: OS: Linux 4.14.294-220.533.amzn2.x86_64
 2023/01/27 16:53:42 [notice] 1#1: getrlimit(RLIMIT_NOFILE): 1024:65535
 2023/01/27 16:53:42 [notice] 1#1: start worker processes
 ...
- Verify the logs are in Datadog. In the Datadog Log Explorer, search for
@aws.firehose.arn:"<ARN>", replacing<ARN>with your Amazon Data Firehose ARN, to filter for logs from the Amazon Data Firehose.
Remap attributes for log correlation
Logs from this configuration require some attributes to be remapped to maximize consistency with standard Kubernetes tags in Datadog.
Go to the Datadog Log Pipelines page.
Create a new pipeline with Name
EKS Fargate Log Pipelineand Filterservice:aws source:aws.Create four Remapper processors to remap the following attributes to tag keys:
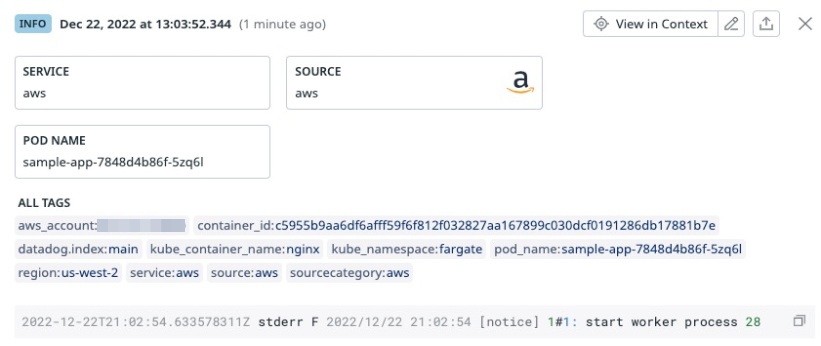
Attribute to remap Target Tag Key kubernetes.container_namekube_container_namekubernetes.namespace_namekube_namespacekubernetes.pod_namepod_namekubernetes.docker_idcontainer_idAfter creating this pipeline, logs emitted by the sample app are tagged like this example with the log attributes remapped to Kubernetes tags:
Further Reading
Additional helpful documentation, links, and articles:


