- Essentials
- Getting Started
- Datadog
- Datadog Site
- DevSecOps
- Serverless for AWS Lambda
- Agent
- Integrations
- Containers
- Dashboards
- Monitors
- Logs
- APM Tracing
- Profiler
- Tags
- API
- Service Catalog
- Session Replay
- Continuous Testing
- Synthetic Monitoring
- Incident Management
- Database Monitoring
- Cloud Security Management
- Cloud SIEM
- Application Security Management
- Workflow Automation
- CI Visibility
- Test Visibility
- Intelligent Test Runner
- Code Analysis
- Learning Center
- Support
- Glossary
- Standard Attributes
- Guides
- Agent
- Integrations
- OpenTelemetry
- Developers
- Authorization
- DogStatsD
- Custom Checks
- Integrations
- Create an Agent-based Integration
- Create an API Integration
- Create a Log Pipeline
- Integration Assets Reference
- Build a Marketplace Offering
- Create a Tile
- Create an Integration Dashboard
- Create a Recommended Monitor
- Create a Cloud SIEM Detection Rule
- OAuth for Integrations
- Install Agent Integration Developer Tool
- Service Checks
- IDE Plugins
- Community
- Guides
- API
- Datadog Mobile App
- CoScreen
- Cloudcraft
- In The App
- Dashboards
- Notebooks
- DDSQL Editor
- Sheets
- Monitors and Alerting
- Infrastructure
- Metrics
- Watchdog
- Bits AI
- Service Catalog
- API Catalog
- Error Tracking
- Service Management
- Infrastructure
- Application Performance
- APM
- Continuous Profiler
- Database Monitoring
- Data Streams Monitoring
- Data Jobs Monitoring
- Digital Experience
- Real User Monitoring
- Product Analytics
- Synthetic Testing and Monitoring
- Continuous Testing
- Software Delivery
- CI Visibility
- CD Visibility
- Test Visibility
- Intelligent Test Runner
- Code Analysis
- Quality Gates
- DORA Metrics
- Security
- Security Overview
- Cloud SIEM
- Cloud Security Management
- Application Security Management
- AI Observability
- Log Management
- Observability Pipelines
- Log Management
- Administration
Change Alert Monitor
Overview
Metric monitors are one of the most commonly used type of monitor. This guide clarifies the change alert detection method’s behavior and its additional options. Learn how change alert monitors work and how to troubleshoot change alert evaluations.
What are change alert monitors?
Here is a breakdown of how monitors with the change detection method work:
- The monitor takes a query of data points at the current time.
- It takes a query of data points N minutes, hours, or days ago.
- Then, it takes a query of the difference of the values between (1) and (2).
- Aggregation is applied over the query in (3) which returns a single value.
- The threshold defined in Set alert conditions is compared to the single value returned in (4).
Monitor creation
To create a Change Alert monitor in Datadog, use the main navigation: Monitors –> New Monitor –> Change.
Evaluation conditions
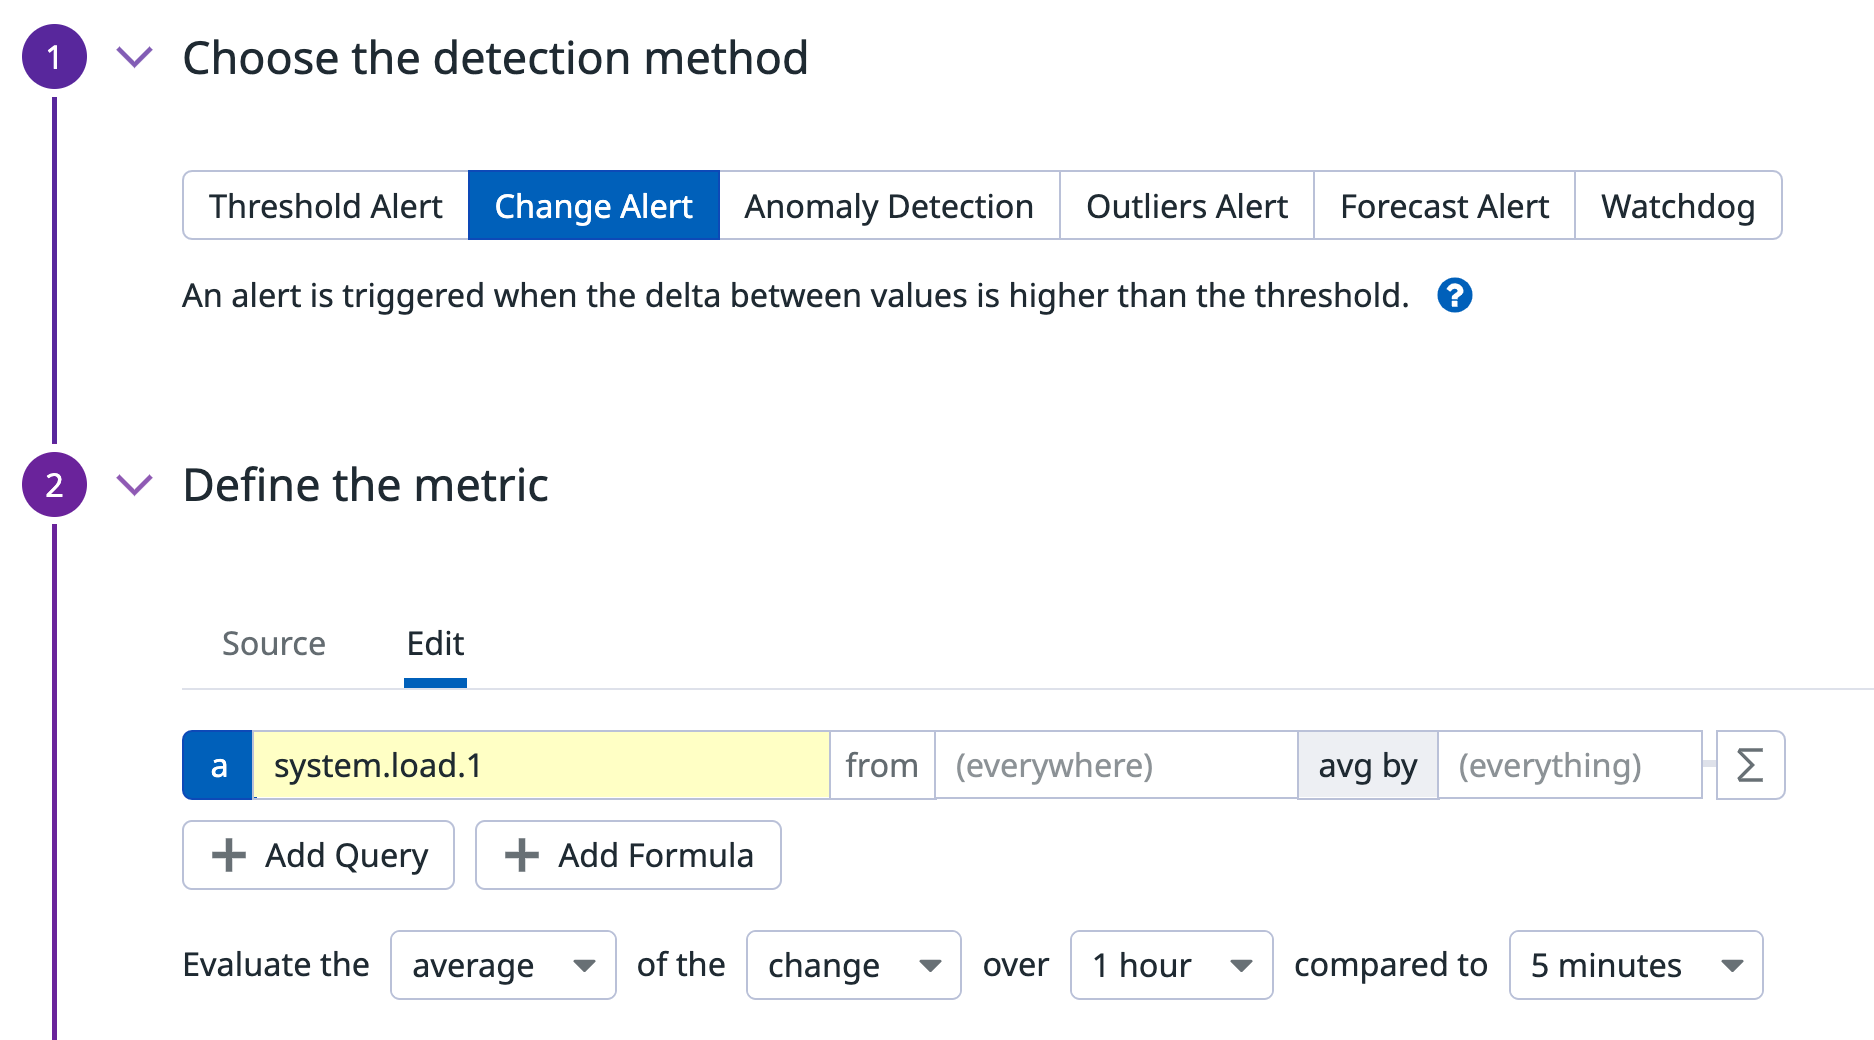
Here are the different options that you need to configure in a change alert monitor.
The example shows the following alert condition: The average of the change over 1 hour compared to 5 minutes
| Options selected | Description | Options |
|---|---|---|
| average | The aggregation that is used on the query. | Average, Maximum, Minimum, Sum |
| change | Choose between the absolute or percentage change of the value. | change or % change |
| 1 hour | The evaluation window. For more information, see the Monitor Configuration documentation. | This can be N minutes, hours, days, weeks, or at most one month. |
| 5 minutes | The timeframe that you wish to shift the query by. | This can be N minutes, hours, days, weeks, or at most one month ago. |
Change and change %
There are two options when configuring a change alert detection, Change and % Change.
This determines the way the monitor evaluates as expressed in the formula section in the following table:
| Option | Description | Formula |
|---|---|---|
| Change | The absolute change of the value. | a - b |
| % Change | The percentage change of the value compared to its previous value. | ((a - b) / b) * 100 |
In both cases, Change, and % Change can be either positive or negative.
Notifications
For instructions on the Configure notifications and automations section, see the Notifications and Monitor configuration pages.
Troubleshooting a change alert evaluation
To verify the results of your change alert evaluation, reconstruct the metric queries with a Notebook. Take this change alert monitor with the following settings.
Monitor Query:
pct_change(avg(last_5m),last_30m):<METRIC> > -50
This is a break down of the query with the following conditions:
- Aggregation of avg.
- Uses % change.
- Evaluation window of 5 minutes.
- Timeshift of 30 minutes or 1800 seconds.
- Threshold of > -50.
Reconstructing the query
- Use a notebook and the timeshift function to reconstruct the data used by the monitor at a specific evaluation.
- Query of data points at the current time (this is the normal query
). - Query of data points N minutes ago (this is the normal query + timeshift(-1800)).
- The timeshift function uses a negative duration because you’re shifting the data back. Combine these queries along with the % change formula from the table.
- Note: Since this example only has one metric, it’s also possible to use a single query (a) and add the formula
((a - timeshift(a, -1800)) / timeshift(a, -1800)) * 100
- Query of data points at the current time (this is the normal query
- Compare the monitor’s history graph with the notebook graph. Are the values comparable?
- Apply the aggregation.
- To compare your notebook graph to the change alert monitor evaluation, scope your timeframe to match the change alert.
- For example, if you are looking to verify the value of a monitor evaluation over the last five minutes at 1:30, scope your notebook to 1:25 - 1:30.
Further reading
Additional helpful documentation, links, and articles:


