- Essentials
- Getting Started
- Datadog
- Datadog Site
- DevSecOps
- Serverless for AWS Lambda
- Agent
- Integrations
- Containers
- Dashboards
- Monitors
- Logs
- APM Tracing
- Profiler
- Tags
- API
- Service Catalog
- Session Replay
- Continuous Testing
- Synthetic Monitoring
- Incident Management
- Database Monitoring
- Cloud Security Management
- Cloud SIEM
- Application Security Management
- Workflow Automation
- CI Visibility
- Test Visibility
- Intelligent Test Runner
- Code Analysis
- Learning Center
- Support
- Glossary
- Standard Attributes
- Guides
- Agent
- Integrations
- OpenTelemetry
- Developers
- Authorization
- DogStatsD
- Custom Checks
- Integrations
- Create an Agent-based Integration
- Create an API Integration
- Create a Log Pipeline
- Integration Assets Reference
- Build a Marketplace Offering
- Create a Tile
- Create an Integration Dashboard
- Create a Recommended Monitor
- Create a Cloud SIEM Detection Rule
- OAuth for Integrations
- Install Agent Integration Developer Tool
- Service Checks
- IDE Plugins
- Community
- Guides
- API
- Datadog Mobile App
- CoScreen
- Cloudcraft
- In The App
- Dashboards
- Notebooks
- DDSQL Editor
- Sheets
- Monitors and Alerting
- Infrastructure
- Metrics
- Watchdog
- Bits AI
- Service Catalog
- API Catalog
- Error Tracking
- Service Management
- Infrastructure
- Application Performance
- APM
- Continuous Profiler
- Database Monitoring
- Data Streams Monitoring
- Data Jobs Monitoring
- Digital Experience
- Real User Monitoring
- Product Analytics
- Synthetic Testing and Monitoring
- Continuous Testing
- Software Delivery
- CI Visibility
- CD Visibility
- Test Visibility
- Intelligent Test Runner
- Code Analysis
- Quality Gates
- DORA Metrics
- Security
- Security Overview
- Cloud SIEM
- Cloud Security Management
- Application Security Management
- AI Observability
- Log Management
- Observability Pipelines
- Log Management
- Administration
CI Monitor
CI Visibility is not available in the selected site () at this time.
Overview
Once CI Visibility is enabled for your organization, you can create a CI Pipeline or CI Test monitor.
CI monitors allow you to visualize CI data and set up alerts on it. For example, create a CI Pipeline monitor to receive alerts on a failed pipeline or a job. Create a CI Test monitor to receive alerts on failed or slow tests.
Monitor creation
To create a CI monitor in Datadog, use the main navigation: Monitors -> New Monitor –> CI.
Note: There is a default limit of 1000 CI monitors per account. Contact Support to lift this limit for your account.
Choose between a Pipelines or a Tests monitor:
Define the search query
- Construct a search query using the same logic as a CI Pipeline explorer search.
- Select the CI Pipeline events level:
- Pipeline: Evaluates the execution of an entire pipeline, usually composed of one or more jobs.
- Stage: Evaluates the execution of a group of one or more jobs in CI providers that support it.
- Job: Evaluates the execution of a group of commands.
- Command: Evaluates manually instrumented custom command events, which are individual commands being executed in a job.
- All: Evaluates all types of events.
- Choose to monitor over a CI Pipeline event count, facet, or measure:
- CI Pipeline event count: Use the search bar (optional) and do not select a facet or measure. Datadog evaluates the number of CI Pipeline events over a selected time frame, then compares it to the threshold conditions.
- Dimension: Select dimension (qualitative facet) to alert over the
Unique value countof the facet. - Measure: Select measure (quantitative facet) to alert over the numerical value of the CI Pipeline measure (similar to a metric monitor). Select the aggregation (
min,avg,sum,median,pc75,pc90,pc95,pc98,pc99, ormax).
- Group CI Pipeline events by multiple dimensions (optional):
- All CI Pipeline events matching the query are aggregated into groups based on the value of up to four facets.
- Configure the alerting grouping strategy (optional):
- If the query has a
group by, multi alerts apply the alert to each source according to your group parameters. An alerting event is generated for each group that meets the set conditions. For example, you could group a query by@ci.pipeline.nameto receive a separate alert for each CI Pipeline name when the number of errors is high.
- If the query has a
Using formulas and functions
You can create CI Pipeline monitors using formulas and functions. This can be used, for example, to create monitors on the rate of an event happening, such as the rate of a pipeline failing (error rate).
The following example is of a pipeline error rate monitor using a formula that calculates the ratio of “number of failed pipeline events” (ci.status=error) over “number of total pipeline events” (no filter), grouped by ci.pipeline.name (to be alerted once per pipeline). To learn more, see the Functions Overview.
Note: Only up to 2 queries can be used to build the evaluation formula per monitor.
Define the search query
- Common monitor types: (optional) Provides a template query for each of the New Flaky Test, Test Failures, and Test Performance common monitor types, which you can then customize. Learn more about this feature by reading Track new flaky tests.
- Construct a search query using the same logic as a CI Test explorer search. For example, you can search failed tests for the
mainbranch of themyapptest service using the following query:@test.status:fail @git.branch:main @test.service:myapp. - Choose to monitor over a CI Test event count, facet, or measure:
- CI Test event count: Use the search bar (optional) and do not select a facet or measure. Datadog evaluates the number of CI Pipeline test events over a selected time frame, then compares it to the threshold conditions.
- Dimension: Select dimension (qualitative facet) to alert over the
Unique value countof the facet. - Measure: Select measure (quantitative facet) to alert over the numerical value of the CI Pipeline facet (similar to a metric monitor). Select the aggregation (
min,avg,sum,median,pc75,pc90,pc95,pc98,pc99, ormax).
- Group CI Test events by multiple dimensions (optional):
- All CI Test events matching the query are aggregated into groups based on the value of up to four facets.
- Configure the alerting grouping strategy (optional):
- If the query has a
group by, an alert is sent for every source according to the group parameters. An alerting event is generated for each group that meets the set conditions. For example, you could group a query by@test.full_nameto receive a separate alert for each CI Test full name when the number of errors is high. Test full name is a combination of a test suite and test name, for example:MySuite.myTest. In Swift, test full name is a combination of a test bundle, and suite and name, for example:MyBundle.MySuite.myTest.
- If the query has a
Test runs with different parameters or configurations
Use @test.fingerprint in the monitor group by when you have tests with the same test full name, but different test parameters or configurations. This way, alerts trigger for test runs with specific test parameters or configurations. Using @test.fingerprint provides the same granularity level as the Test Stats, Failed, and Flaky Tests section on the Commit Overview page.
For example, if a test with the same full name failed on Chrome, but passed on Firefox, then using the fingerprint only triggers the alert on the Chrome test run.
Using @test.full_name in this case triggers the alert, even though the test passed on Firefox.
Formulas and functions
You can create CI Test monitors using formulas and functions. For example, this can be used to create monitors on the rate of an event happening, such as the rate of a test failing (error rate).
The following example is a test error rate monitor using a formula that calculates the ratio of “number of failed test events” (@test.status:fail) over “number of total test events” (no filter), grouped by @test.full_name (to be alerted once per test). To learn more, see the Functions Overview.
Using CODEOWNERS for notifications
You can send the notification to different teams using the CODEOWNERS information available in the test event.
The example below configures the notification with the following logic:
- If the test code owner is
MyOrg/my-team, then send the notification to themy-team-channelSlack channel. - If the test code owner is
MyOrg/my-other-team, then send the notification to themy-other-team-channelSlack channel.
{{#is_match "citest.attributes.test.codeowners" "MyOrg/my-team"}}
  @slack-my-team-channel
{{/is_match}}
{{#is_match "citest.attributes.test.codeowners" "MyOrg/my-other-team"}}
  @slack-my-other-team-channel
{{/is_match}}
In the Notification message section of your monitor, add text similar to the code snippet above to configure monitor notifications. You can add as many is_match clauses as you need. For more information on Notification variables, see Monitors Conditional Variables.
Set alert conditions
- Trigger when the metric is
above,above or equal to,below, orbelow or equal to - The threshold during the last
5 minutes,15 minutes,1 hour, orcustomto set a value between1 minuteand2 days - Alert threshold
<NUMBER> - Warning threshold
<NUMBER>
Advanced alert conditions
For detailed instructions on the advanced alert options (such as evaluation delay), see the Monitor configuration page.
Notifications
For detailed instructions on the Configure notifications and automations section, see the Notifications page.
Samples and breaching values top list
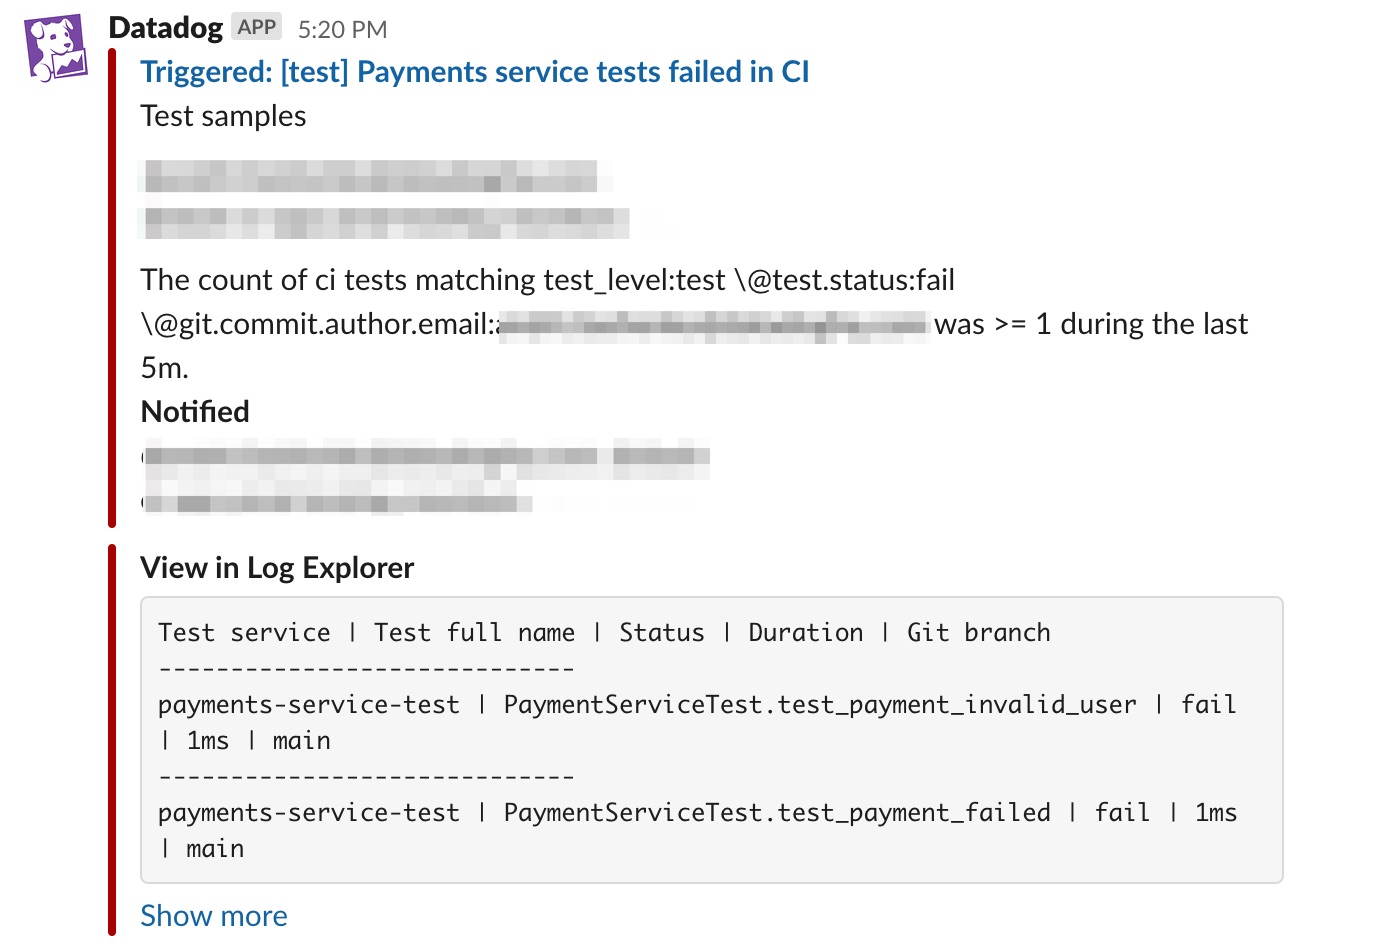
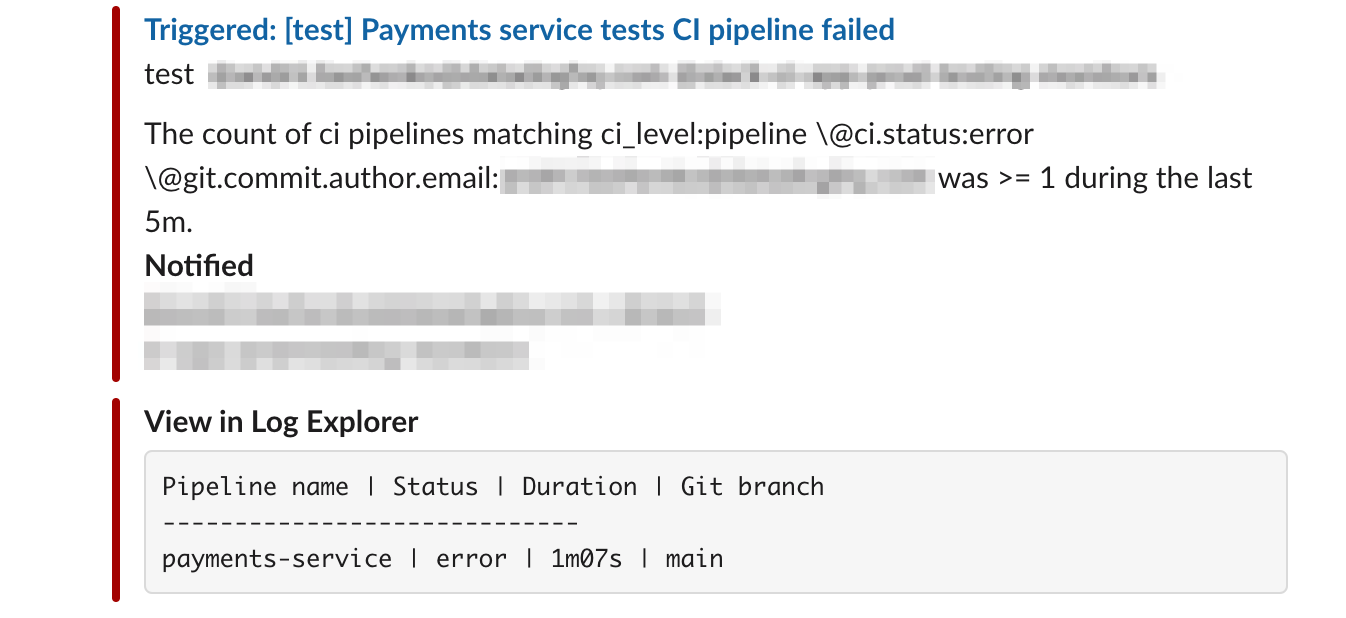
When a CI Test or Pipeline monitor is triggered, samples or values can be added to the notification message.
| Monitor Setup | Can be added to notification message |
|---|---|
| Ungrouped Simple-Alert count | Up to 10 samples. |
| Grouped Simple-Alert count | Up to 10 facet or measure values. |
| Grouped Multi-Alert count | Up to 10 samples. |
| Ungrouped Simple-Alert measure | Up to 10 samples. |
| Grouped Simple-Alert measure | Up to 10 facet or measure values. |
| Grouped Multi-Alert measure | Up to 10 facet or measure values. |
These are available for notifications sent to Slack, Jira, webhooks, Microsoft Teams, Pagerduty, and email. Note: Samples are not displayed for recovery notifications.
To disable samples, uncheck the box at the bottom of the Say what’s happening section. The text next to the box is based on your monitor’s grouping (as stated above).
Sample examples
Include a table of CI Test 10 samples in the alert notification:
Include a table of CI Pipeline 10 samples in the alert notification:
Notifications behavior when there is no data
A monitor that uses an event count for its evaluation query will resolve after the specified evaluation period with no data, triggering a notification. For example, a monitor configured to alert on the number of pipeline errors with an evaluation window of five minutes will automatically resolve after five minutes without any pipeline executions.
As an alternative, Datadog recommends using rate formulas. For example, instead of using a monitor on the number of pipeline failures (count), use a monitor on the rate of pipeline failures (formula), such as (number of pipeline failures)/(number of all pipeline executions). In this case, when there’s no data, the denominator (number of all pipeline executions) will be 0, making the division x/0 impossible to evaluate. The monitor will keep the previous known state instead of evaluating it to 0.
This way, if the monitor triggers because there’s a burst of pipeline failures that makes the error rate go above the monitor threshold, it will not clear until the error rate goes below the threshold, which can be at any time afterwards.
Example monitors
Common monitor use cases are outlined below. Monitor queries can be modified to filter for specific branches, authors, or any other in-app facet.
Trigger alerts for performance regressions
The duration metric can be used to identify pipeline and test performance regressions for any branch. Alerting on this metric can prevent performance regressions from being introduced into your codebase.
Track new flaky tests
Test monitors have the New Flaky Test, Test Failures, and Test Performance common monitor types for simple monitor setup. This monitor sends alerts when new flaky tests are added to your codebase. The query is grouped by Test Full Name so you don’t get alerted on the same new flaky test more than once.
A test run is marked as flaky if it exhibits flakiness within the same commit after some retries. If it exhibits flakiness multiple times (because multiple retries were executed), the is_flaky tag is added to the first test run that is detected as flaky.
A test run is marked as new flaky if that particular test has not been detected to be flaky within the same branch or default branch. Only the first test run that is detected as new flaky is marked with the is_new_flaky tag (regardless of the number of retries).
For more information, see Search and Manage CI Tests.
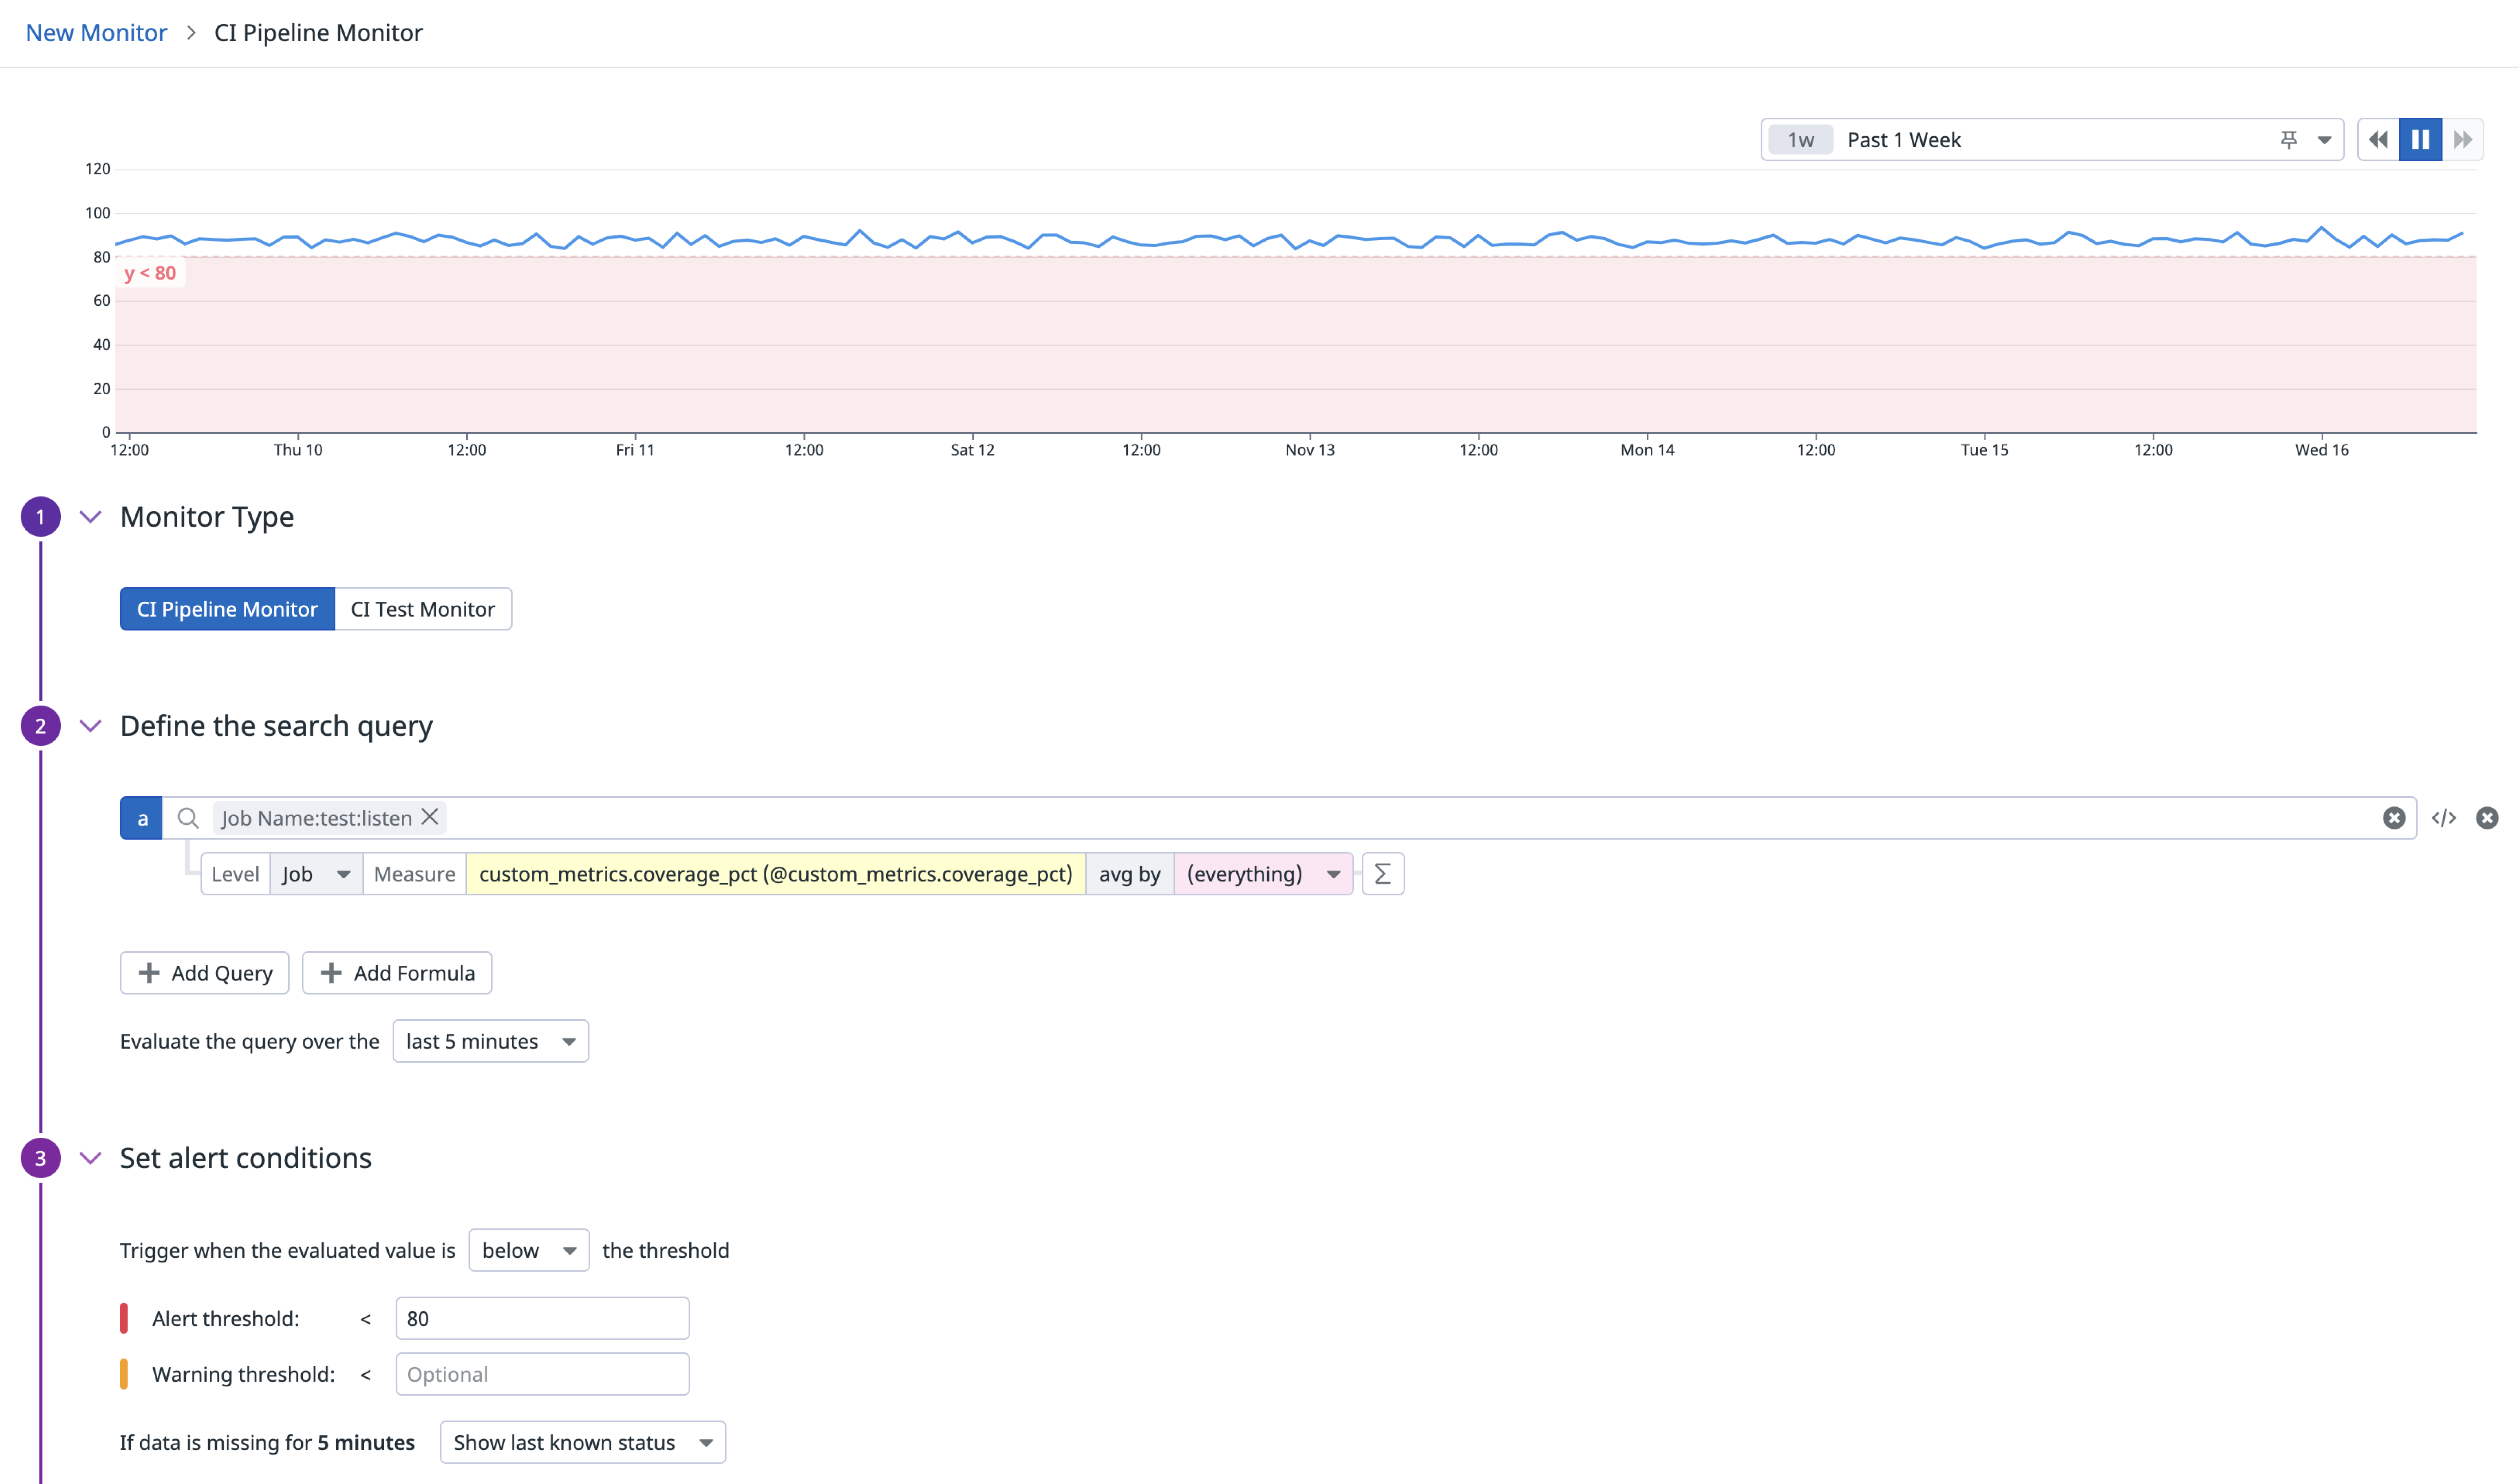
Maintain code coverage percentage
Custom metrics, such as code coverage percentage, can be created and used within monitors. The monitor below sends alerts when code coverage dips below a certain percentage, which can help with maintaining test performance over time.
For more information, see Code Coverage.
Further Reading
Additional helpful documentation, links, and articles:


