- Essentials
- Getting Started
- Datadog
- Datadog Site
- DevSecOps
- Serverless for AWS Lambda
- Agent
- Integrations
- Containers
- Dashboards
- Monitors
- Logs
- APM Tracing
- Profiler
- Tags
- API
- Service Catalog
- Session Replay
- Continuous Testing
- Synthetic Monitoring
- Incident Management
- Database Monitoring
- Cloud Security Management
- Cloud SIEM
- Application Security Management
- Workflow Automation
- CI Visibility
- Test Visibility
- Intelligent Test Runner
- Code Analysis
- Learning Center
- Support
- Glossary
- Standard Attributes
- Guides
- Agent
- Integrations
- OpenTelemetry
- Developers
- Authorization
- DogStatsD
- Custom Checks
- Integrations
- Create an Agent-based Integration
- Create an API Integration
- Create a Log Pipeline
- Integration Assets Reference
- Build a Marketplace Offering
- Create a Tile
- Create an Integration Dashboard
- Create a Recommended Monitor
- Create a Cloud SIEM Detection Rule
- OAuth for Integrations
- Install Agent Integration Developer Tool
- Service Checks
- IDE Plugins
- Community
- Guides
- API
- Datadog Mobile App
- CoScreen
- Cloudcraft
- In The App
- Dashboards
- Notebooks
- DDSQL Editor
- Sheets
- Monitors and Alerting
- Infrastructure
- Metrics
- Watchdog
- Bits AI
- Service Catalog
- API Catalog
- Error Tracking
- Service Management
- Infrastructure
- Application Performance
- APM
- Continuous Profiler
- Database Monitoring
- Data Streams Monitoring
- Data Jobs Monitoring
- Digital Experience
- Real User Monitoring
- Product Analytics
- Synthetic Testing and Monitoring
- Continuous Testing
- Software Delivery
- CI Visibility
- CD Visibility
- Test Visibility
- Intelligent Test Runner
- Code Analysis
- Quality Gates
- DORA Metrics
- Security
- Security Overview
- Cloud SIEM
- Cloud Security Management
- Application Security Management
- AI Observability
- Log Management
- Observability Pipelines
- Log Management
- Administration
Database Monitoring Monitor
Overview
With the Database Monitoring (DBM) monitor type, you can create monitors and alert on the data surfaced in DBM. These monitors can be configured to alert you when a DBM event type deviates from a predefined threshold over a given period of time.
Common monitoring scenarios include
- Number of waiting queries
- Number of queries exceeding a given duration
- Significant changes in explain-plan cost
For step-by-step instructions, see Example monitors.
Monitor creation
To create a new DBM monitor in Datadog, navigate to Monitors > New Monitor > Database Monitoring in the UI.
Note: There is a default limit of 1000 DBM monitors per account. If you are encountering this limit, consider using multi alerts, or Contact Support to lift this limit for your account.
Define the search query
Note: As your query changes, the chart above the search bar updates in response.
Common monitor types
If you don’t wish to create your monitor from scratch, you can use one of the following pre-defined monitor types:
- Waiting Queries
- Long Running Queries
Any feedback on these existing monitor types and other ones you would like to see should be shared with your Customer Success Manager or the Support Team.
Creating monitors from scratch
- Determine whether you want to monitor Query Samples or Explain Plans and select the corresponding option from the dropdown menu.
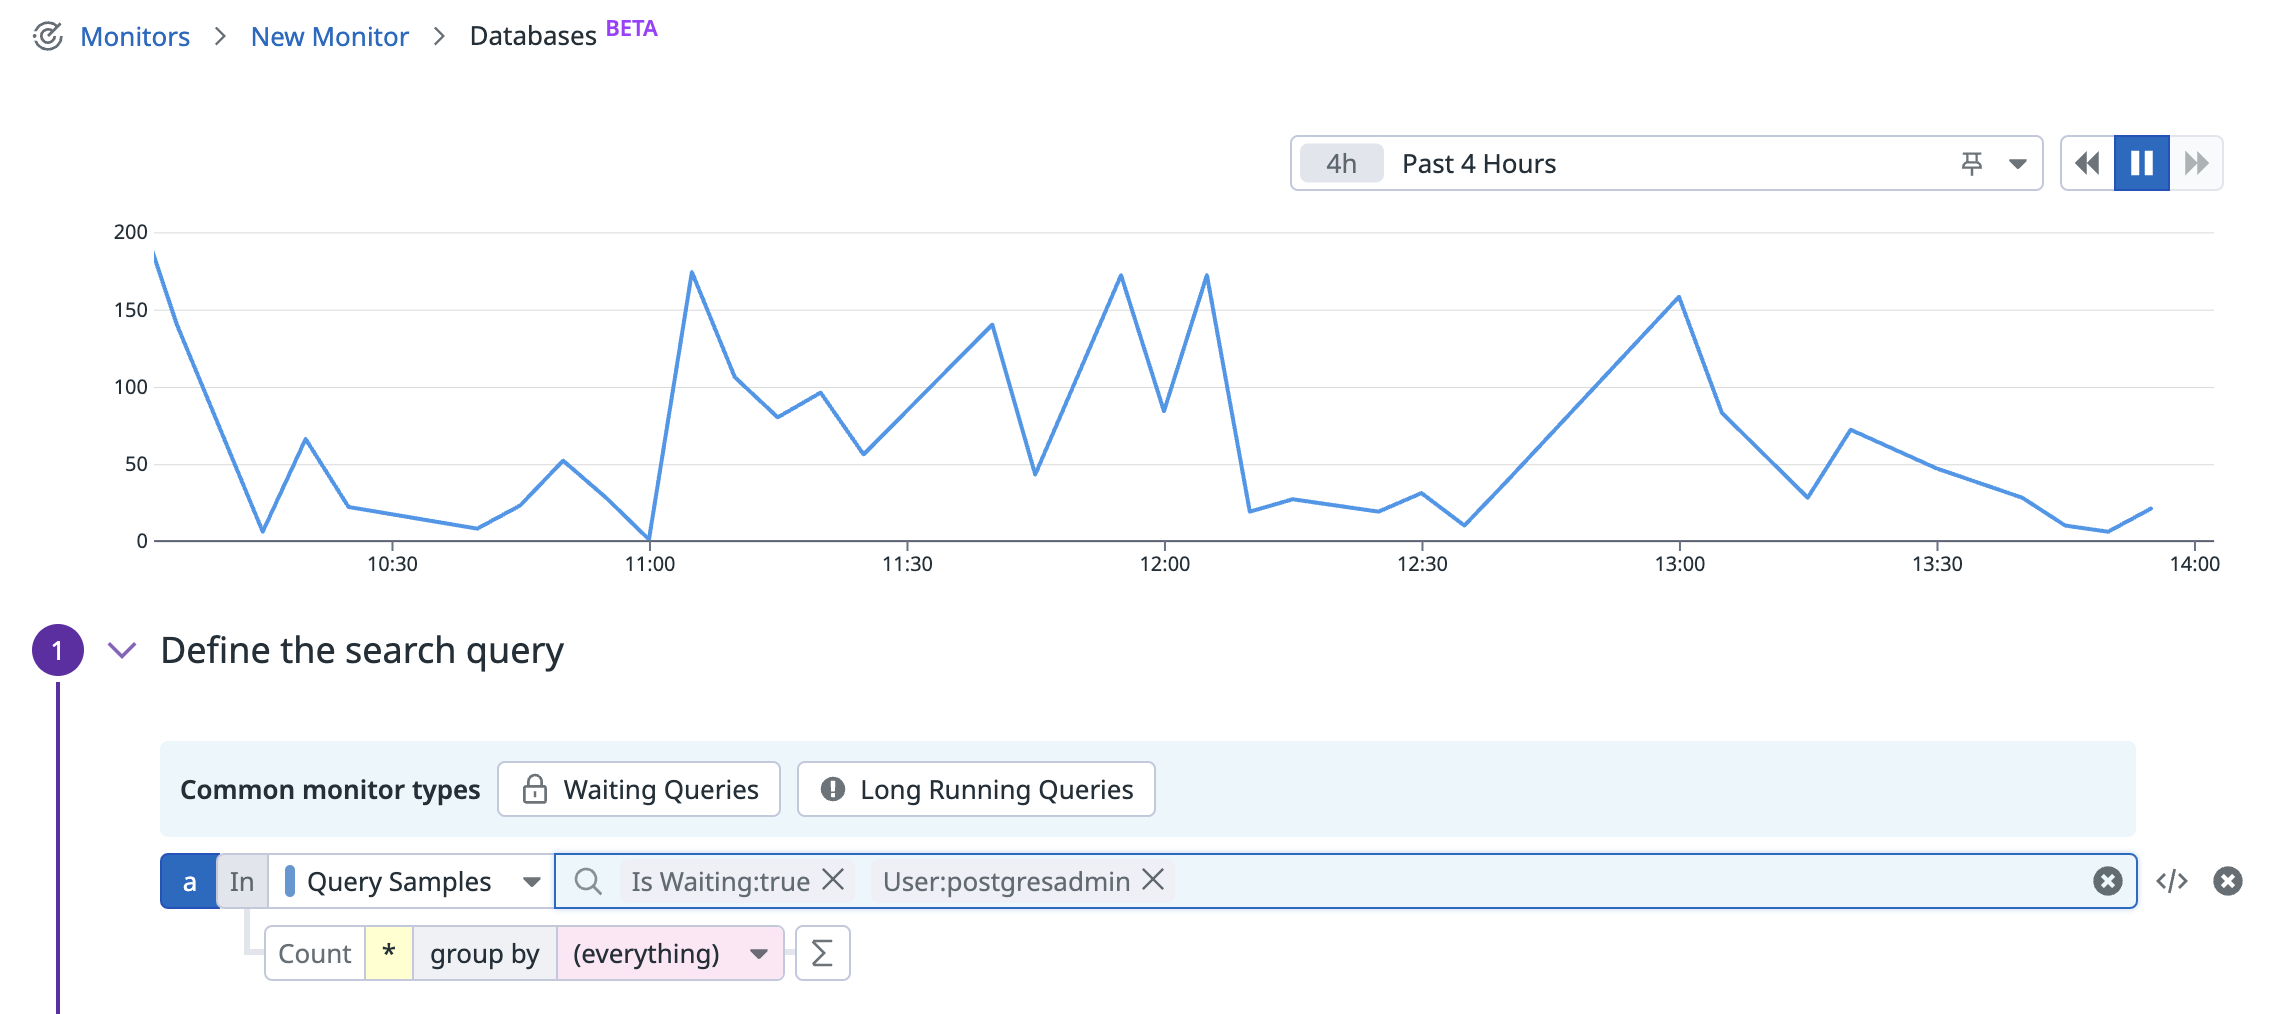
- Construct a search query using the same logic as in the DBM Query Samples activity and explain plan explorer. This means that you should select one or more facets to include in the search bar. For example, if you wanted to alert on the waiting queries executed by user
postgresadmin, then your search bar would look like this:
Note: The monitor you configure alerts over the unique value count of the facets.
- You also have the option to group DBM events by multiple dimensions. All DBM events matching the query are grouped together based on the values of up to five facets. With the group by functionality, you also have the ability to configure the alerting grouping strategy:
- Simple Alert: Simple Alerts aggregate over all reporting sources, so one alert triggers when one or multiple groups values breach the threshold. You may use this strategy to reduce notification noise.
- Multi Alert: Multi Alerts apply the alert to each source according to your group parameters, meaning that an alerting event is generated for each group that meets the set conditions. For example, you can group a query by
@db.userand select the Multi Alert Aggregation type to receive a separate alert for each database user that triggers the alert as you’ve defined it.
Set alert conditions
- Set an alert to trigger whenever a query result is
above,above or equal to,below, orbelow or equal toa threshold that you define. For help configuring the options in this view, see Configure Monitors. - Determine your desired behavior for when data is missing for 5 minutes, for example,
evaluate as zero,show NO DATA,show NO DATA and notify, orshow OK.
No data and below alerts
To receive a notification when an application has stopped sending DBM events, set the condition to below 1. This alert triggers when no DBM events match the monitor query in a given time frame across all aggregate groups.
When you split the monitor by any dimension (tag or facet) and use a below condition, the alert is triggered if and only if:
- There are DBM events for a given group, but the count is below the threshold.
- There are no DBM events for any of the groups.
Advanced alert conditions
For more information about advanced alert options such as evaluation delay, see Configure Monitors.
Notifications
For more information about the Configure notifications and automations section, see Notifications.
Example monitors
Number of waiting queries
This monitor detects whether the number of waiting queries has exceeded a given threshold.
Build the monitoring query
- In Datadog, go to Monitors > New Monitor > Database Monitoring.
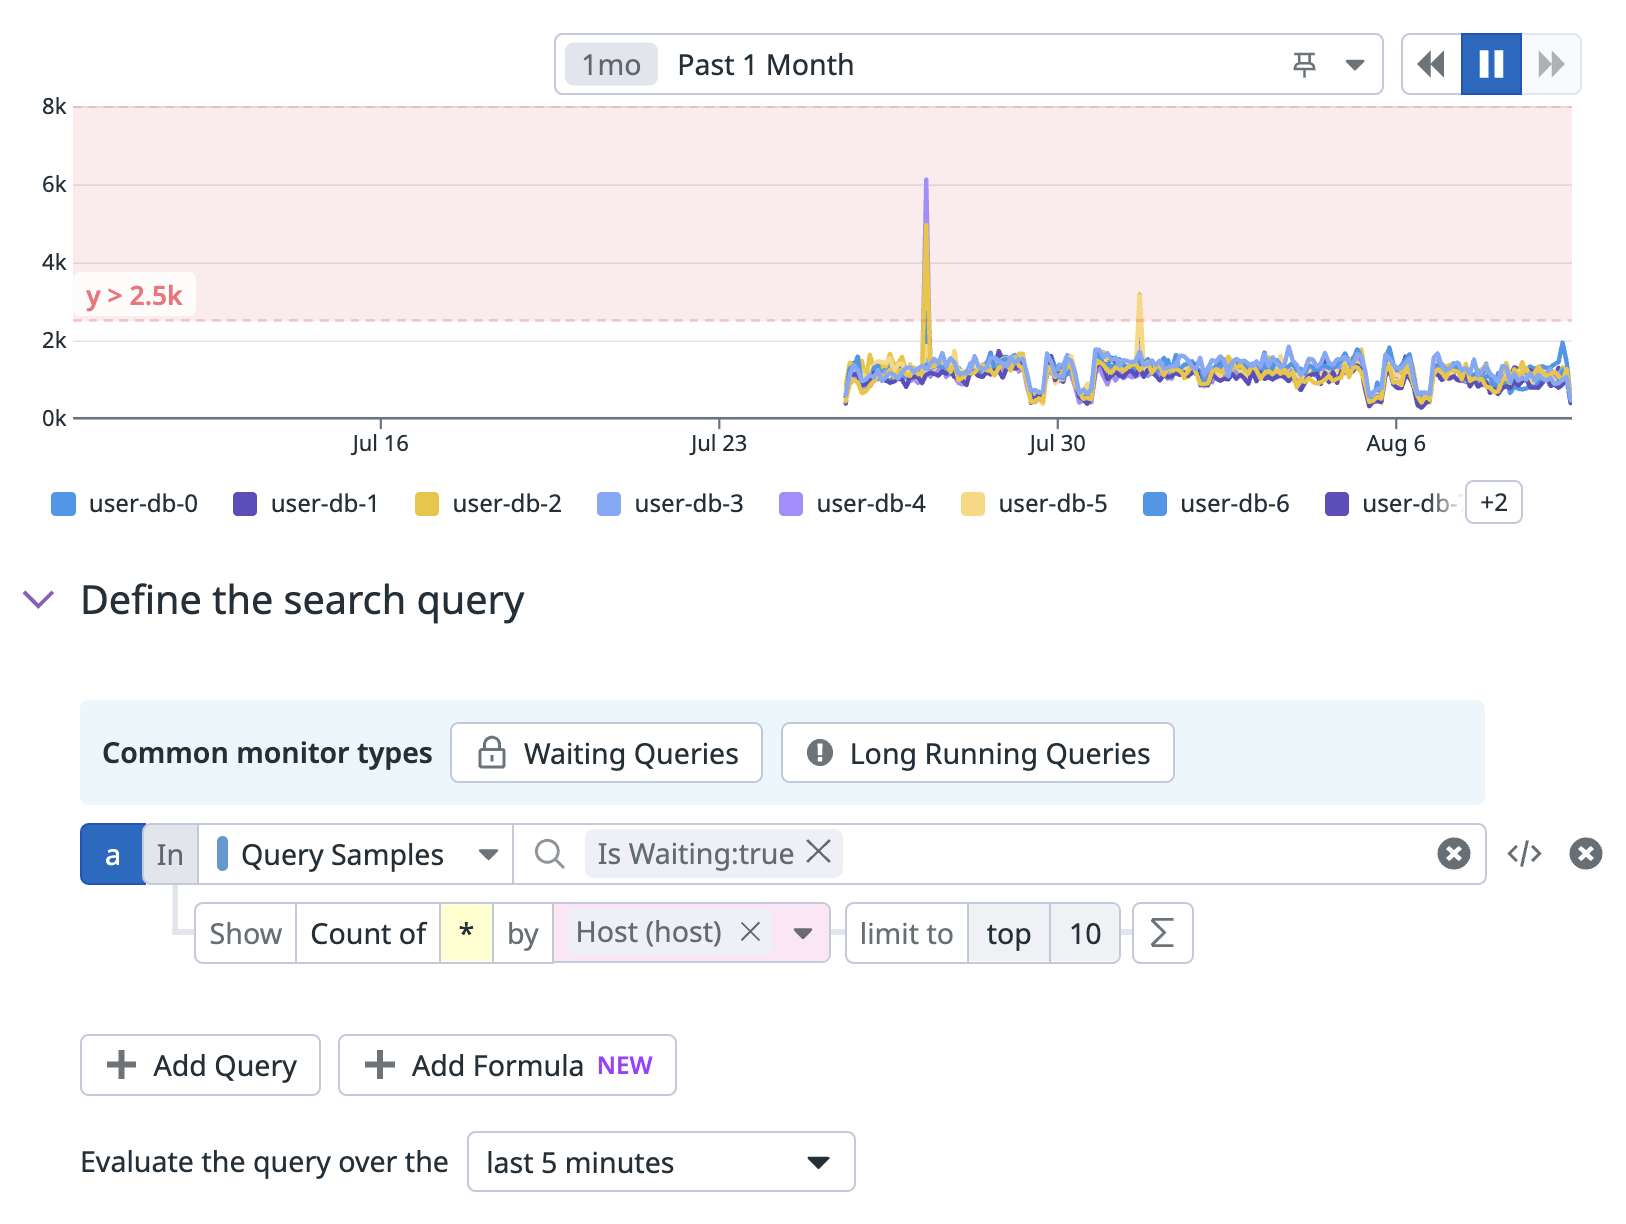
- In the Common monitor types box, click Waiting Queries.
Set the alert threshold
- To gain context on the range of typical values, set the time frame to Past 1 Month using the dropdown menu at the top of the chart.
- Enter your chosen alerting threshold value in the Alert threshold box. For example, if the number of waiting queries stays below
3000on the chart, you might set Alert threshold to4000to represent unusual activity. For configuration details, see Set alert conditions and Advanced alert conditions. - Use the red shaded area on the chart to verify that your alert won’t trigger too rarely or too often, and adjust the threshold value as needed.
Configure notifications
- Under Configure notifications and automations, write the notification message. For detailed instructions, see Notifications. You can use this text for the message body:
{{#is_alert}} Waiting queries on {{host.name}} have exceeded {{threshold}} with a value of {{value}}. {{/is_alert}} {{#is_recovery}} The number of waiting queries on {{host.name}}, which exceeded {{threshold}}, has recovered. {{/is_recovery}} - Add yourself to the notification recipients by typing and then selecting your name in the Notify your services and your team members box.
Verify and save the monitor
- To verify the monitor setup, click Test Notifications. Trigger a test alert by choosing Alert, then click Run Test.
- Click Create to save the monitor.
Queries exceeding 30 seconds
This monitor detects whether the number of long-running queries has exceeded a given threshold.
Build the monitoring query
- In Datadog, go to Monitors > New Monitor > Database Monitoring.
- In Common monitor types, click Long Running Queries.
- Update the query filter to Duration:>30s.
Set the alert threshold
- To gain context on the range of typical values, set the time frame to Past 1 Month using the dropdown menu at the top of the chart.
- Enter your chosen alerting threshold value in the Alert threshold box. For example, if the values on the chart stay below
2000, you might set Alert threshold to2500to represent unusual activity. For configuration details, see Set alert conditions and Advanced alert conditions. - Use the red shaded area on the chart to verify that your alert won’t trigger too rarely or too often, and adjust the threshold value as needed.
Configure notifications
- Under Configure notifications and automations, write the notification message. For detailed instructions, see Notifications. You can use this text for the message body:
{{#is_alert}} The number of queries with a duration of >30s has exceeded {{threshold}} on {{host.name}} with a value of {{value}}. {{/is_alert}} {{#is_recovery}} The number of queries with a duration of >30s on {{host.name}}, which exceeded {{threshold}}, has recovered. {{/is_recovery}} - Add yourself to the notification recipients by typing and then selecting your name in the Notify your services and your team members box.
Verify and save the monitor
- To verify the monitor setup, click Test Notifications. Trigger a test alert by choosing Alert, then click Run Test.
- Click Create to save the monitor.
Change in explain-plan cost
This monitor detects a significant change in daily average explain-plan cost by comparing the results of two queries:
- Query a reflects the current explain-plan cost
- Query b reflects the explain-plan cost a week ago
This allows the comparison of two consecutive Mondays, for example.
With minor changes, the monitor can instead reflect hourly averages, measure the difference between today and yesterday, group by query signature instead of host, and so on.
Build the first monitoring query
- In Datadog, go to Monitors > New Monitor > Database Monitoring.
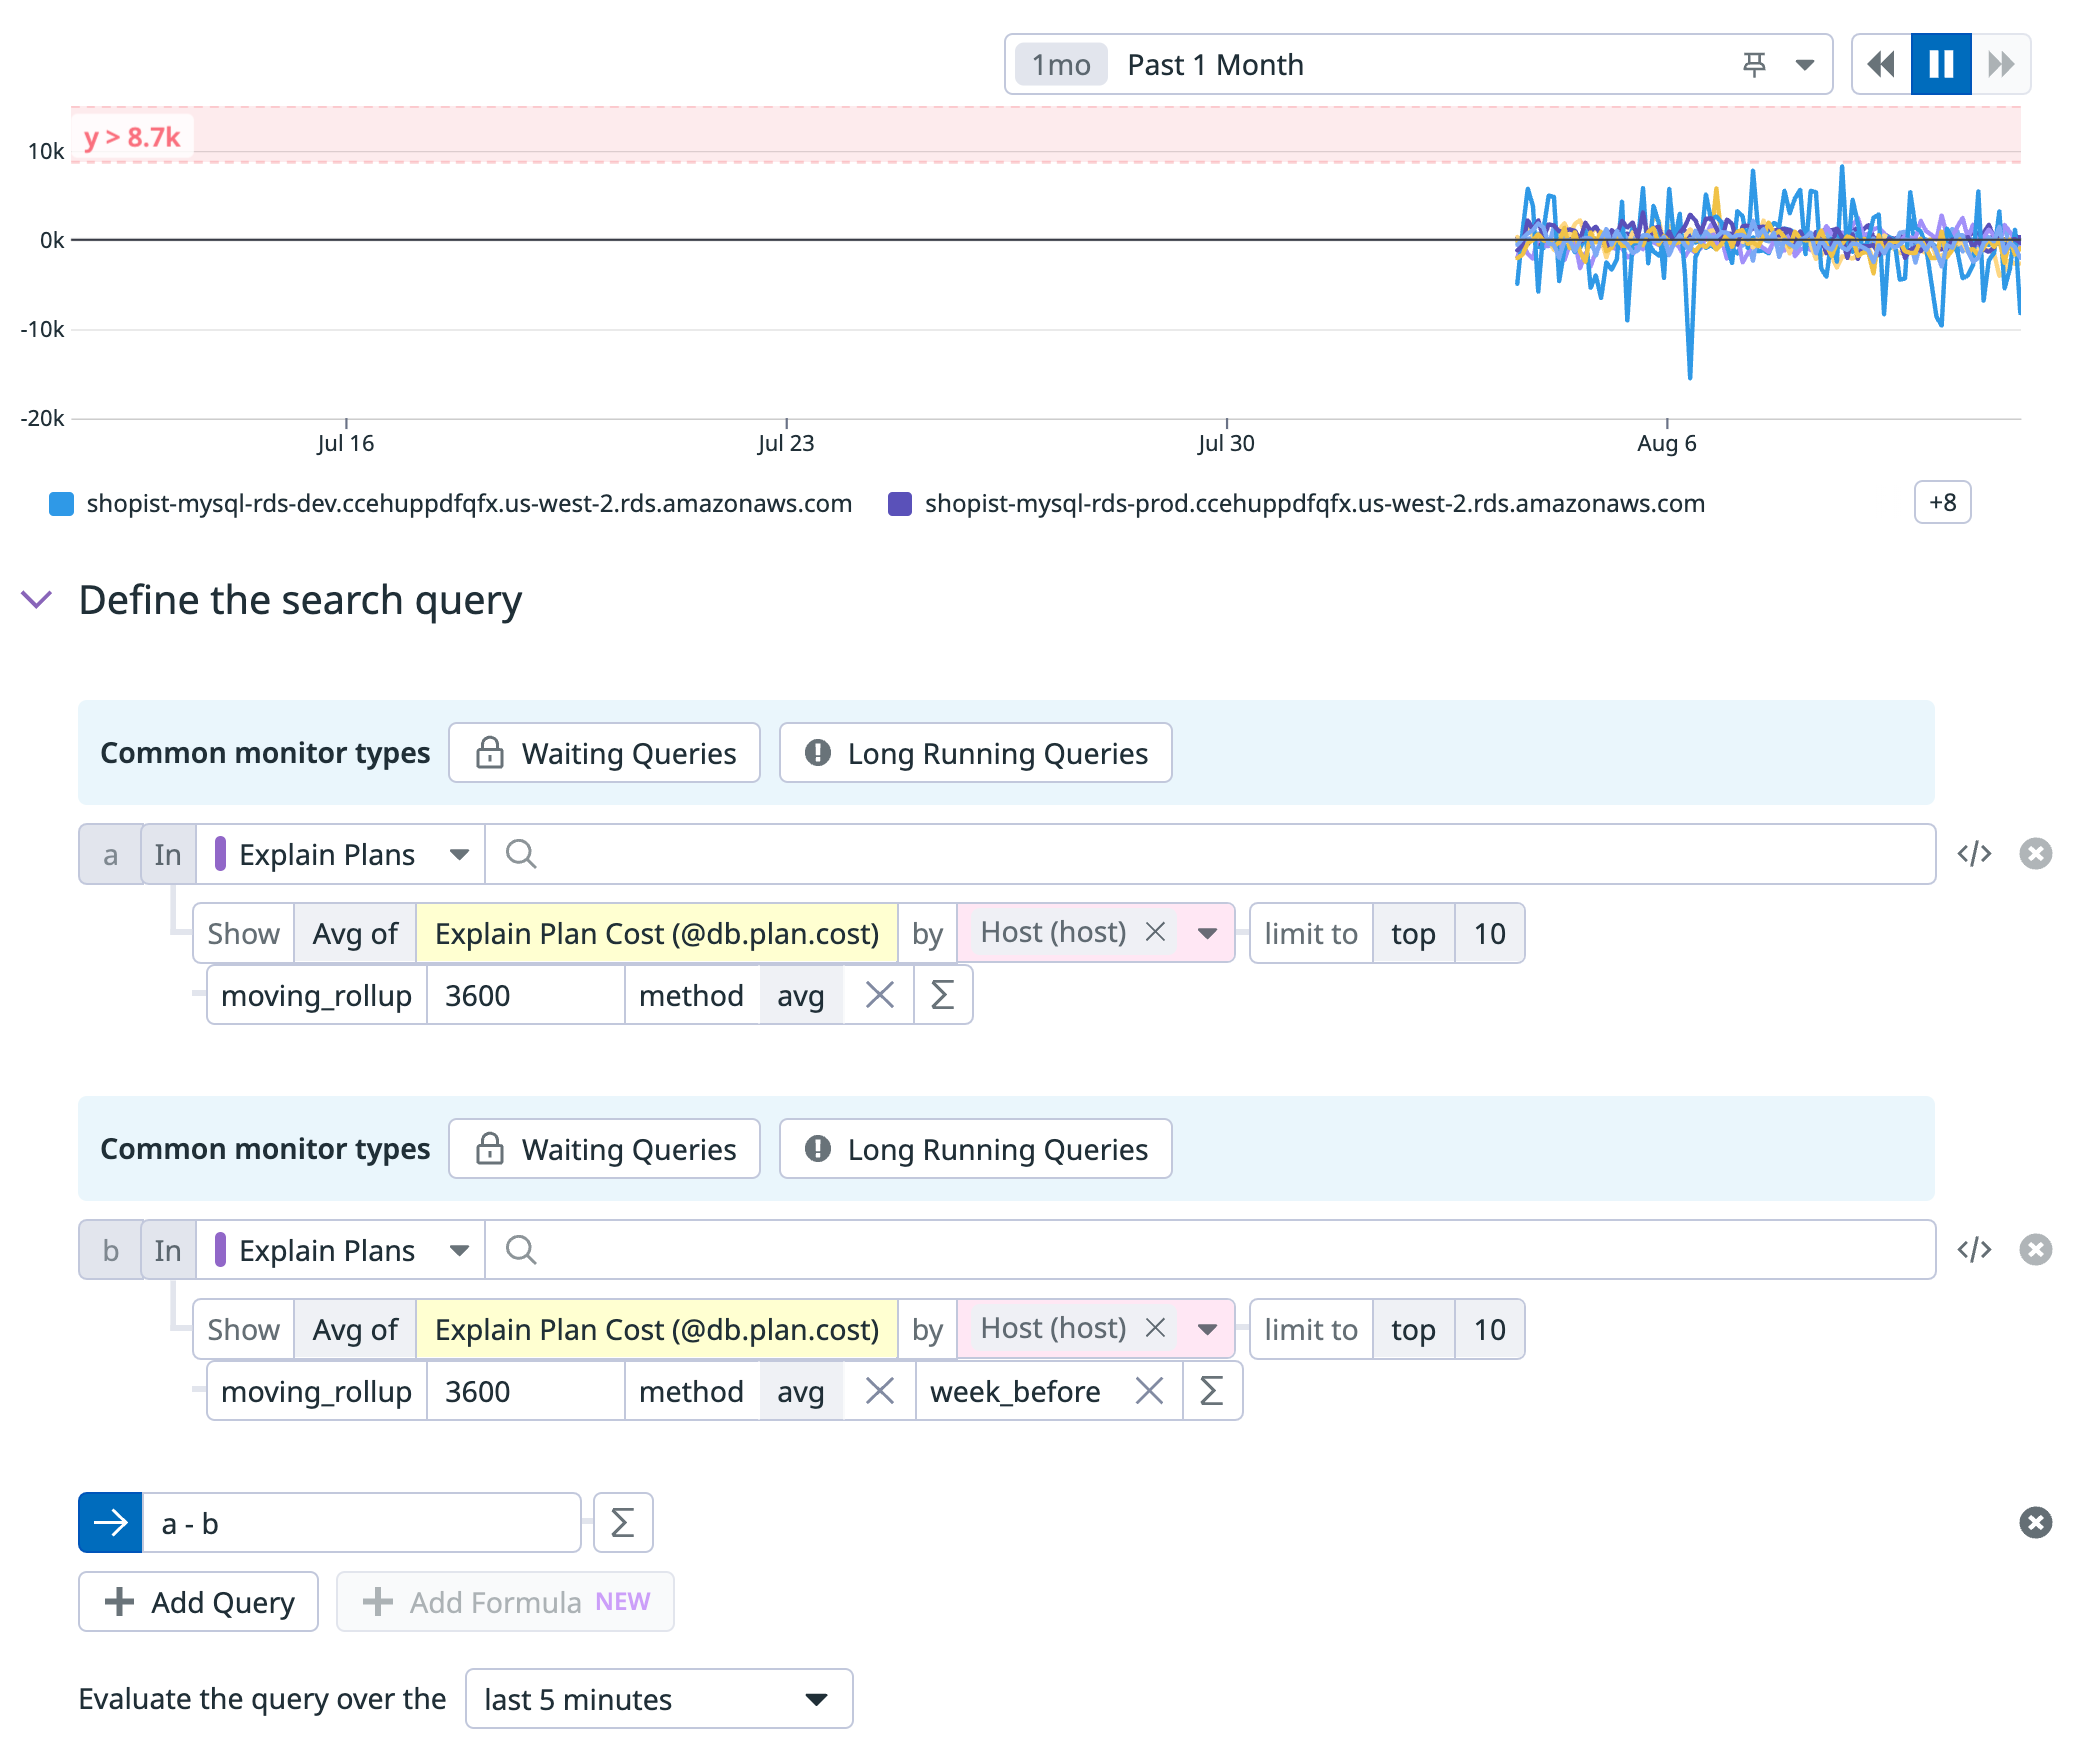
- Under Define the search query, make the following updates:
- Change Query Samples to Explain Plans.
- Change * to Explain Plan Cost (@db.plan.cost). Typing “cost” into the field populates the autocomplete options.
- Change (everything) to Host (host).
- Click the ∑ button and type rollup to populate the autocomplete suggestions. Choose moving_rollup.
Build the second monitoring query
- Click Add Query to create query b, a copy of query a.
- Change a + b to a - b. Because the two queries are temporarily identical, this value displays on the chart as 0.
- In the b query, click the ∑ button and choose Timeshift > Week before. This configures the monitor to detect significant changes between last week and the present.
Set the alert threshold
- In the dropdown menu at the top of the chart, expand the time frame to Past 1 Month to gain context on the typical cost variation from week to week.
- Enter your chosen alerting threshold value in the alert threshold box. For example, if the difference in explain-plan cost stays below
8000on the chart, you might set alert threshold to9000to represent unusual activity. For configuration details, see Set alert conditions and Advanced alert conditions. - Use the red shaded area on the chart to verify that your alert won’t trigger too rarely or too often, and adjust the threshold value as needed.
Configure notifications
- Under Configure notifications and automations, write the notification message. For detailed instructions, see Notifications. You can use this text for the message body:
{{#is_alert}} The daily average explain-plan cost on {{host.name}} has increased by at least {{threshold}} versus one week ago, with a value of {{value}}. {{/is_alert}} {{#is_recovery}} The daily average explain-plan cost on {{host.name}} has recovered to within {{threshold}} of the cost on this day last week. {{/is_recovery}} - Add yourself to the notification recipients by typing and then selecting your name in the Notify your services and your team members box.
Verify and save the monitor
- To verify the monitor setup, click Test Notifications. Trigger a test alert by choosing Alert, then click Run Test.
- Click Create to save the monitor.


