- Essentials
- Getting Started
- Datadog
- Datadog Site
- DevSecOps
- Serverless for AWS Lambda
- Agent
- Integrations
- Containers
- Dashboards
- Monitors
- Logs
- APM Tracing
- Profiler
- Tags
- API
- Service Catalog
- Session Replay
- Continuous Testing
- Synthetic Monitoring
- Incident Management
- Database Monitoring
- Cloud Security Management
- Cloud SIEM
- Application Security Management
- Workflow Automation
- CI Visibility
- Test Visibility
- Intelligent Test Runner
- Code Analysis
- Learning Center
- Support
- Glossary
- Standard Attributes
- Guides
- Agent
- Integrations
- OpenTelemetry
- Developers
- Authorization
- DogStatsD
- Custom Checks
- Integrations
- Create an Agent-based Integration
- Create an API Integration
- Create a Log Pipeline
- Integration Assets Reference
- Build a Marketplace Offering
- Create a Tile
- Create an Integration Dashboard
- Create a Recommended Monitor
- Create a Cloud SIEM Detection Rule
- OAuth for Integrations
- Install Agent Integration Developer Tool
- Service Checks
- IDE Plugins
- Community
- Guides
- API
- Datadog Mobile App
- CoScreen
- Cloudcraft
- In The App
- Dashboards
- Notebooks
- DDSQL Editor
- Sheets
- Monitors and Alerting
- Infrastructure
- Metrics
- Watchdog
- Bits AI
- Service Catalog
- API Catalog
- Error Tracking
- Service Management
- Infrastructure
- Application Performance
- APM
- Continuous Profiler
- Database Monitoring
- Data Streams Monitoring
- Data Jobs Monitoring
- Digital Experience
- Real User Monitoring
- Product Analytics
- Synthetic Testing and Monitoring
- Continuous Testing
- Software Delivery
- CI Visibility
- CD Visibility
- Test Visibility
- Intelligent Test Runner
- Code Analysis
- Quality Gates
- DORA Metrics
- Security
- Security Overview
- Cloud SIEM
- Cloud Security Management
- Application Security Management
- AI Observability
- Log Management
- Observability Pipelines
- Log Management
- Administration
NetFlow Monitor
Join the Beta!
The NetFlow monitor is in private beta. Reach out to your Datadog representative to sign up for access.
Overview
Datadog Network Device Monitoring (NDM) provides visibility into your on-premises and virtual network devices, such as routers, switches, and firewalls. As a part of NDM, NetFlow Monitoring enables you to examine, interpret, and analyze your network traffic flow data over time, and identify top contributors to network congestion.
After enabling NetFlow Monitoring, you can create a NetFlow monitor to alert you when a flow metric (such as network throughput for a specific source or destination pair) crosses a threshold that you have set.
Monitor creation
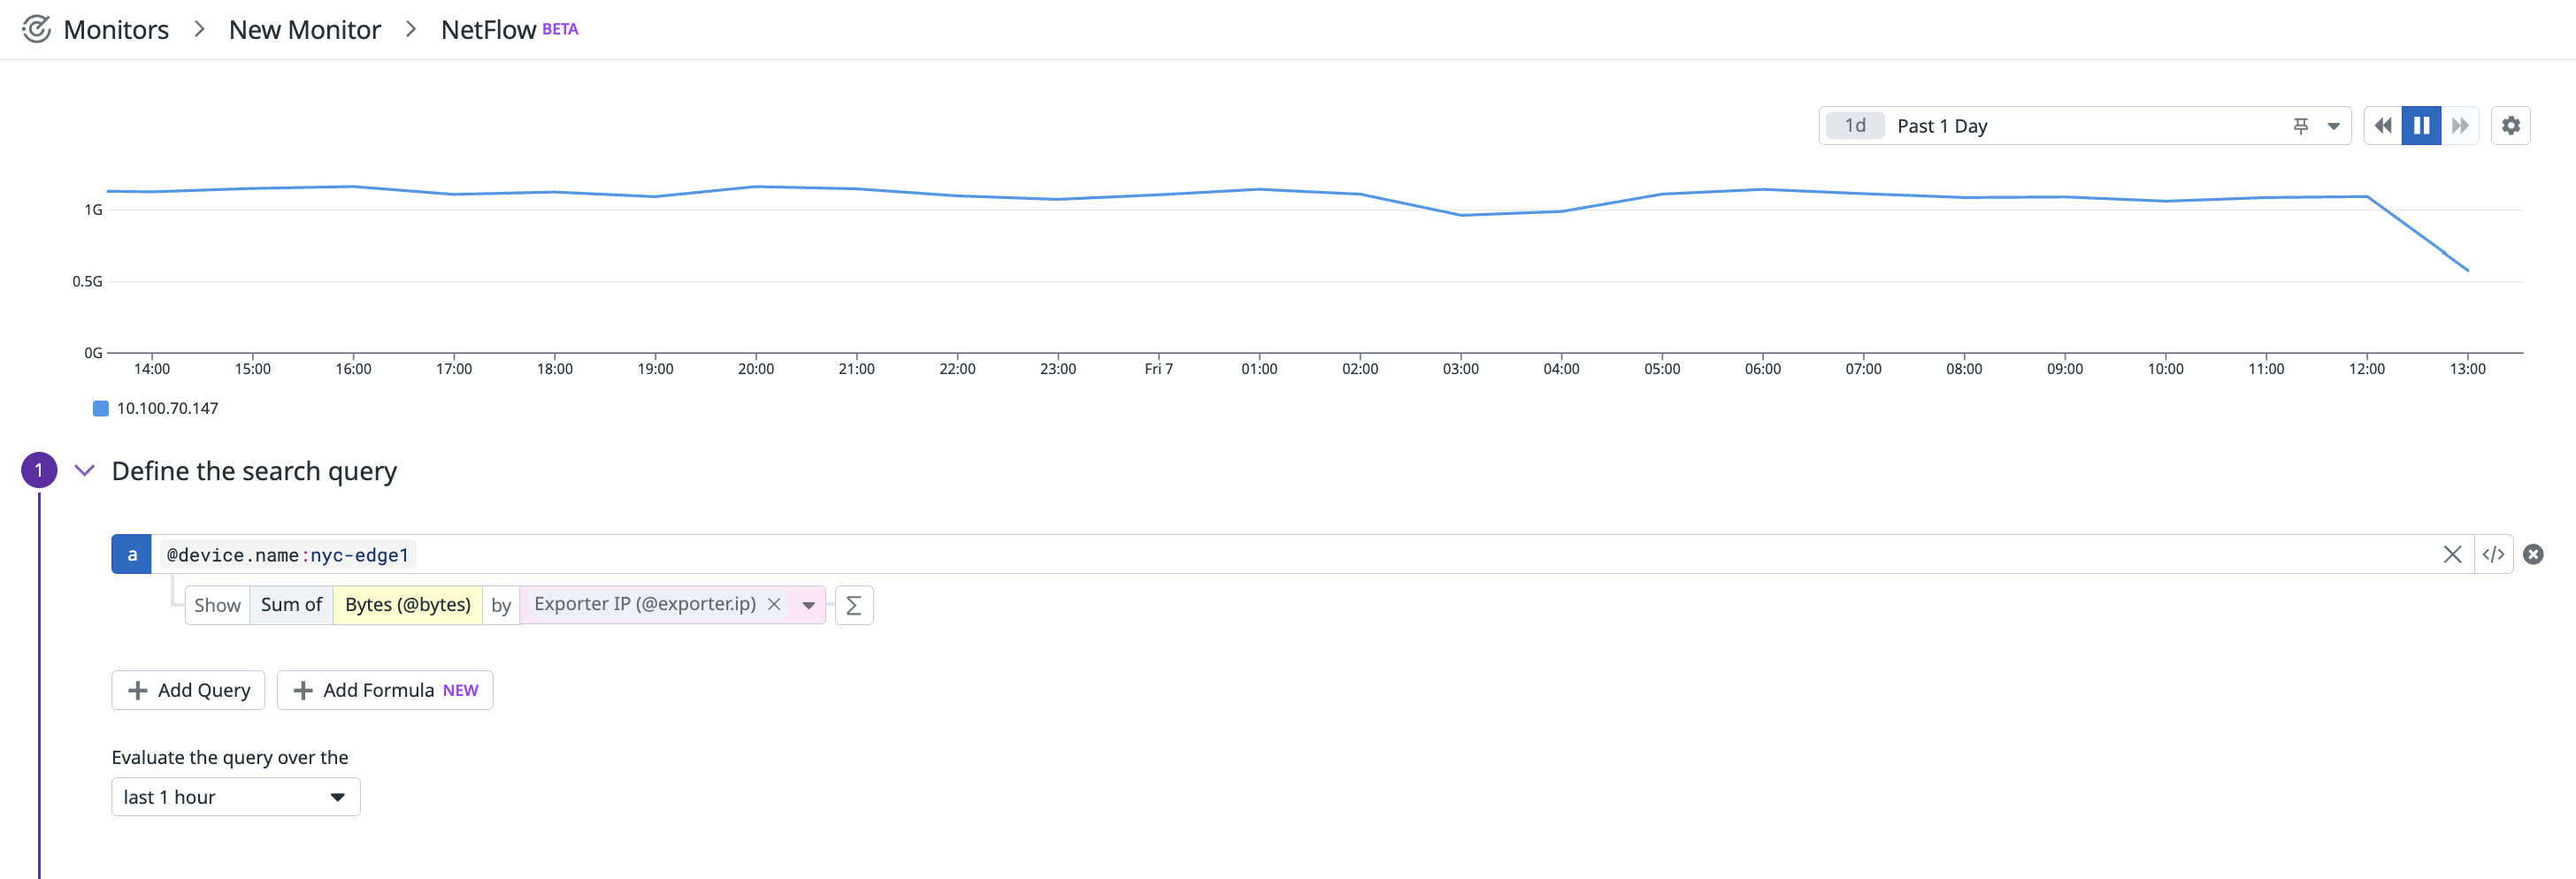
To create a NetFlow monitor in Datadog, use the main navigation: Monitors –> New Monitor –> NetFlow.
Define the search query
As you define the search query, the top graph updates in real time.
- Construct a search query using the same logic as the NetFlow widgets in your dashboards.
- Select if you want to alert on bytes or packets for traffic.
- Choose the tags you want to filter the alerted traffic by. See the full list of available facets.
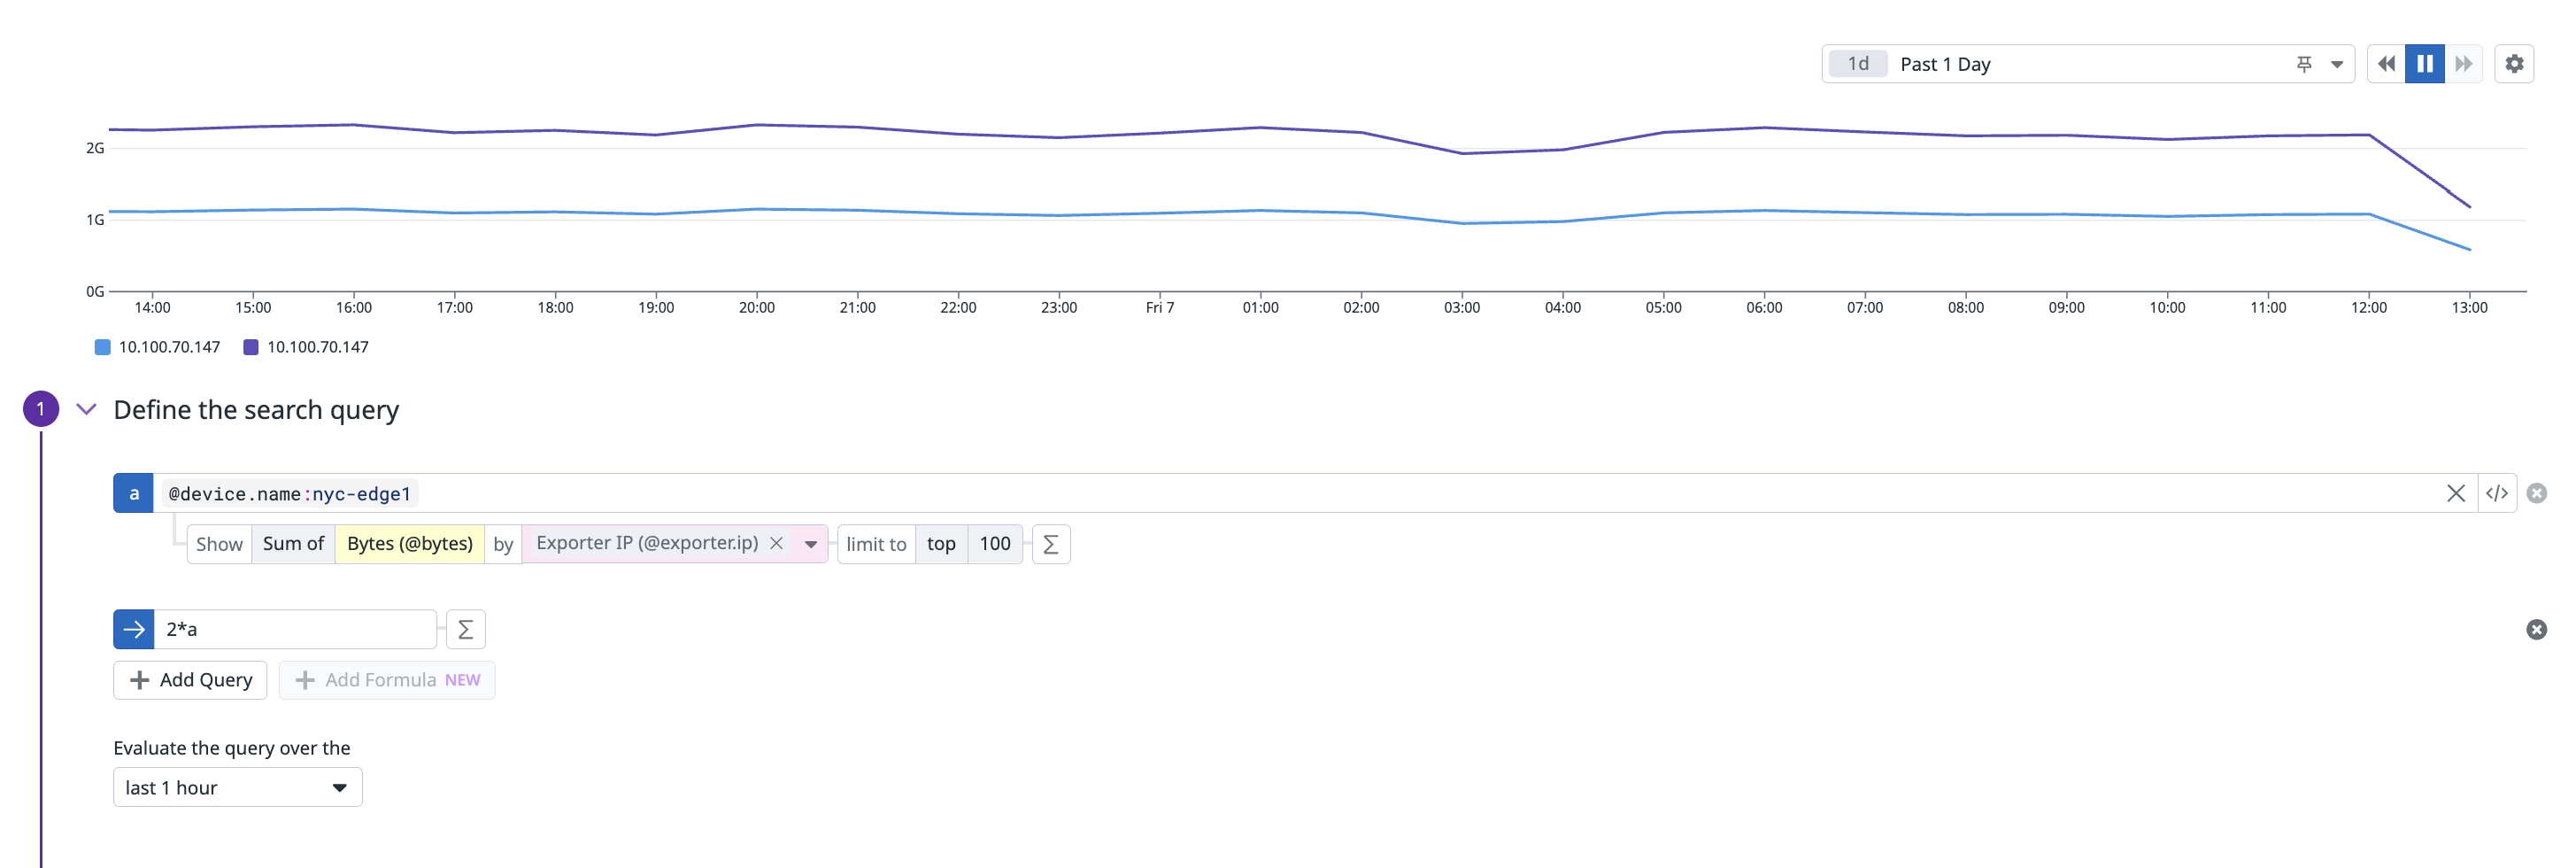
Using formulas and functions
You can create NetFlow monitors using formulas and functions. This can be used, for example, to create monitors on the volume of traffic sent by source and device.
For more information, see the Functions documentation.
Set alert conditions
Configure monitors to trigger if the query value crosses a threshold, and customize advanced alert options for recovery thresholds and evaluation delays. For more information, see Configure Monitors.
Notifications
For detailed instructions on the Say what’s happening and Notify your team sections, see the Notifications page.
Monitor NetFlow events
For more information about events you can create NetFlow monitors on, see the NetFlow Monitoring documentation.
Further Reading
Additional helpful documentation, links, and articles:


