- Essentials
- Getting Started
- Datadog
- Datadog Site
- DevSecOps
- Serverless for AWS Lambda
- Agent
- Integrations
- Containers
- Dashboards
- Monitors
- Logs
- APM Tracing
- Profiler
- Tags
- API
- Service Catalog
- Session Replay
- Continuous Testing
- Synthetic Monitoring
- Incident Management
- Database Monitoring
- Cloud Security Management
- Cloud SIEM
- Application Security Management
- Workflow Automation
- CI Visibility
- Test Visibility
- Intelligent Test Runner
- Code Analysis
- Learning Center
- Support
- Glossary
- Standard Attributes
- Guides
- Agent
- Integrations
- OpenTelemetry
- Developers
- Authorization
- DogStatsD
- Custom Checks
- Integrations
- Create an Agent-based Integration
- Create an API Integration
- Create a Log Pipeline
- Integration Assets Reference
- Build a Marketplace Offering
- Create a Tile
- Create an Integration Dashboard
- Create a Recommended Monitor
- Create a Cloud SIEM Detection Rule
- OAuth for Integrations
- Install Agent Integration Developer Tool
- Service Checks
- IDE Plugins
- Community
- Guides
- API
- Datadog Mobile App
- CoScreen
- Cloudcraft
- In The App
- Dashboards
- Notebooks
- DDSQL Editor
- Sheets
- Monitors and Alerting
- Infrastructure
- Metrics
- Watchdog
- Bits AI
- Service Catalog
- API Catalog
- Error Tracking
- Service Management
- Infrastructure
- Application Performance
- APM
- Continuous Profiler
- Database Monitoring
- Data Streams Monitoring
- Data Jobs Monitoring
- Digital Experience
- Real User Monitoring
- Product Analytics
- Synthetic Testing and Monitoring
- Continuous Testing
- Software Delivery
- CI Visibility
- CD Visibility
- Test Visibility
- Intelligent Test Runner
- Code Analysis
- Quality Gates
- DORA Metrics
- Security
- Security Overview
- Cloud SIEM
- Cloud Security Management
- Application Security Management
- AI Observability
- Log Management
- Observability Pipelines
- Log Management
- Administration
Health Metrics
Overview
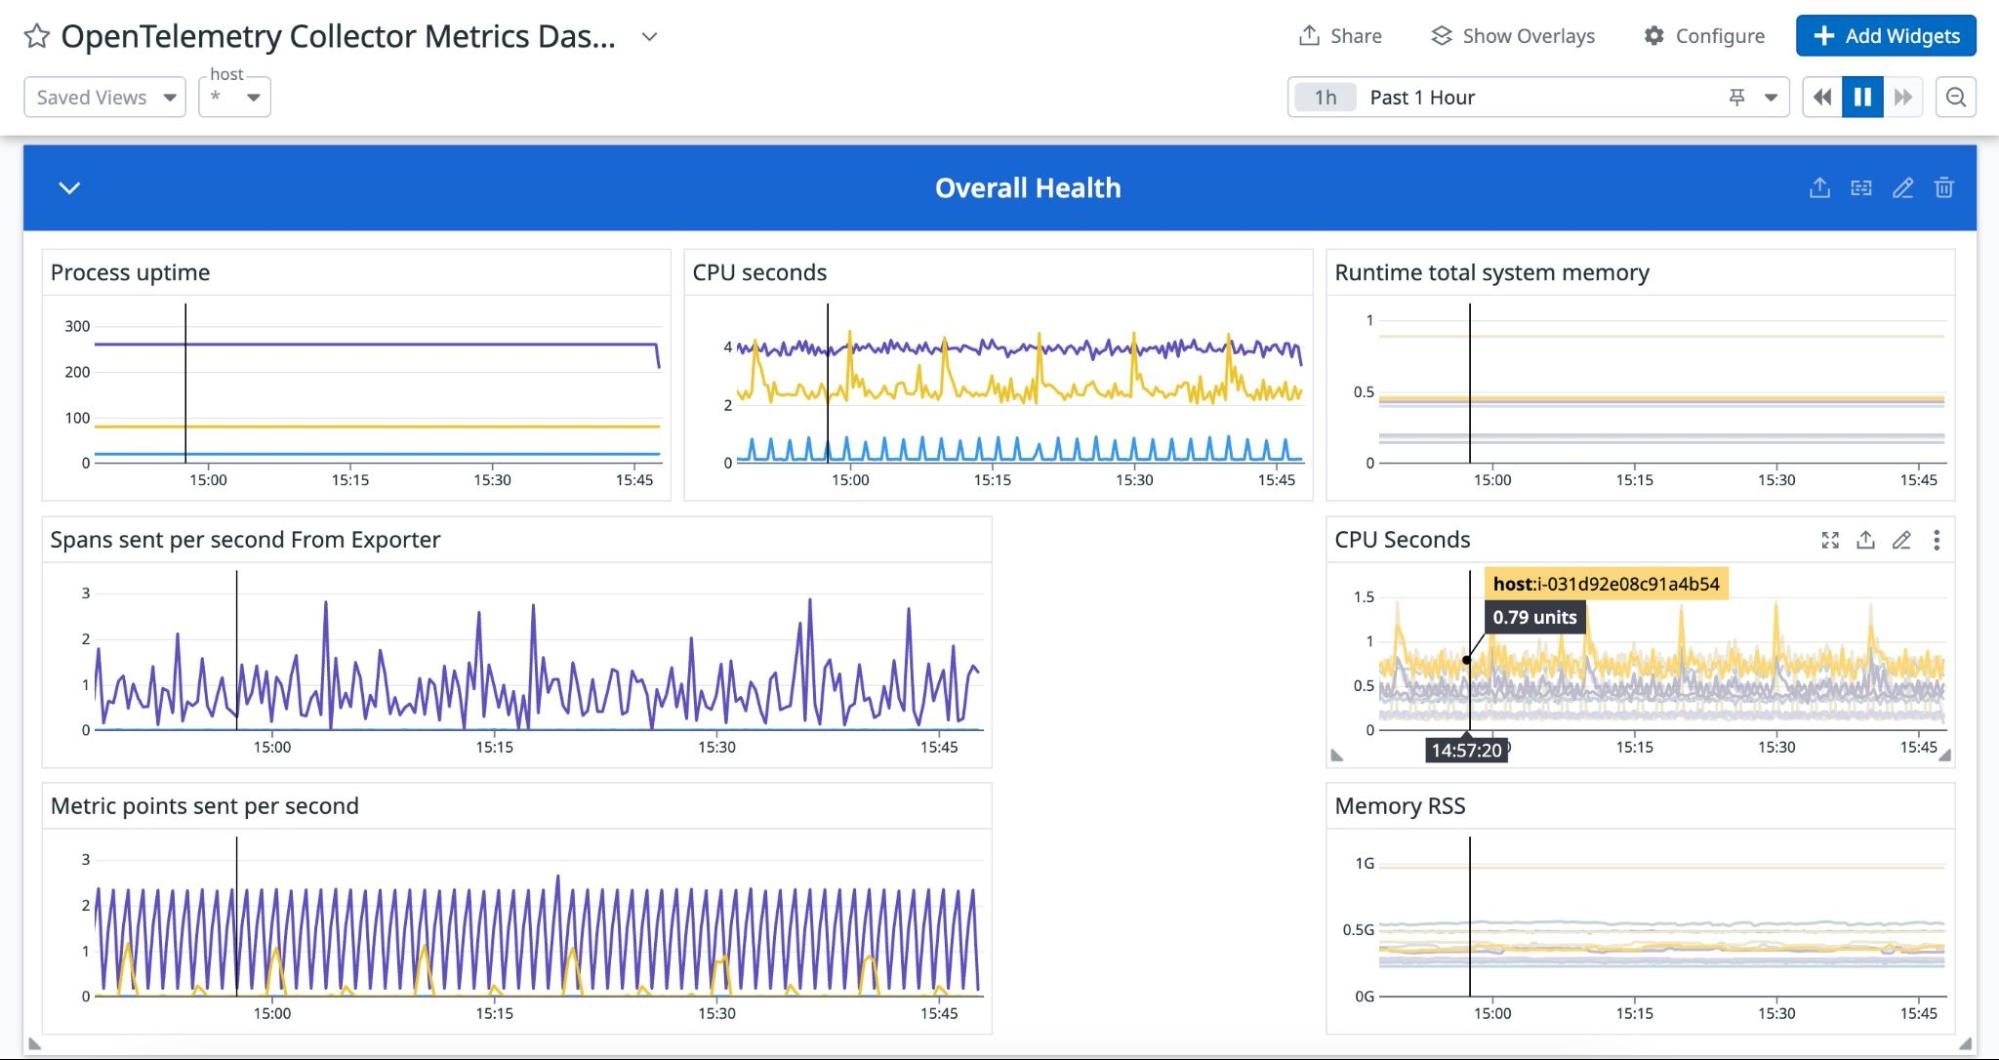
To collect health metrics from the OpenTelemetry Collector itself, configure the Prometheus receiver in your Datadog Exporter.
For more information, see the OpenTelemetry project documentation for the Prometheus receiver.
Setup
Add the following lines to your Collector configuration:
receivers:
  prometheus:
    config:
      scrape_configs:
      - job_name: 'otelcol'
        scrape_interval: 10s
        static_configs:
        - targets: ['0.0.0.0:8888']
Data collected
| OpenTelemetry Metric | Description |
|---|---|
otelcol_process_uptime | Uptime of the process |
otelcol_process_memory_rss | Total physical memory (resident set size) |
otelcol_exporter_queue_size | Current size of the retry queue (in batches) |
otelcol_exporter_sent_spans | Number of spans successfully sent to destination |
otelcol_exporter_send_failed_metric_points | Number of metric points in failed attempts to send to destination |
otelcol_exporter_send_failed_spans | Number of spans in failed attempts to send to destination |
otelcol_process_cpu_seconds | Total CPU user and system time in seconds |
otelcol_receiver_refused_spans | Number of spans that could not be pushed into the pipeline |
otelcol_exporter_queue_capacity | Fixed capacity of the retry queue (in batches) |
otelcol_receiver_accepted_spans | Number of spans successfully pushed into the pipeline |
otelcol_exporter_sent_metric_points | Number of metric points successfully sent to destination |
otelcol_exporter_enqueue_failed_spans | Number of spans failed to be added to the sending queue |
otelcol_scraper_errored_metric_points | Number of metric points that were unable to be scraped |
otelcol_scraper_scraped_metric_points | Number of metric points successfully scraped |
otelcol_receiver_refused_metric_points | Number of metric points that could not be pushed into the pipeline |
otelcol_receiver_accepted_metric_points | Number of metric points successfully pushed into the pipeline |
otelcol_process_runtime_heap_alloc_bytes | Bytes of allocated heap objects (see ‘go doc runtime.MemStats.HeapAlloc’) |
otelcol_process_runtime_total_alloc_bytes | Cumulative bytes allocated for heap objects (see ‘go doc runtime.MemStats.TotalAlloc’) |
otelcol_exporter_enqueue_failed_log_records | Number of log records failed to be added to the sending queue |
otelcol_processor_batch_timeout_trigger_send | Number of times the batch was sent due to a timeout trigger |
otelcol_exporter_enqueue_failed_metric_points | Number of metric points failed to be added to the sending queue |
otelcol_process_runtime_total_sys_memory_bytes | Total bytes of memory obtained from the OS (see the Go docs for runtime.MemStats.Sys) |
otelcol_processor_batch_batch_size_trigger_send | Number of times the batch was sent due to a size trigger |
otelcol_exporter_sent_log_records | Number of log records successfully sent to destination |
otelcol_receiver_refused_log_records | Number of log records that could not be pushed into the pipeline |
otelcol_receiver_accepted_log_records | Number of log records successfully pushed into the pipeline |
Full example configuration
For a full working example configuration with the Datadog exporter, see collector-metrics.yaml.
Example logging output
ResourceMetrics #0
Resource SchemaURL: https://opentelemetry.io/schemas/1.6.1
Resource attributes:
     -> service.name: Str(opentelemetry-collector)
     -> net.host.name: Str(192.168.55.78)
     -> service.instance.id: Str(192.168.55.78:8888)
     -> net.host.port: Str(8888)
     -> http.scheme: Str(http)
     -> k8s.pod.ip: Str(192.168.55.78)
     -> cloud.provider: Str(aws)
     -> cloud.platform: Str(aws_ec2)
     -> cloud.region: Str(us-east-1)
     -> cloud.account.id: Str(XXXXXXXXX)
     -> cloud.availability_zone: Str(us-east-1c)
     -> host.id: Str(i-0368add8e328c28f7)
     -> host.image.id: Str(ami-08a2e6a8e82737230)
     -> host.type: Str(m5.large)
     -> host.name: Str(ip-192-168-53-115.ec2.internal)
     -> os.type: Str(linux)
     -> k8s.pod.name: Str(opentelemetry-collector-agent-gqwm8)
     -> k8s.daemonset.name: Str(opentelemetry-collector-agent)
     -> k8s.daemonset.uid: Str(6d6fef61-d4c7-4226-9b7b-7d6b893cb31d)
     -> k8s.node.name: Str(ip-192-168-53-115.ec2.internal)
     -> kube_app_name: Str(opentelemetry-collector)
     -> kube_app_instance: Str(opentelemetry-collector)
     -> k8s.namespace.name: Str(otel-staging)
     -> k8s.pod.start_time: Str(2023-11-20T12:53:23Z)
     -> k8s.pod.uid: Str(988d1bdc-5baf-4e98-942f-ab026a371daf)
ScopeMetrics #0
ScopeMetrics SchemaURL:
InstrumentationScope otelcol/prometheusreceiver 0.88.0-dev
Metric #0
Descriptor:
     -> Name: otelcol_otelsvc_k8s_namespace_added
     -> Description: Number of namespace add events received
     -> Unit:
     -> DataType: Sum
     -> IsMonotonic: true
     -> AggregationTemporality: Cumulative
NumberDataPoints #0
Data point attributes:
     -> service_instance_id: Str(d80d11f9-aa84-4e16-818d-3e7d868c0cfe)
     -> service_name: Str(otelcontribcol)
     -> service_version: Str(0.88.0-dev)
StartTimestamp: 1970-01-01 00:00:00 +0000 UTC
Timestamp: 2023-11-20 13:17:36.881 +0000 UTC
Value: 194151496.000000
Metric #9
Descriptor:
     -> Name: otelcol_receiver_accepted_spans
     -> Description: Number of spans successfully pushed into the pipeline.
     -> Unit:
     -> DataType: Sum
     -> IsMonotonic: true
     -> AggregationTemporality: Cumulative

