- Essentials
- Getting Started
- Datadog
- Datadog Site
- DevSecOps
- Serverless for AWS Lambda
- Agent
- Integrations
- Containers
- Dashboards
- Monitors
- Logs
- APM Tracing
- Profiler
- Tags
- API
- Service Catalog
- Session Replay
- Continuous Testing
- Synthetic Monitoring
- Incident Management
- Database Monitoring
- Cloud Security Management
- Cloud SIEM
- Application Security Management
- Workflow Automation
- CI Visibility
- Test Visibility
- Intelligent Test Runner
- Code Analysis
- Learning Center
- Support
- Glossary
- Standard Attributes
- Guides
- Agent
- Integrations
- OpenTelemetry
- Developers
- Authorization
- DogStatsD
- Custom Checks
- Integrations
- Create an Agent-based Integration
- Create an API Integration
- Create a Log Pipeline
- Integration Assets Reference
- Build a Marketplace Offering
- Create a Tile
- Create an Integration Dashboard
- Create a Recommended Monitor
- Create a Cloud SIEM Detection Rule
- OAuth for Integrations
- Install Agent Integration Developer Tool
- Service Checks
- IDE Plugins
- Community
- Guides
- API
- Datadog Mobile App
- CoScreen
- Cloudcraft
- In The App
- Dashboards
- Notebooks
- DDSQL Editor
- Sheets
- Monitors and Alerting
- Infrastructure
- Metrics
- Watchdog
- Bits AI
- Service Catalog
- API Catalog
- Error Tracking
- Service Management
- Infrastructure
- Application Performance
- APM
- Continuous Profiler
- Database Monitoring
- Data Streams Monitoring
- Data Jobs Monitoring
- Digital Experience
- Real User Monitoring
- Product Analytics
- Synthetic Testing and Monitoring
- Continuous Testing
- Software Delivery
- CI Visibility
- CD Visibility
- Test Visibility
- Intelligent Test Runner
- Code Analysis
- Quality Gates
- DORA Metrics
- Security
- Security Overview
- Cloud SIEM
- Cloud Security Management
- Application Security Management
- AI Observability
- Log Management
- Observability Pipelines
- Log Management
- Administration
OpenTelemetry Collector and Datadog Exporter
Overview
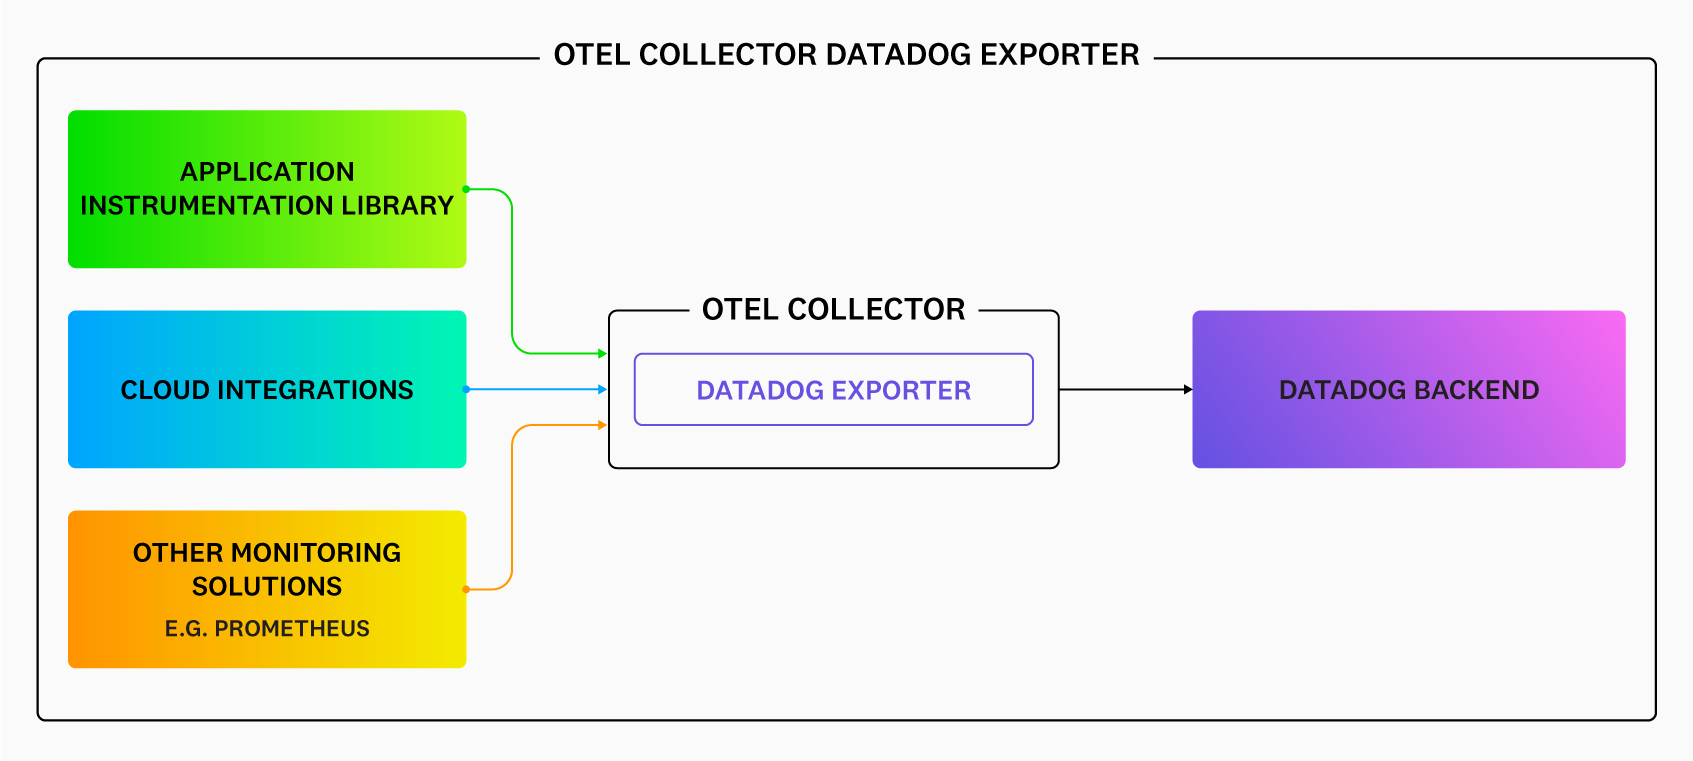
The OpenTelemetry Collector is a vendor-agnostic agent process for collecting and exporting telemetry data emitted by many processes. The Datadog Exporter for the OpenTelemetry Collector allows you to forward trace, metric, and logs data from OpenTelemetry SDKs to Datadog (without the Datadog Agent). It works with all supported languages, and you can connect OpenTelemetry trace data with application logs.
Using the Collector
The following documentation describes how to deploy and configure the Collector:
Out-of-the-box dashboards
Datadog provides out-of-the-box dashboards that you can copy and customize. To use Datadog’s out-of-the-box OpenTelemetry dashboards:
Install the OpenTelemetry integration.
Go to Dashboards > Dashboards list and search for
opentelemetry:
The Host Metrics dashboard is for data collected from the host metrics receiver. The Collector Metrics dashboard is for any other types of metrics collected, depending on which metrics receiver you choose to enable.


