- Essentials
- Getting Started
- Datadog
- Datadog Site
- DevSecOps
- Serverless for AWS Lambda
- Agent
- Integrations
- Containers
- Dashboards
- Monitors
- Logs
- APM Tracing
- Profiler
- Tags
- API
- Service Catalog
- Session Replay
- Continuous Testing
- Synthetic Monitoring
- Incident Management
- Database Monitoring
- Cloud Security Management
- Cloud SIEM
- Application Security Management
- Workflow Automation
- CI Visibility
- Test Visibility
- Intelligent Test Runner
- Code Analysis
- Learning Center
- Support
- Glossary
- Standard Attributes
- Guides
- Agent
- Integrations
- OpenTelemetry
- Developers
- Authorization
- DogStatsD
- Custom Checks
- Integrations
- Create an Agent-based Integration
- Create an API Integration
- Create a Log Pipeline
- Integration Assets Reference
- Build a Marketplace Offering
- Create a Tile
- Create an Integration Dashboard
- Create a Recommended Monitor
- Create a Cloud SIEM Detection Rule
- OAuth for Integrations
- Install Agent Integration Developer Tool
- Service Checks
- IDE Plugins
- Community
- Guides
- API
- Datadog Mobile App
- CoScreen
- Cloudcraft
- In The App
- Dashboards
- Notebooks
- DDSQL Editor
- Sheets
- Monitors and Alerting
- Infrastructure
- Metrics
- Watchdog
- Bits AI
- Service Catalog
- API Catalog
- Error Tracking
- Service Management
- Infrastructure
- Application Performance
- APM
- Continuous Profiler
- Database Monitoring
- Data Streams Monitoring
- Data Jobs Monitoring
- Digital Experience
- Real User Monitoring
- Product Analytics
- Synthetic Testing and Monitoring
- Continuous Testing
- Software Delivery
- CI Visibility
- CD Visibility
- Test Visibility
- Intelligent Test Runner
- Code Analysis
- Quality Gates
- DORA Metrics
- Security
- Security Overview
- Cloud SIEM
- Cloud Security Management
- Application Security Management
- AI Observability
- Log Management
- Observability Pipelines
- Log Management
- Administration
RUM Dashboards
Overview
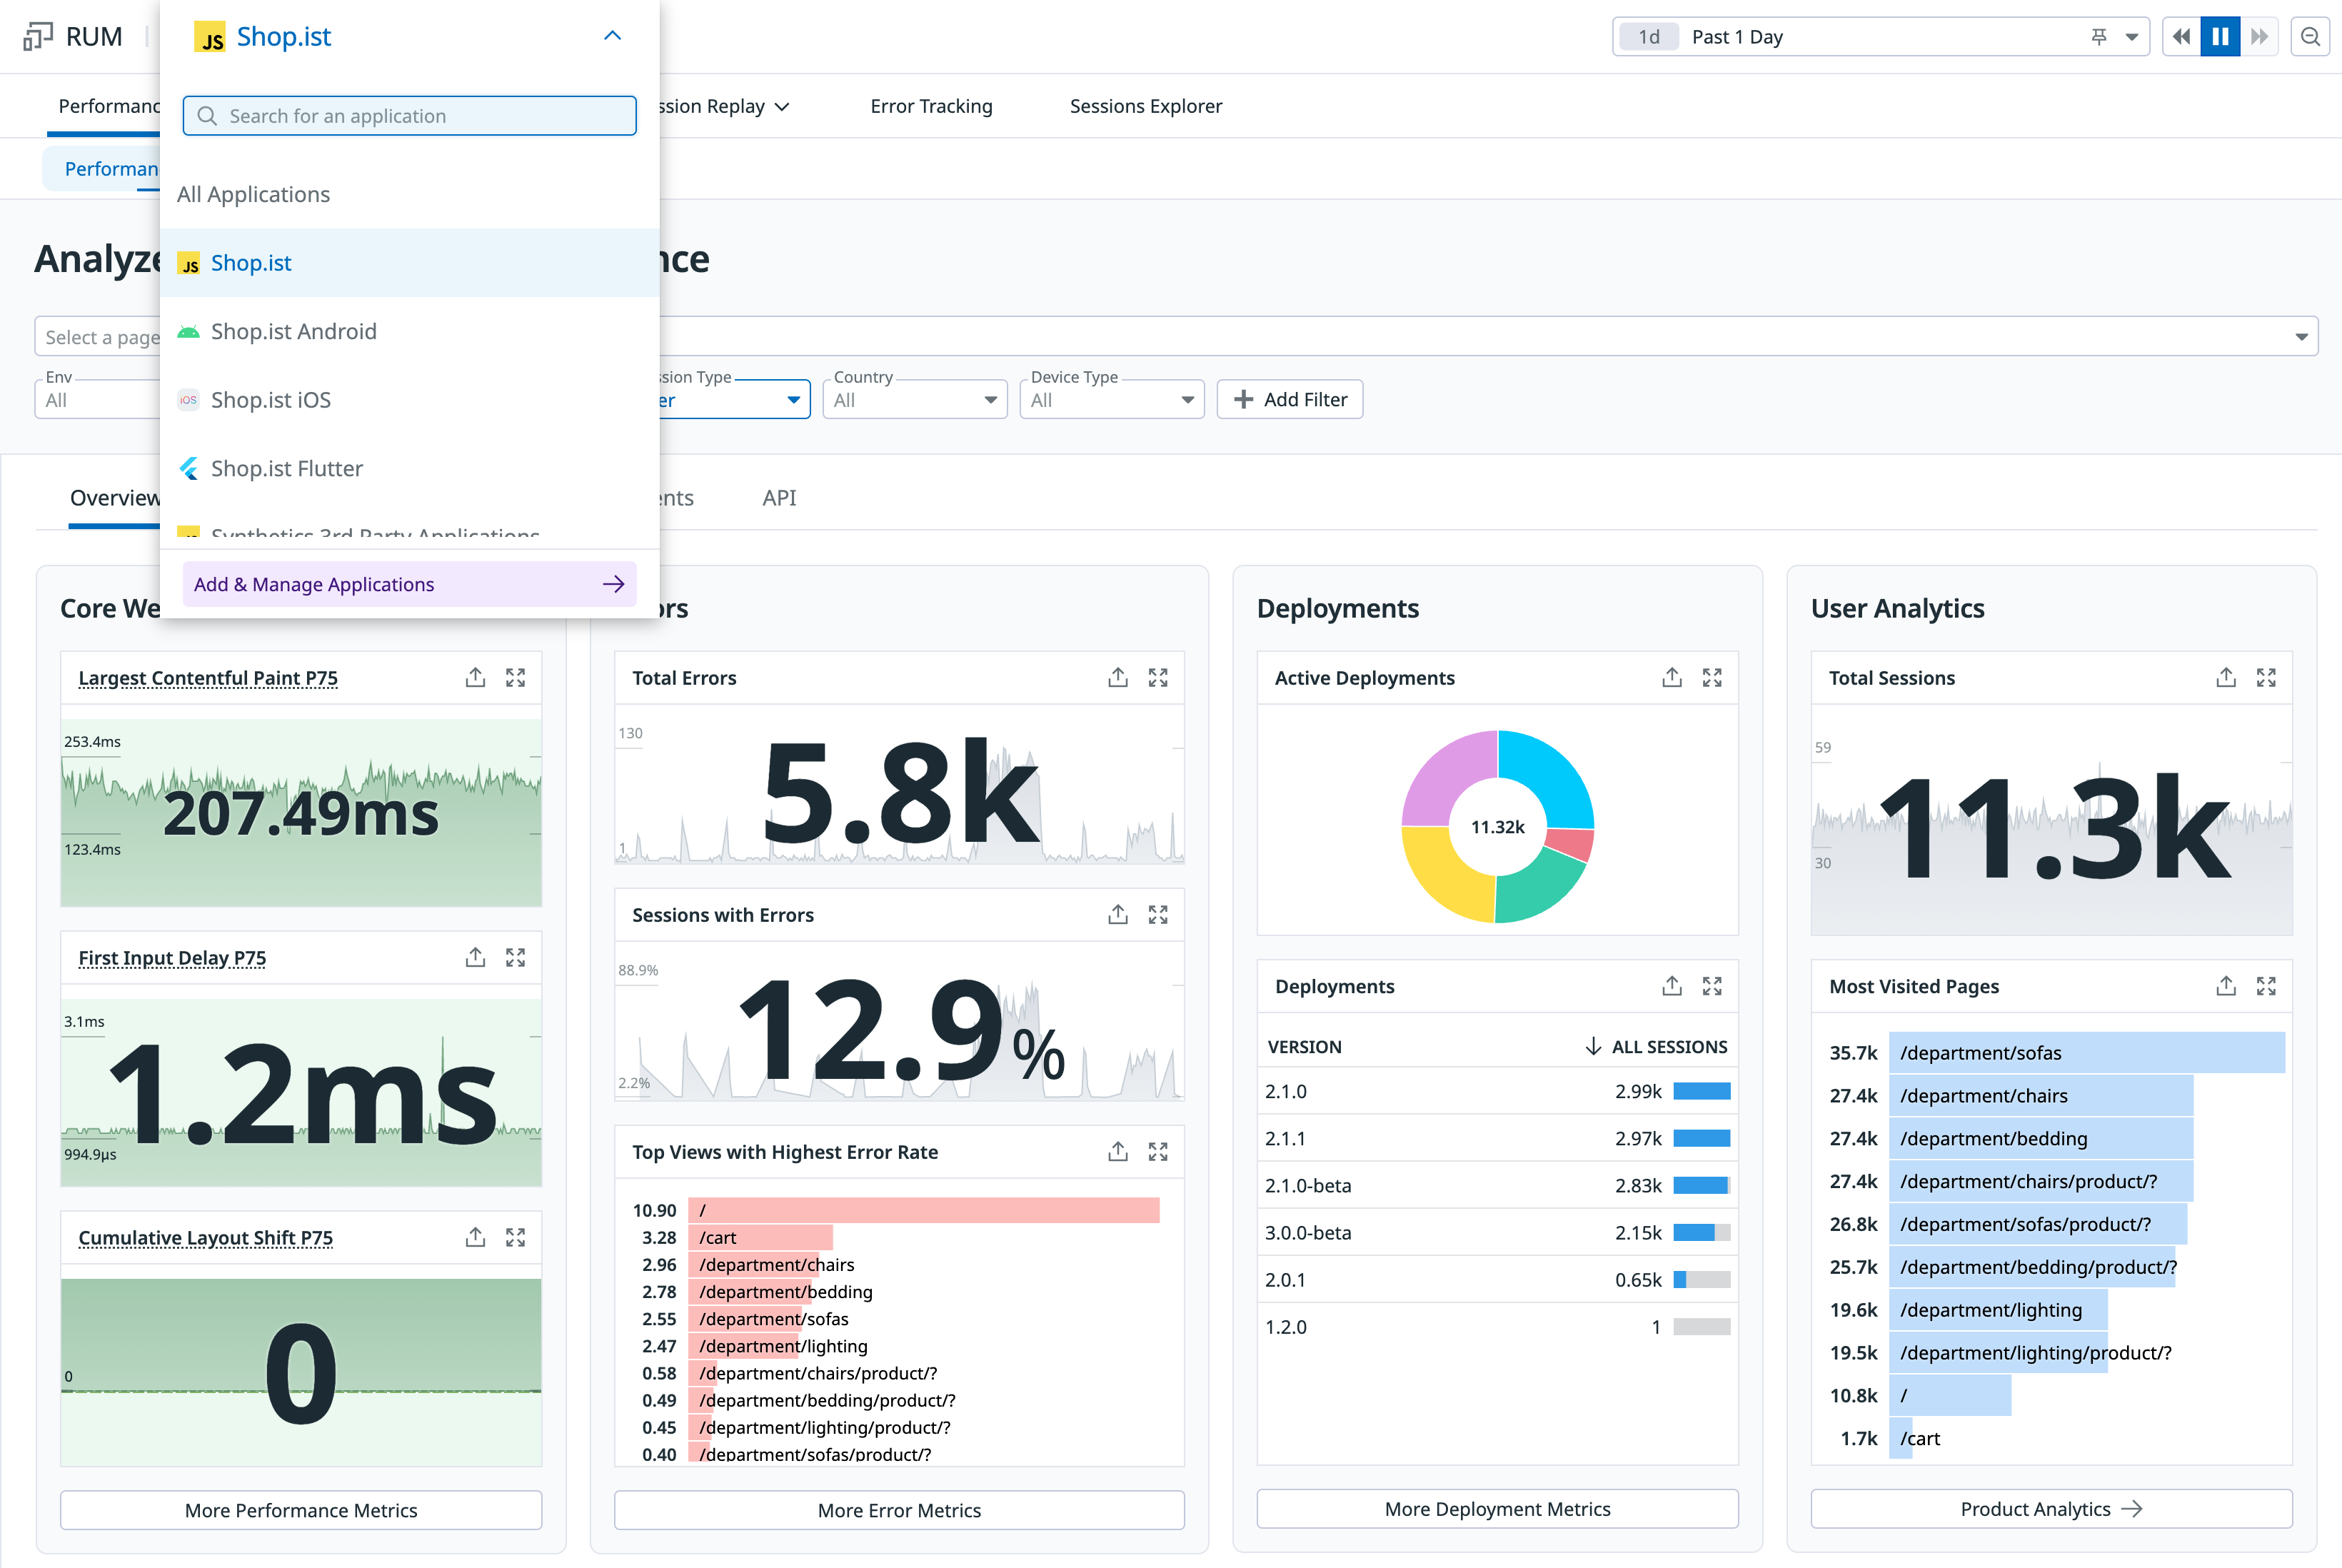
When you create a RUM application, Datadog collects data and generates dashboards about your application’s performance, errors, resources, and user sessions.
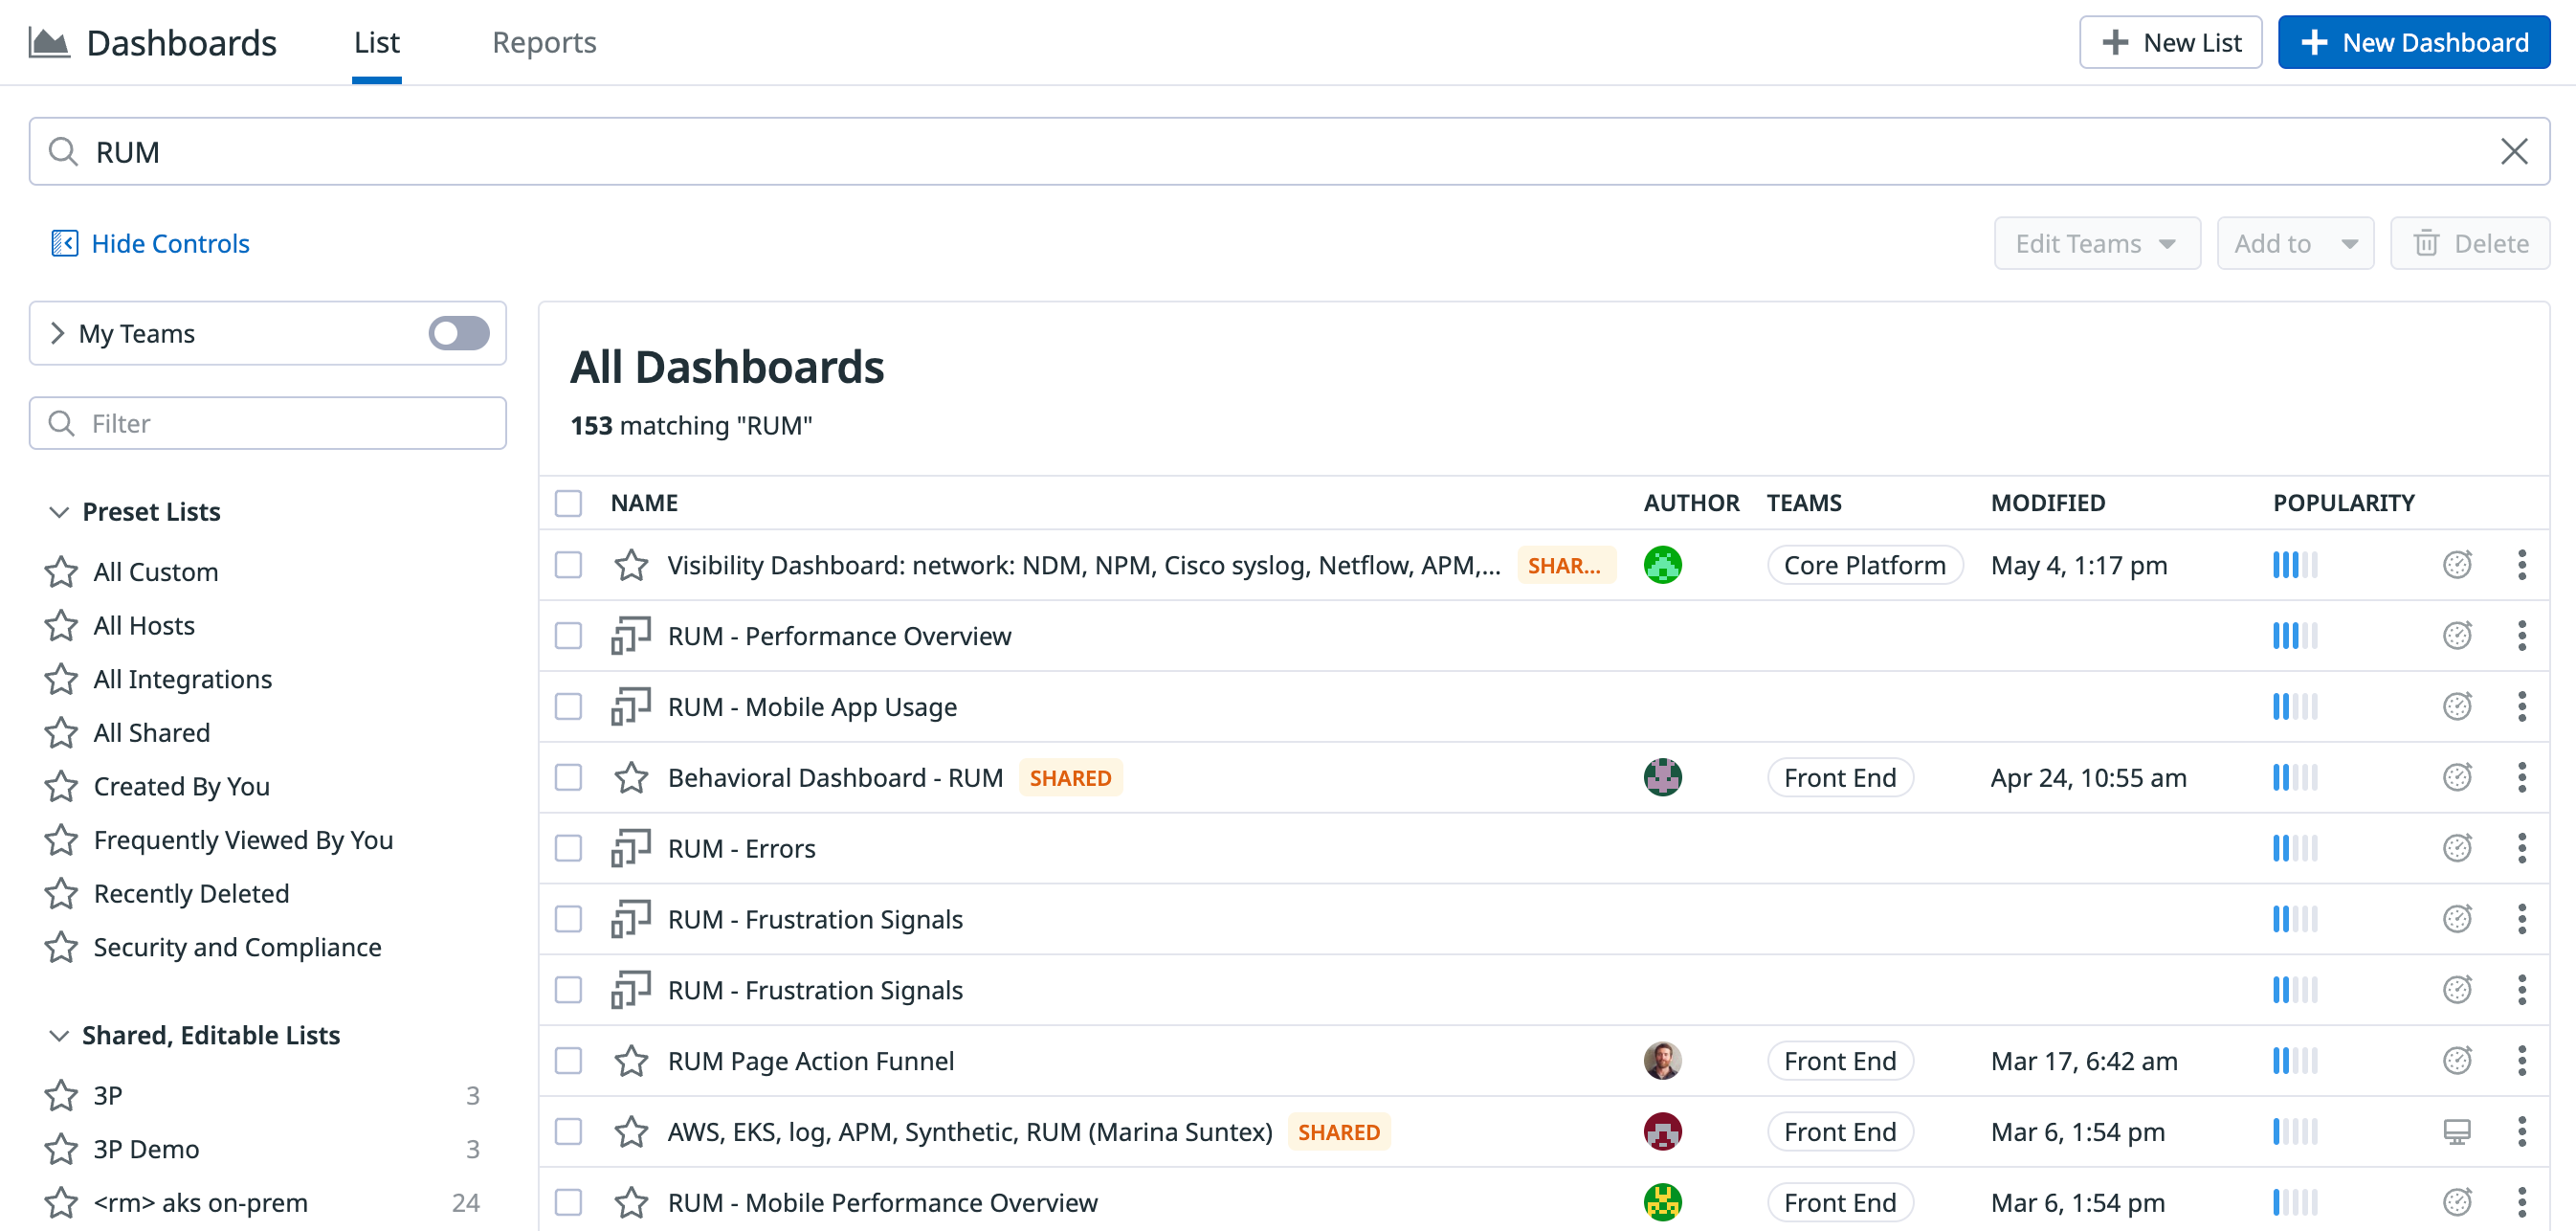
Access your RUM dashboards by filtering for RUM in the search query of the Dashboard List or from your application summary pages (Digital Experience > Performance Summary and Digital Experience > Product Analytics > Analytics Summary).
You can explore the following out-of-the-box RUM dashboards:
- Performance Overviews: See a global view of your website/app performance and demographics.
Interact with RUM dashboards
You can clone dashboards and customize them to explore your application’s data in the RUM Explorer.
Template variables
The generated RUM dashboards automatically contain a set of default template variables. Use the template variable dropdowns to select values and narrow your search. For more information, see the Template Variables documentation.
View RUM events
To explore individual events, click on a graph and click View RUM events. This redirects you to the RUM Explorer with pre-selected search filters.
Customize dashboards
To clone your RUM dashboards, click the Settings icon and select Clone dashboard. To add more widgets, powerpacks, or apps, scroll down to the bottom and click the + icon.
You can also modify the template variables and create a saved view.
Further Reading
Additional helpful documentation, links, and articles:


