- Essentials
- Getting Started
- Datadog
- Datadog Site
- DevSecOps
- Serverless for AWS Lambda
- Agent
- Integrations
- Containers
- Dashboards
- Monitors
- Logs
- APM Tracing
- Profiler
- Tags
- API
- Service Catalog
- Session Replay
- Continuous Testing
- Synthetic Monitoring
- Incident Management
- Database Monitoring
- Cloud Security Management
- Cloud SIEM
- Application Security Management
- Workflow Automation
- CI Visibility
- Test Visibility
- Intelligent Test Runner
- Code Analysis
- Learning Center
- Support
- Glossary
- Standard Attributes
- Guides
- Agent
- Integrations
- OpenTelemetry
- Developers
- Authorization
- DogStatsD
- Custom Checks
- Integrations
- Create an Agent-based Integration
- Create an API Integration
- Create a Log Pipeline
- Integration Assets Reference
- Build a Marketplace Offering
- Create a Tile
- Create an Integration Dashboard
- Create a Recommended Monitor
- Create a Cloud SIEM Detection Rule
- OAuth for Integrations
- Install Agent Integration Developer Tool
- Service Checks
- IDE Plugins
- Community
- Guides
- API
- Datadog Mobile App
- CoScreen
- Cloudcraft
- In The App
- Dashboards
- Notebooks
- DDSQL Editor
- Sheets
- Monitors and Alerting
- Infrastructure
- Metrics
- Watchdog
- Bits AI
- Service Catalog
- API Catalog
- Error Tracking
- Service Management
- Infrastructure
- Application Performance
- APM
- Continuous Profiler
- Database Monitoring
- Data Streams Monitoring
- Data Jobs Monitoring
- Digital Experience
- Real User Monitoring
- Product Analytics
- Synthetic Testing and Monitoring
- Continuous Testing
- Software Delivery
- CI Visibility
- CD Visibility
- Test Visibility
- Intelligent Test Runner
- Code Analysis
- Quality Gates
- DORA Metrics
- Security
- Security Overview
- Cloud SIEM
- Cloud Security Management
- Application Security Management
- AI Observability
- Log Management
- Observability Pipelines
- Log Management
- Administration
RUM Error Dashboards
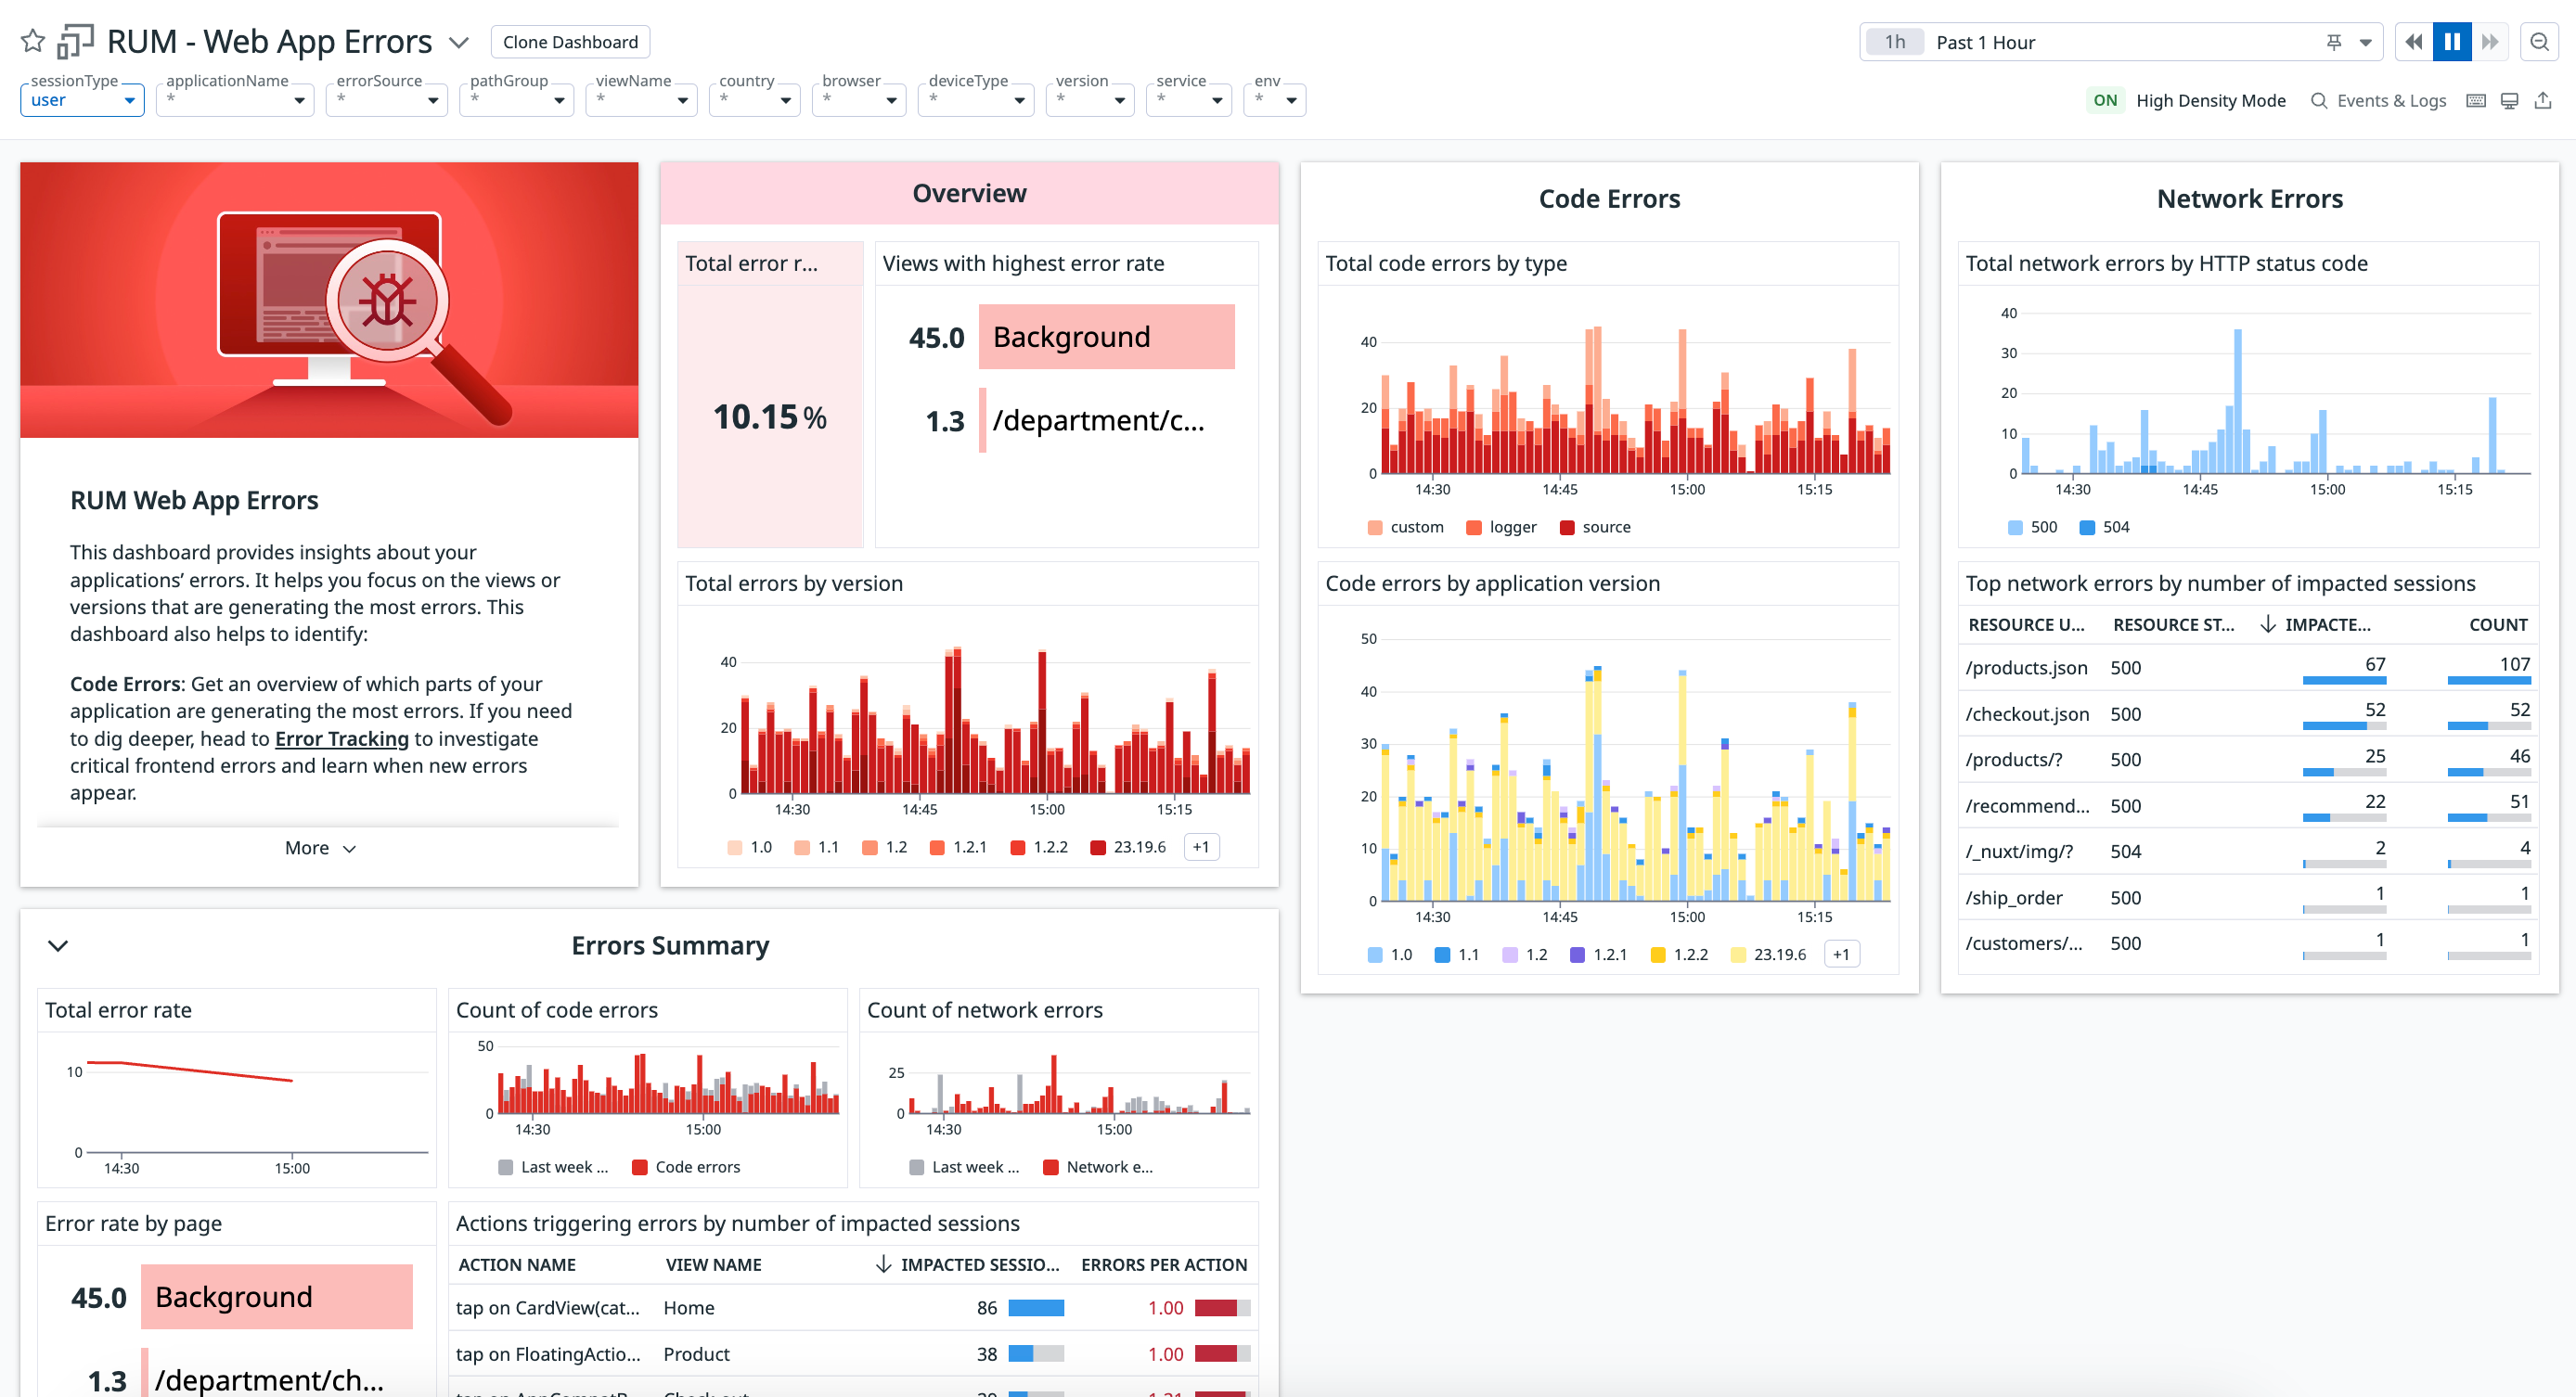
Web app errors
The RUM web app errors dashboard provides insights about your applications’ errors. It helps you focus on the views or versions that are generating the most errors. It shows:
- Code errors: Get an overview of which parts of your application are generating the most errors. If you need to dig deeper, see Error Tracking to investigate critical frontend errors and learn when new errors appear.
- Network errors: Monitor which resources are generating the most errors.
For more information about the data displayed, see RUM Browser Data Collected.
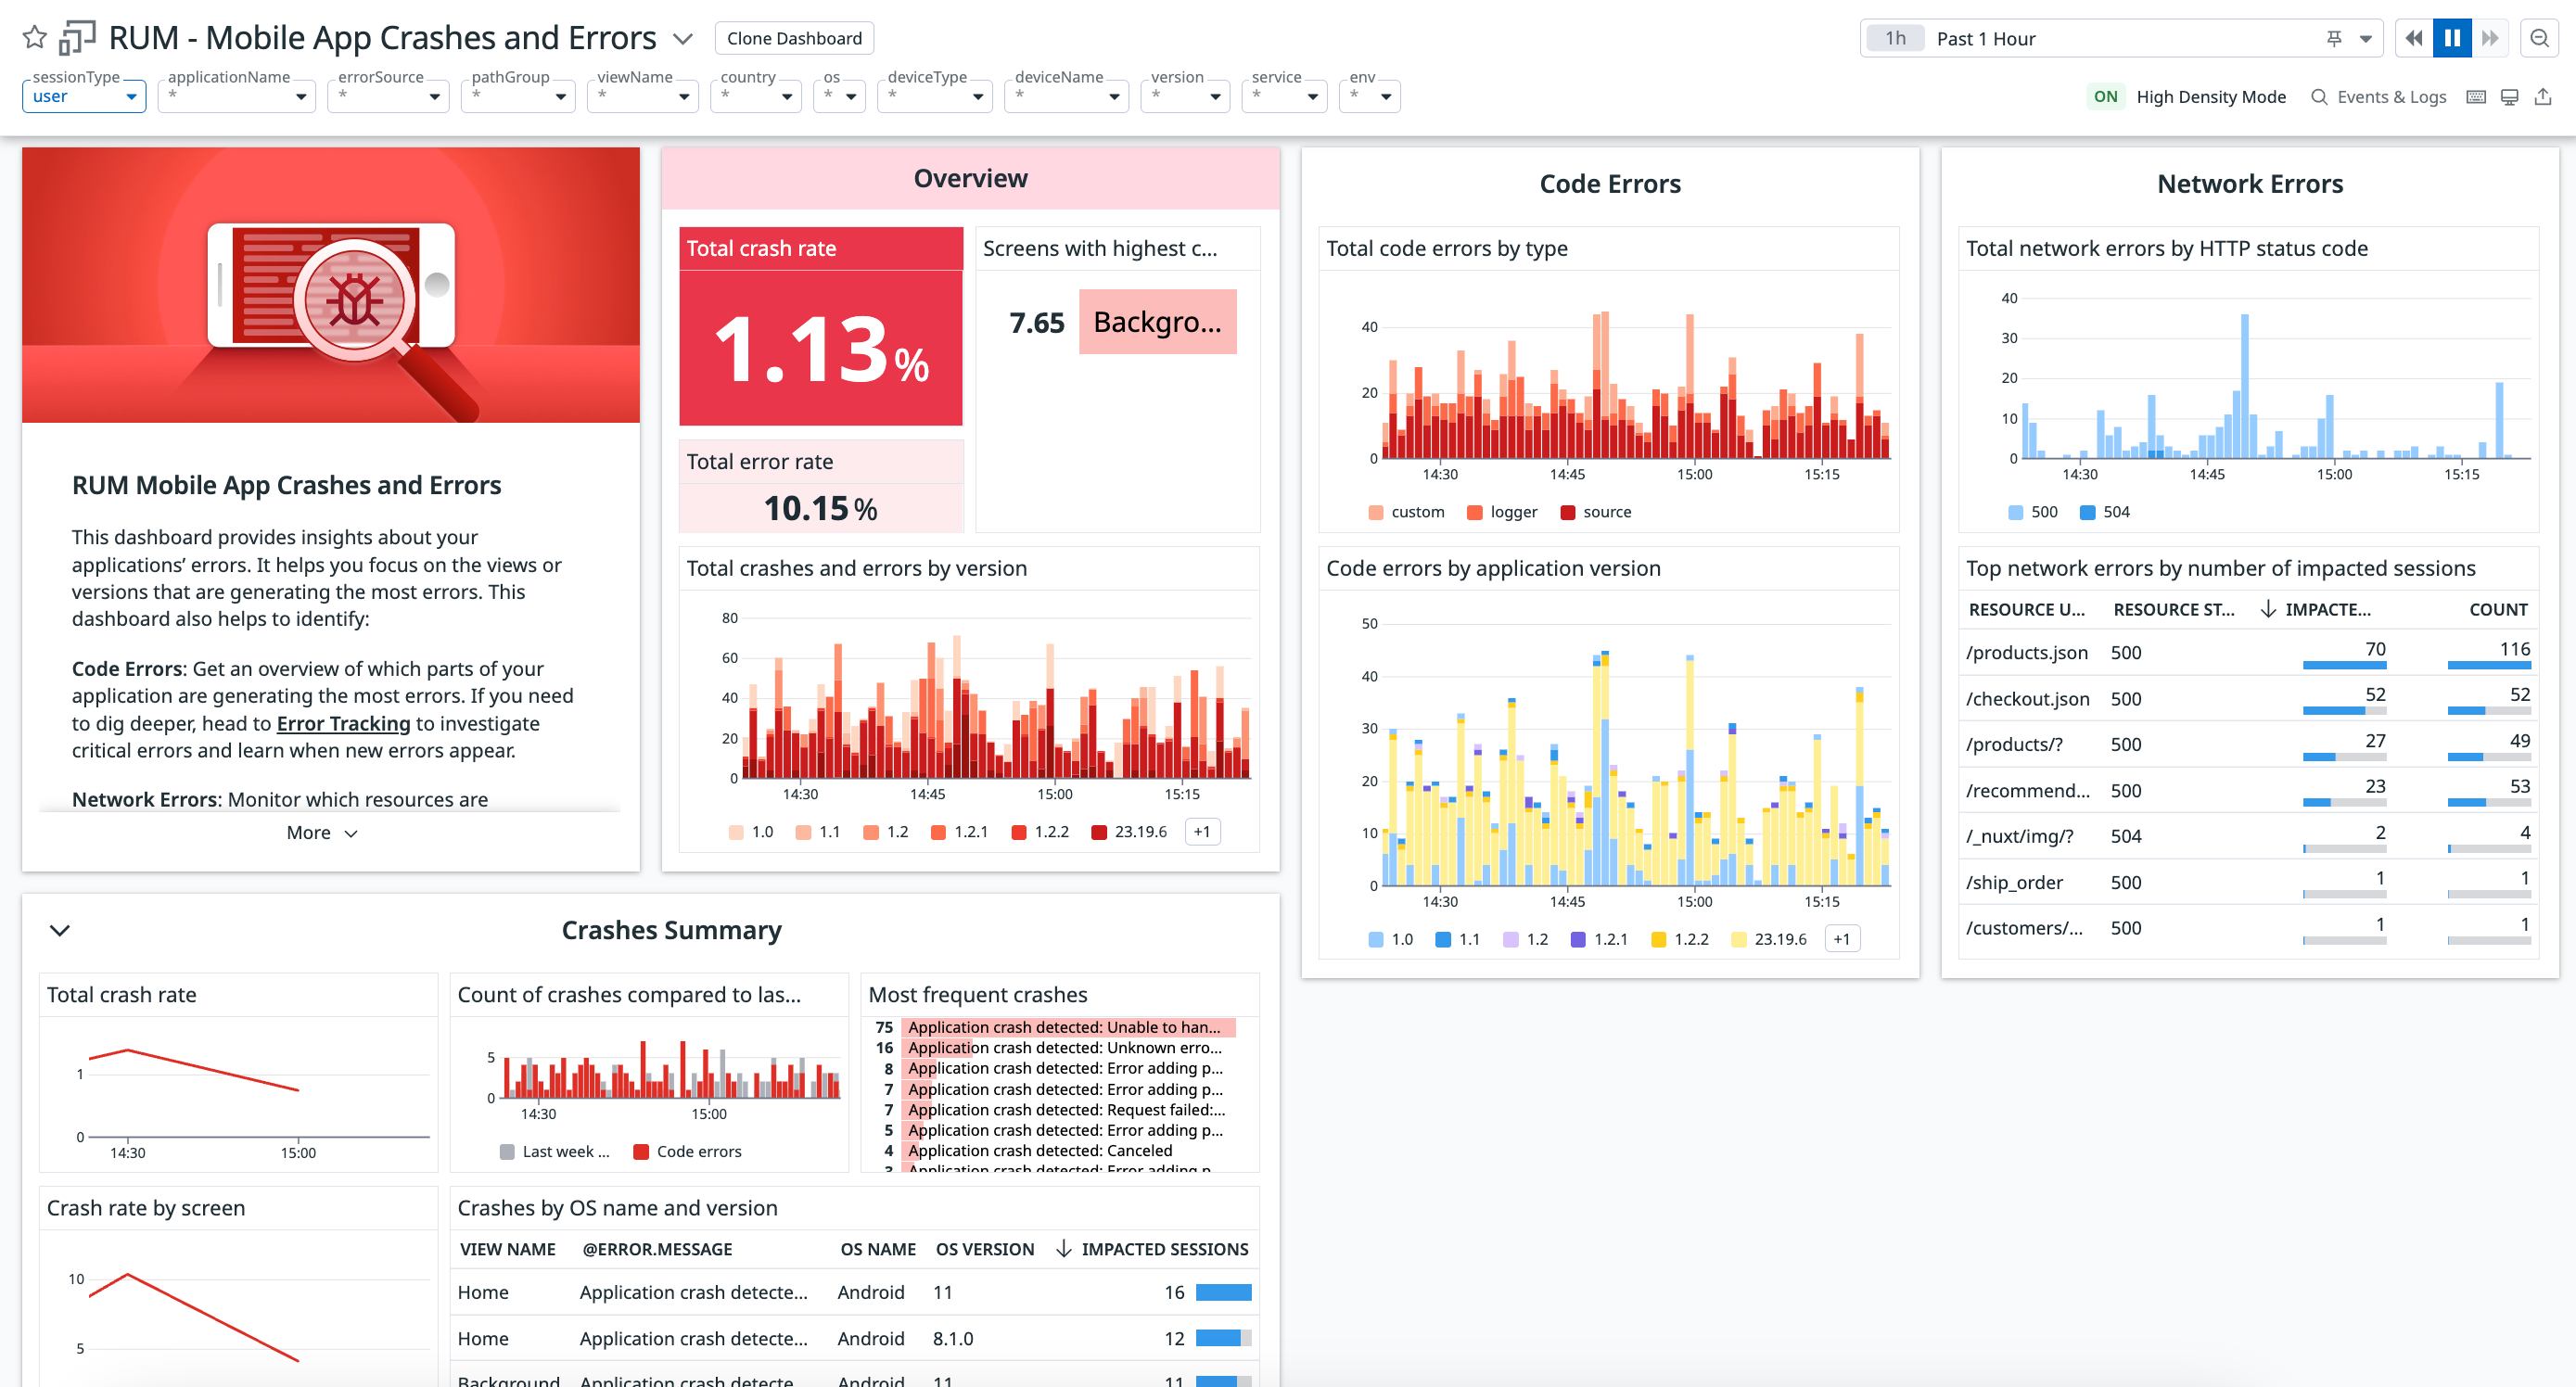
Mobile app crashes and errors
The RUM mobile app crashes and errors dashboard provides insights about your mobile applications’ errors. It helps you focus on the views or versions that are generating the most errors. It shows:
- Code errors: Get an overview of which parts of your application are generating the most errors. If you need to dig deeper, see Error Tracking to investigate critical frontend errors and learn when new errors appear.
- Network errors: Monitor which resources are generating the most errors.
For more information about the data displayed, see our documentation for each platform: iOS RUM, Android RUM, React Native RUM, and Flutter RUM.
Further Reading
Additional helpful documentation, links, and articles:


