- Essentials
- Getting Started
- Datadog
- Datadog Site
- DevSecOps
- Serverless for AWS Lambda
- Agent
- Integrations
- Containers
- Dashboards
- Monitors
- Logs
- APM Tracing
- Profiler
- Tags
- API
- Service Catalog
- Session Replay
- Continuous Testing
- Synthetic Monitoring
- Incident Management
- Database Monitoring
- Cloud Security Management
- Cloud SIEM
- Application Security Management
- Workflow Automation
- CI Visibility
- Test Visibility
- Intelligent Test Runner
- Code Analysis
- Learning Center
- Support
- Glossary
- Standard Attributes
- Guides
- Agent
- Integrations
- OpenTelemetry
- Developers
- Authorization
- DogStatsD
- Custom Checks
- Integrations
- Create an Agent-based Integration
- Create an API Integration
- Create a Log Pipeline
- Integration Assets Reference
- Build a Marketplace Offering
- Create a Tile
- Create an Integration Dashboard
- Create a Recommended Monitor
- Create a Cloud SIEM Detection Rule
- OAuth for Integrations
- Install Agent Integration Developer Tool
- Service Checks
- IDE Plugins
- Community
- Guides
- API
- Datadog Mobile App
- CoScreen
- Cloudcraft
- In The App
- Dashboards
- Notebooks
- DDSQL Editor
- Sheets
- Monitors and Alerting
- Infrastructure
- Metrics
- Watchdog
- Bits AI
- Service Catalog
- API Catalog
- Error Tracking
- Service Management
- Infrastructure
- Application Performance
- APM
- Continuous Profiler
- Database Monitoring
- Data Streams Monitoring
- Data Jobs Monitoring
- Digital Experience
- Real User Monitoring
- Product Analytics
- Synthetic Testing and Monitoring
- Continuous Testing
- Software Delivery
- CI Visibility
- CD Visibility
- Test Visibility
- Intelligent Test Runner
- Code Analysis
- Quality Gates
- DORA Metrics
- Security
- Security Overview
- Cloud SIEM
- Cloud Security Management
- Application Security Management
- AI Observability
- Log Management
- Observability Pipelines
- Log Management
- Administration
Investigate Security Signals
Overview
A Cloud SIEM security signal is created when Datadog detects a threat while analyzing logs against detection rules. View, search, filter, and correlate security signals in the Signals Explorer without needing to learn a dedicated query language. You can also assign security signals to yourself or another user in the Datadog platform. In addition to the Signals Explorer, you can configure Notification Rules to send signals to specific individuals or teams to keep them informed of issues.
You must have the Security Signals Write permission to modify a security signal, such as change the state and view signal action history in Audit Trail. See Role Based Access Control for more information about Datadog’s default roles and granular role-based access control permissions available for Datadog Security in the Cloud Security.
Signals explorer
In the Signals Explorer, use the facet panel or search bar to group and filter your signals. For example, you can view signals by their severity, detection rules, and MITRE ATT&CK. After you have filtered your signals to your use case, create a saved view so that you can reload your query later.
View signals by severity
To view all signals with specific severities, for example HIGH and CRITICAL, that are in the open or under review triage state, do one of the following:
- In the facet panel’s Severity section, select Critical, High, and Medium. In the Signal State section, make sure only open and under_reviewed are selected.
- In the search bar, enter
status:(high OR critical OR medium) @workflow.triage.state:(open OR under_review).
To add the column Signal State, select the Options button in the top right corner above the table and add the facet: @workflow.triage.state. This displays the signal status and allows you to sort by status through the header.
Use different visualizations to investigate the threat activity in your environment. For example, in the Visualize by field, you can group signals by:
- Rules List to see the volume and alerting trends across the different detection rules.
- Timeseries to view signal trends over time.
- Top List to see signals with the highest to lowest number of occurrences.
- Table to see signals by the specified tag key (for example,
source,technique, and so on). - Pie Chart to see the relative volume of each of the detection rules.
View signals by detection rules
To view your signals based on detections rules, click Rules List in the Visualize as field under the search bar. Click on a rule to see the signals related to that rule. Click on a signal to see the signal details.
View signals by MITRE ATT&CK
To view your signals by MITRE ATT&CK Tactic and Technique:
- Select Table in the Visualize as field under the search bar, and group by Tactic.
- Click the plus icon next to the first group
byto add a second groupby, and select Technique for it. - In the table, click one of the tactics or techniques to see options to further investigate and filter the signals. For example, you can view signals related to the tactic and technique and search for or exclude specific tactics and techniques.
Triage a single signal
- Navigate to Cloud SIEM.
- Click the Signals tab at the top of the page.
- Click on a security signal from the table.
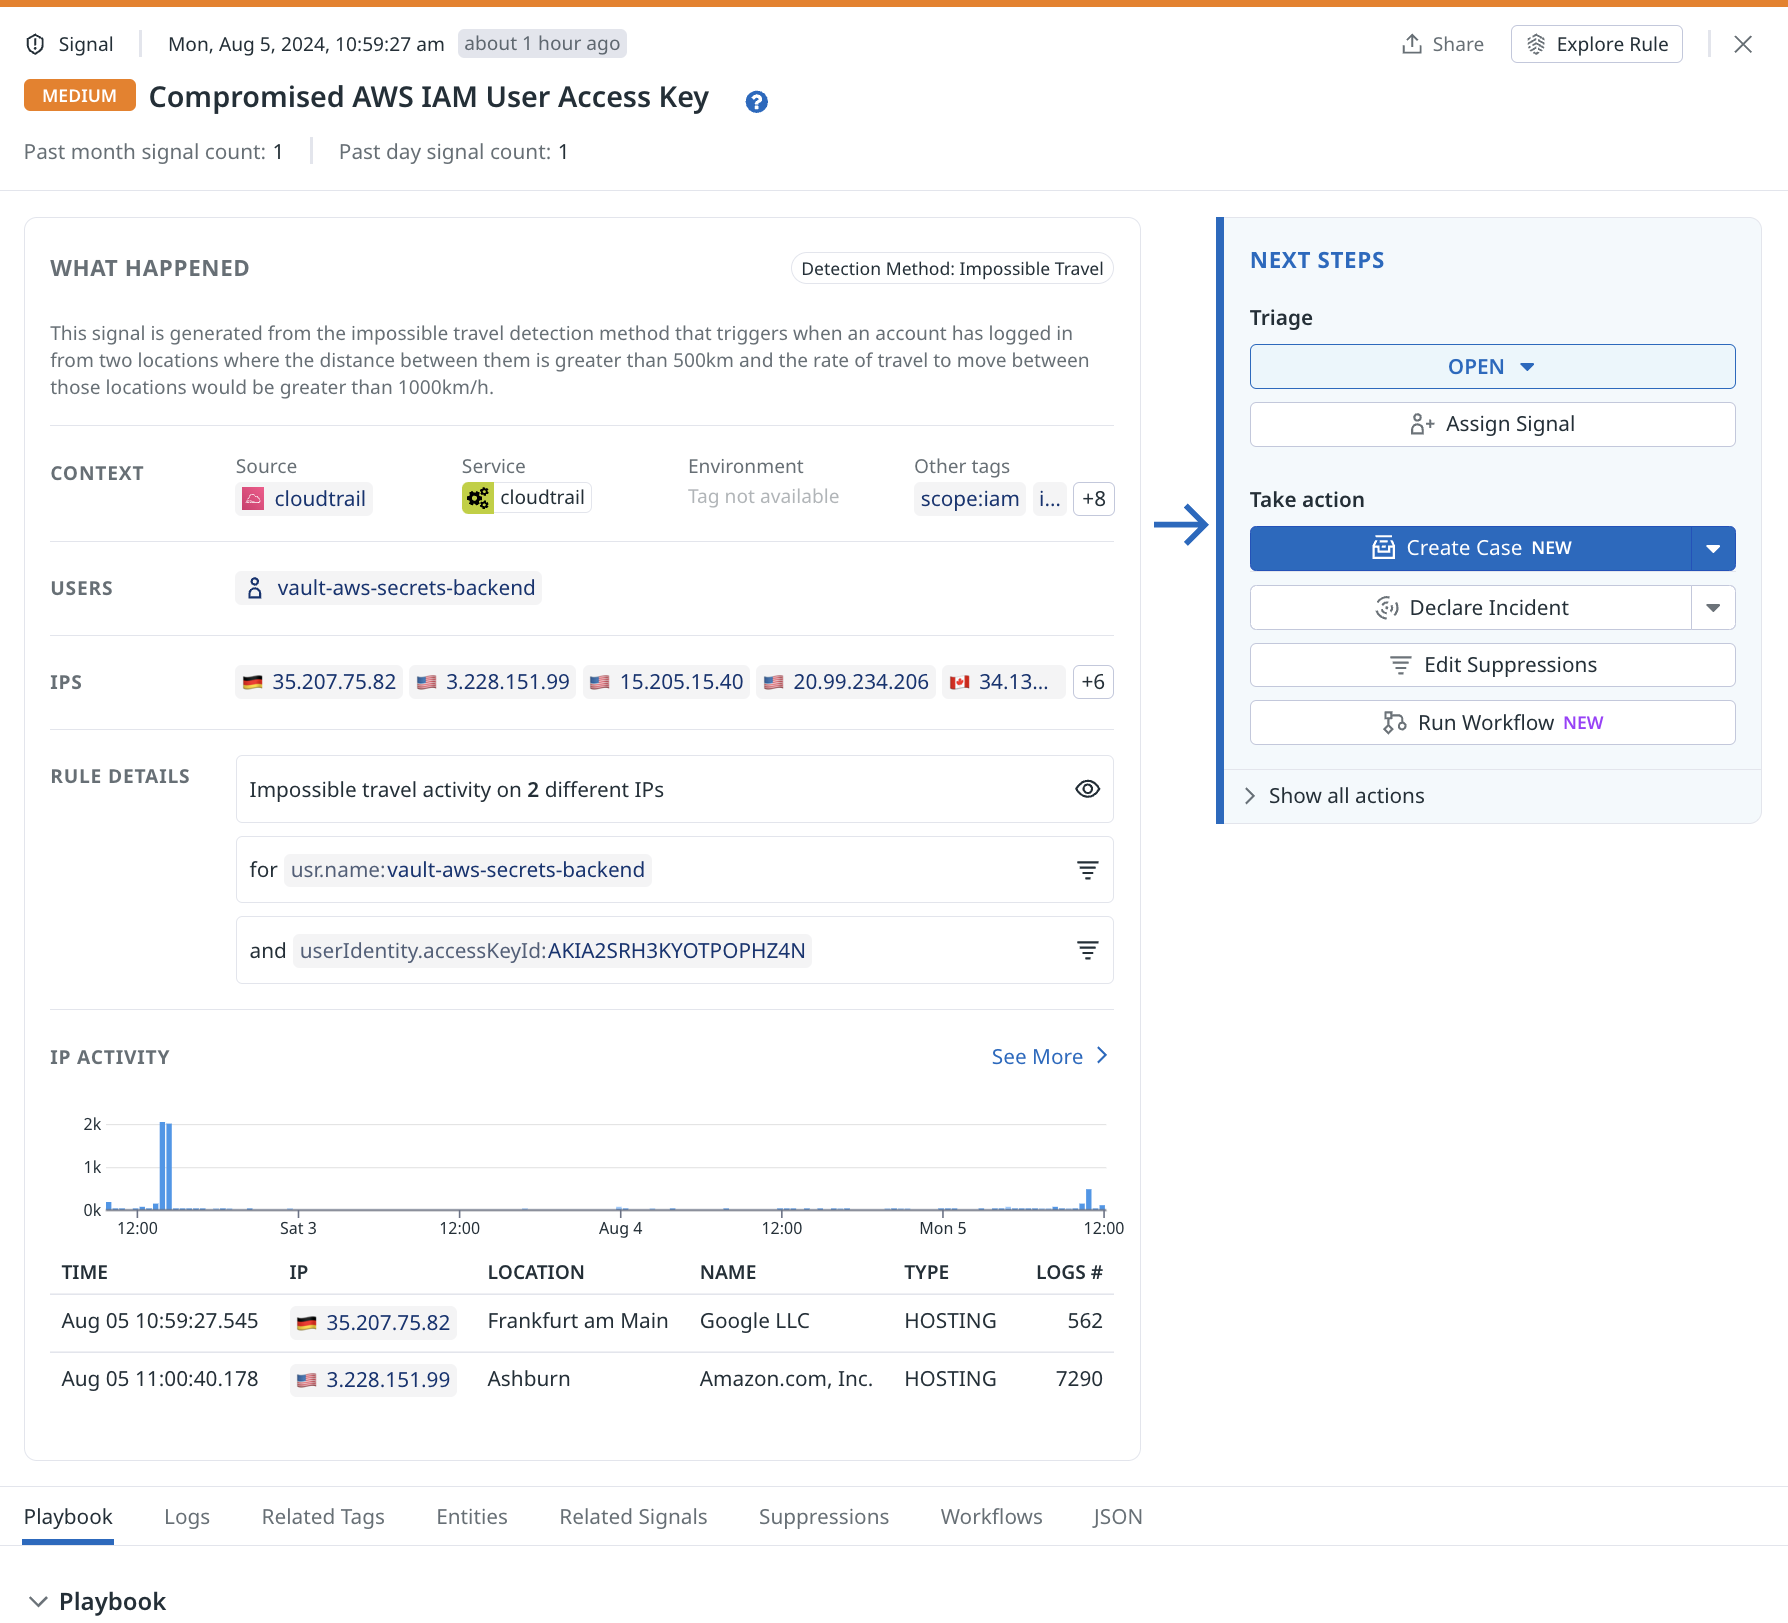
- In the What Happened section, see the logs that matched the query. Hover over the query to see the query details.
- You can also see specific information like username or network IP. In Rule Details, click the funnel icon to create a suppression rule or add the information to an existing suppression. See Create suppression rule for more details.
- In the Next Steps section:
a. Under Triage, click the dropdown to change the triage status of the signal. The default status isOPEN.Open: Datadog Security triggered a detection based on a rule, and the resulting signal is not yet resolved.Under Review: During an active investigation, change the triage status toUnder Review. From theUnder Reviewstate, you can move the status toArchivedorOpenas needed.Archived: When the detection that caused the signal has been resolved, update the status toArchived. When a signal is archived, you can give a reason and description for future reference. If an archived issue resurfaces, or if further investigation is necessary, the status can be changed back toOpen. All signals are locked 30 days after they have been created.
c. Under Take Action, you can create a case, declare an incident, edit suppressions, or run workflows. Creating a case automatically assigns the signal to you and sets the triage status toUnder Review.
Triage multiple signals
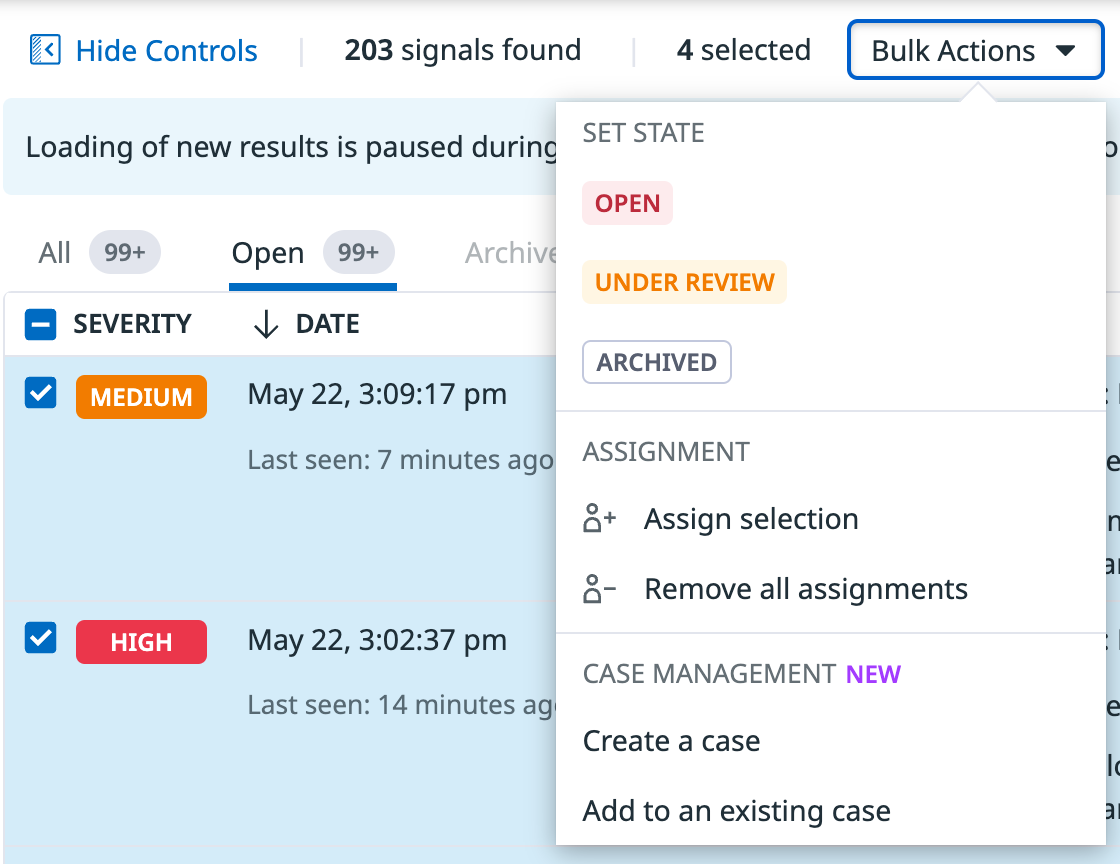
Use bulk actions to triage multiple signals. To use bulk actions, first search and filter your signals in the Signals Explorer, then:
- Click on the checkbox to the left of the signals that you want to take a bulk action on. To select all signals in the Signals Explorer list, select the checkbox next to the Status column header.
- Click on the Bulk Actions dropdown menu above the signals table and select the action you want to take.
Note: The Signals Explorer stops dynamically updating when performing a bulk action.
Run Workflow Automation
Use Workflow Automation to carry out actions to help you investigate and remediate a signal. These actions can include:
- Blocking an IP address from your environment.
- Disabling a user account.
- Looking up an IP address with a third-party threat intelligence provider.
- Sending Slack messages to your colleagues to get help with your investigation.
To run a workflow from the signal side panel, select Run Workflows in the Next Steps section. In the workflow browser, search and select a workflow to run. Click the Workflows tab in the signal side panel to see which workflows were triggered for the signal.
To trigger a workflow automatically for any security signal, see Trigger a Workflow from a Security Signal and Automate Security Workflows with Workflow Automation for more information.
Investigate
A signal contains important information to determine whether the threat detected is malicious or not. Additionally, you can add a signal to a case in Case Management for further investigation.
Logs
Click the Logs tab to view the logs related to the signal. Click View All Related Logs to see the related logs in Log Explorer.
Entities
To investigate entities:
- Click the Entities tab to see entities related to the signal, such as users or IP addresses.
- Click the down arrow next to View Related Logs and:
- Select View IP Dashboard to see more information about the IP address in the IP Investigation dashboard.
- Select View Related Signals to open Signals Explorer and see the other signals associated with the IP address.
- For cloud environment entities, such as an assumed role or IAM user, view the activity graph to see what other actions the user took. Click View in Investigator to go to the Investigator to see more details.
Related signals
Click the Related Signals tab to see the related signals and information, such as fields and attributes, that the signals share. Click View All Related Activity to see the signals in the Signals Explorer.
Suppressions
To view the suppression rules for the detection rule that generated the signal, do one of the following:
- In the What Happened section, hover your mouse over the funnel icon, then click Add Suppression.
- In the Next Steps section, click Edit Suppressions to see the suppression section of that rule in the detection rule editor.
- Click the Suppressions tab to see a list of suppressions, if there are any. Click Edit Suppressions to go to the detection rule editor to see the suppression section of that rule.
Collaborate
Case Management
Sometimes you need more information than what is available in a single signal to investigate the signal. Use Case Management to collect multiple signals, create timelines, discuss with colleagues, and keep a notebook of the analysis and findings.
To create a case from a security signal:
- Click Create Case in the Next Steps section to create a new case. If you want to add the signal to an existing case, click the down arrow next to Create Case, then select Add to an existing case.
- Fill in the information for the case.
- Click Create Case.
The signal is automatically assigned to the user who created the case and the triage status is also changed to Under Review.
After a case is created, hover over the Case button to see the case associated with the signal.
Note: If a case is determined to be critical after further investigation, click Declare Incident in the case to escalate it to an incident.
Declare an incident
Whether it is based on a single signal or after an investigation of a case, certain malicious activity demands a response. You can declare incidents in Datadog to bring together developers, operations, and security teams to address a critical security event. Incident Management provides a framework and workflow to help teams effectively identify and mitigate incidents.
To declare an incident in the signal panel:
- Click Declare Incident in the Next Steps section.
- Fill out the incident template.
If you want to add the signal to an incident, click the down arrow next to Declare Incident and select the incident you want to add the signal to. Click Confirm.
Threat intelligence
Datadog Cloud SIEM offers integrated threat intelligence provided by our threat intelligence partners. These feeds are constantly updated to include data about known suspicious activity (for example, IP addresses known to be used by malicious actors), so that you can quickly identify which potential threats to address.
Datadog automatically enriches all ingested logs for indicators of compromise (IOCs) from its threat intelligence feeds. If a log contains a match to a known IOC, a threat_intel attribute is appended to the log event to provide additional insights based on available intelligence.
The query to see all threat intelligence matches in the Security Signals Explorer is @threat_intel.indicators_matched:*. The following are additional attributes to query for threat intelligence:
- For
@threat_intel.results.category: attack, corp_vpn, cryptomining, malware, residential_proxy, tor, scanner - For
@threat_intel.results.intention: malicious, suspicious, benign, unknown
See the Threat Intelligence documentation for more information on threat intelligence feeds.
Search by network IP attributes
When a suspicious activity is detected from your logs, determine whether the suspicious actor has interacted with your systems by searching for its network IP. Use the following query to search by IP attributes in the Log Explorer: @network.ip.list:<IP address>. The query searches IPs anywhere within the logs, including the tags, attributes, error, and message fields.
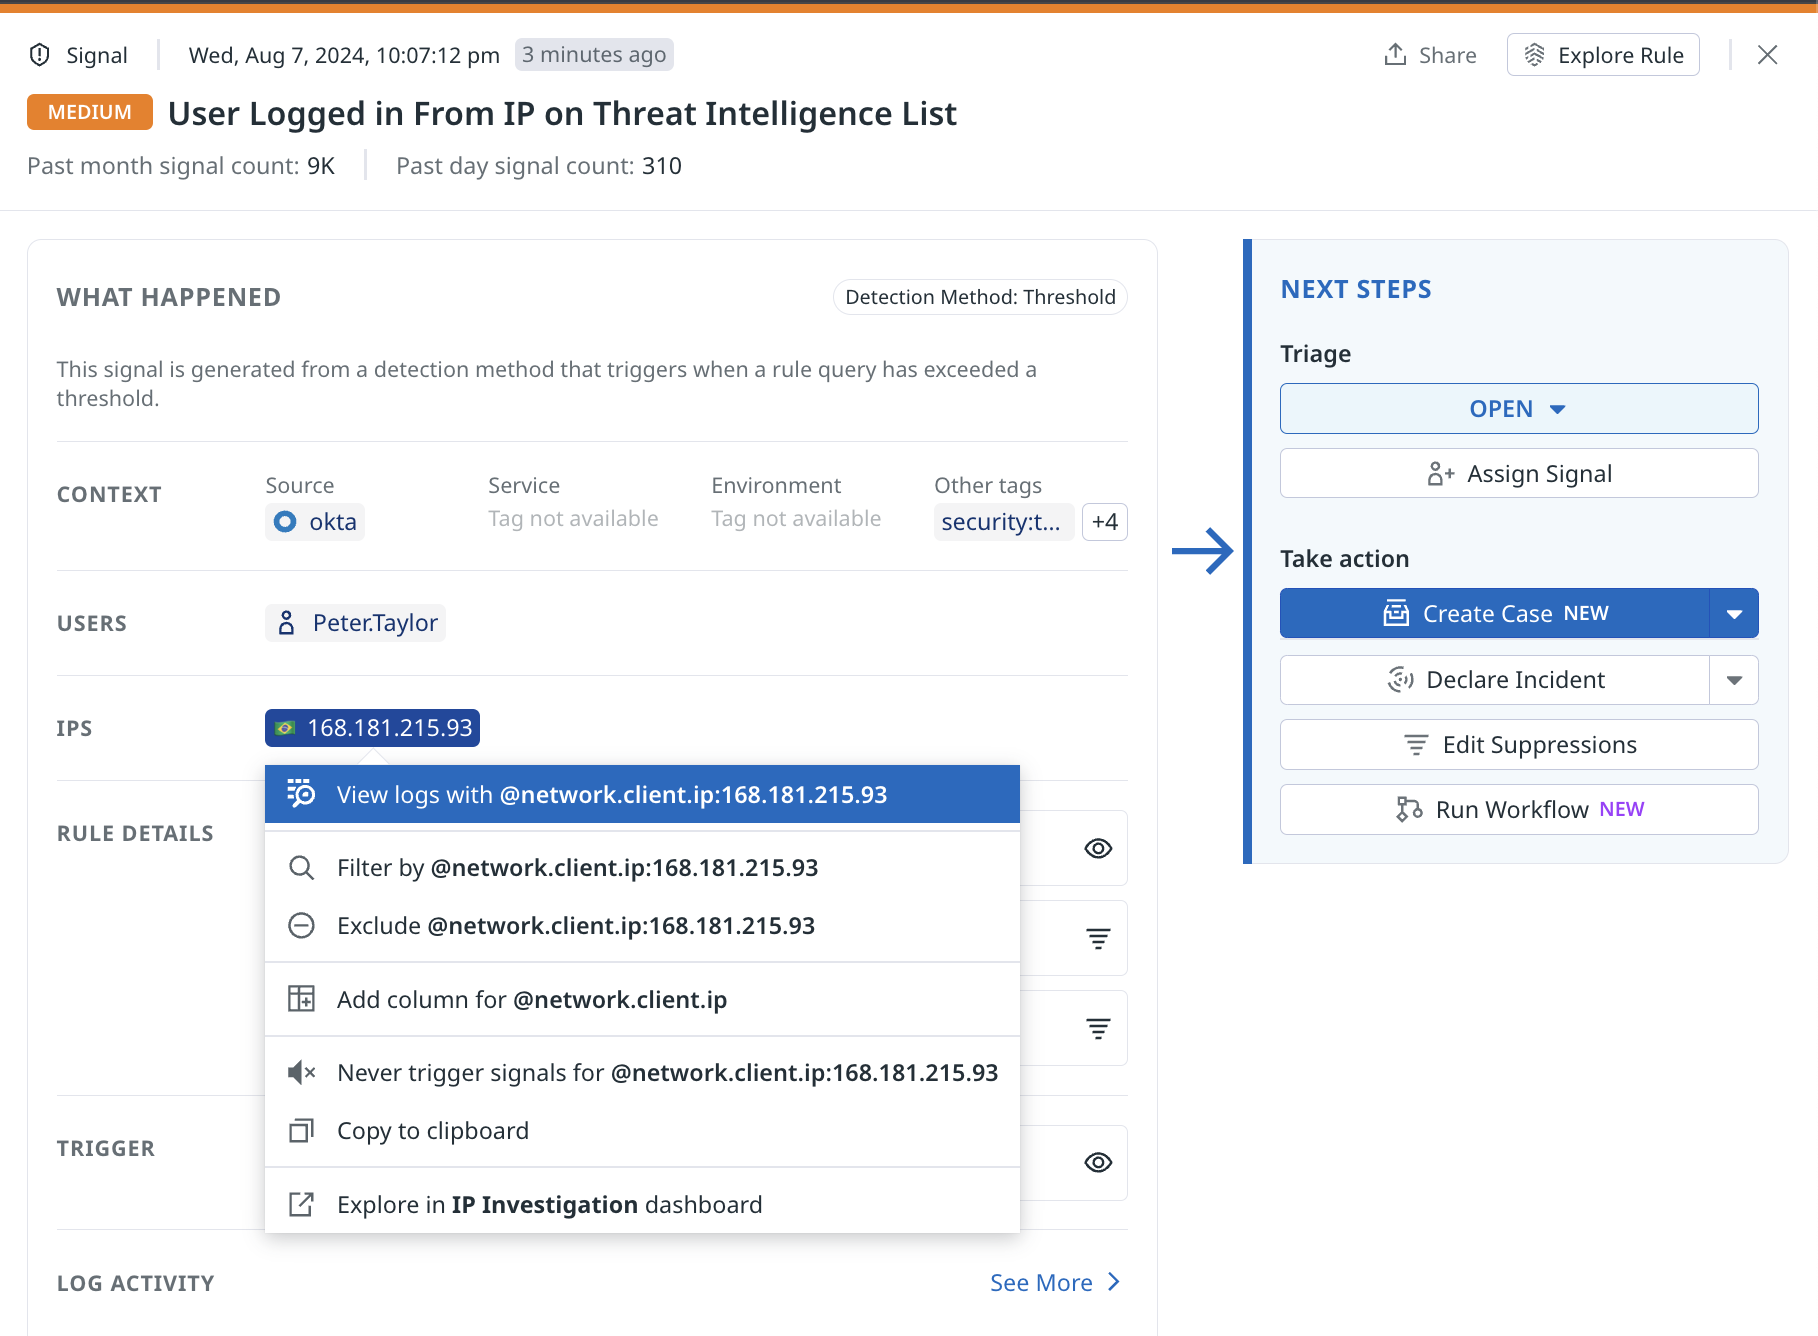
You can also launch this query directly from the signal panel:
- Click on the IP address in the IPS section.
- Select View Logs with @network.client.ip:<ip_address>.
Further reading
Additional helpful documentation, links, and articles:


