- Essentials
- Getting Started
- Datadog
- Datadog Site
- DevSecOps
- Serverless for AWS Lambda
- Agent
- Integrations
- Containers
- Dashboards
- Monitors
- Logs
- APM Tracing
- Profiler
- Tags
- API
- Service Catalog
- Session Replay
- Continuous Testing
- Synthetic Monitoring
- Incident Management
- Database Monitoring
- Cloud Security Management
- Cloud SIEM
- Application Security Management
- Workflow Automation
- CI Visibility
- Test Visibility
- Intelligent Test Runner
- Code Analysis
- Learning Center
- Support
- Glossary
- Standard Attributes
- Guides
- Agent
- Integrations
- OpenTelemetry
- Developers
- Authorization
- DogStatsD
- Custom Checks
- Integrations
- Create an Agent-based Integration
- Create an API Integration
- Create a Log Pipeline
- Integration Assets Reference
- Build a Marketplace Offering
- Create a Tile
- Create an Integration Dashboard
- Create a Recommended Monitor
- Create a Cloud SIEM Detection Rule
- OAuth for Integrations
- Install Agent Integration Developer Tool
- Service Checks
- IDE Plugins
- Community
- Guides
- API
- Datadog Mobile App
- CoScreen
- Cloudcraft
- In The App
- Dashboards
- Notebooks
- DDSQL Editor
- Sheets
- Monitors and Alerting
- Infrastructure
- Metrics
- Watchdog
- Bits AI
- Service Catalog
- API Catalog
- Error Tracking
- Service Management
- Infrastructure
- Application Performance
- APM
- Continuous Profiler
- Database Monitoring
- Data Streams Monitoring
- Data Jobs Monitoring
- Digital Experience
- Real User Monitoring
- Product Analytics
- Synthetic Testing and Monitoring
- Continuous Testing
- Software Delivery
- CI Visibility
- CD Visibility
- Test Visibility
- Intelligent Test Runner
- Code Analysis
- Quality Gates
- DORA Metrics
- Security
- Security Overview
- Cloud SIEM
- Cloud Security Management
- Application Security Management
- AI Observability
- Log Management
- Observability Pipelines
- Log Management
- Administration
Security Operational Metrics
Overview
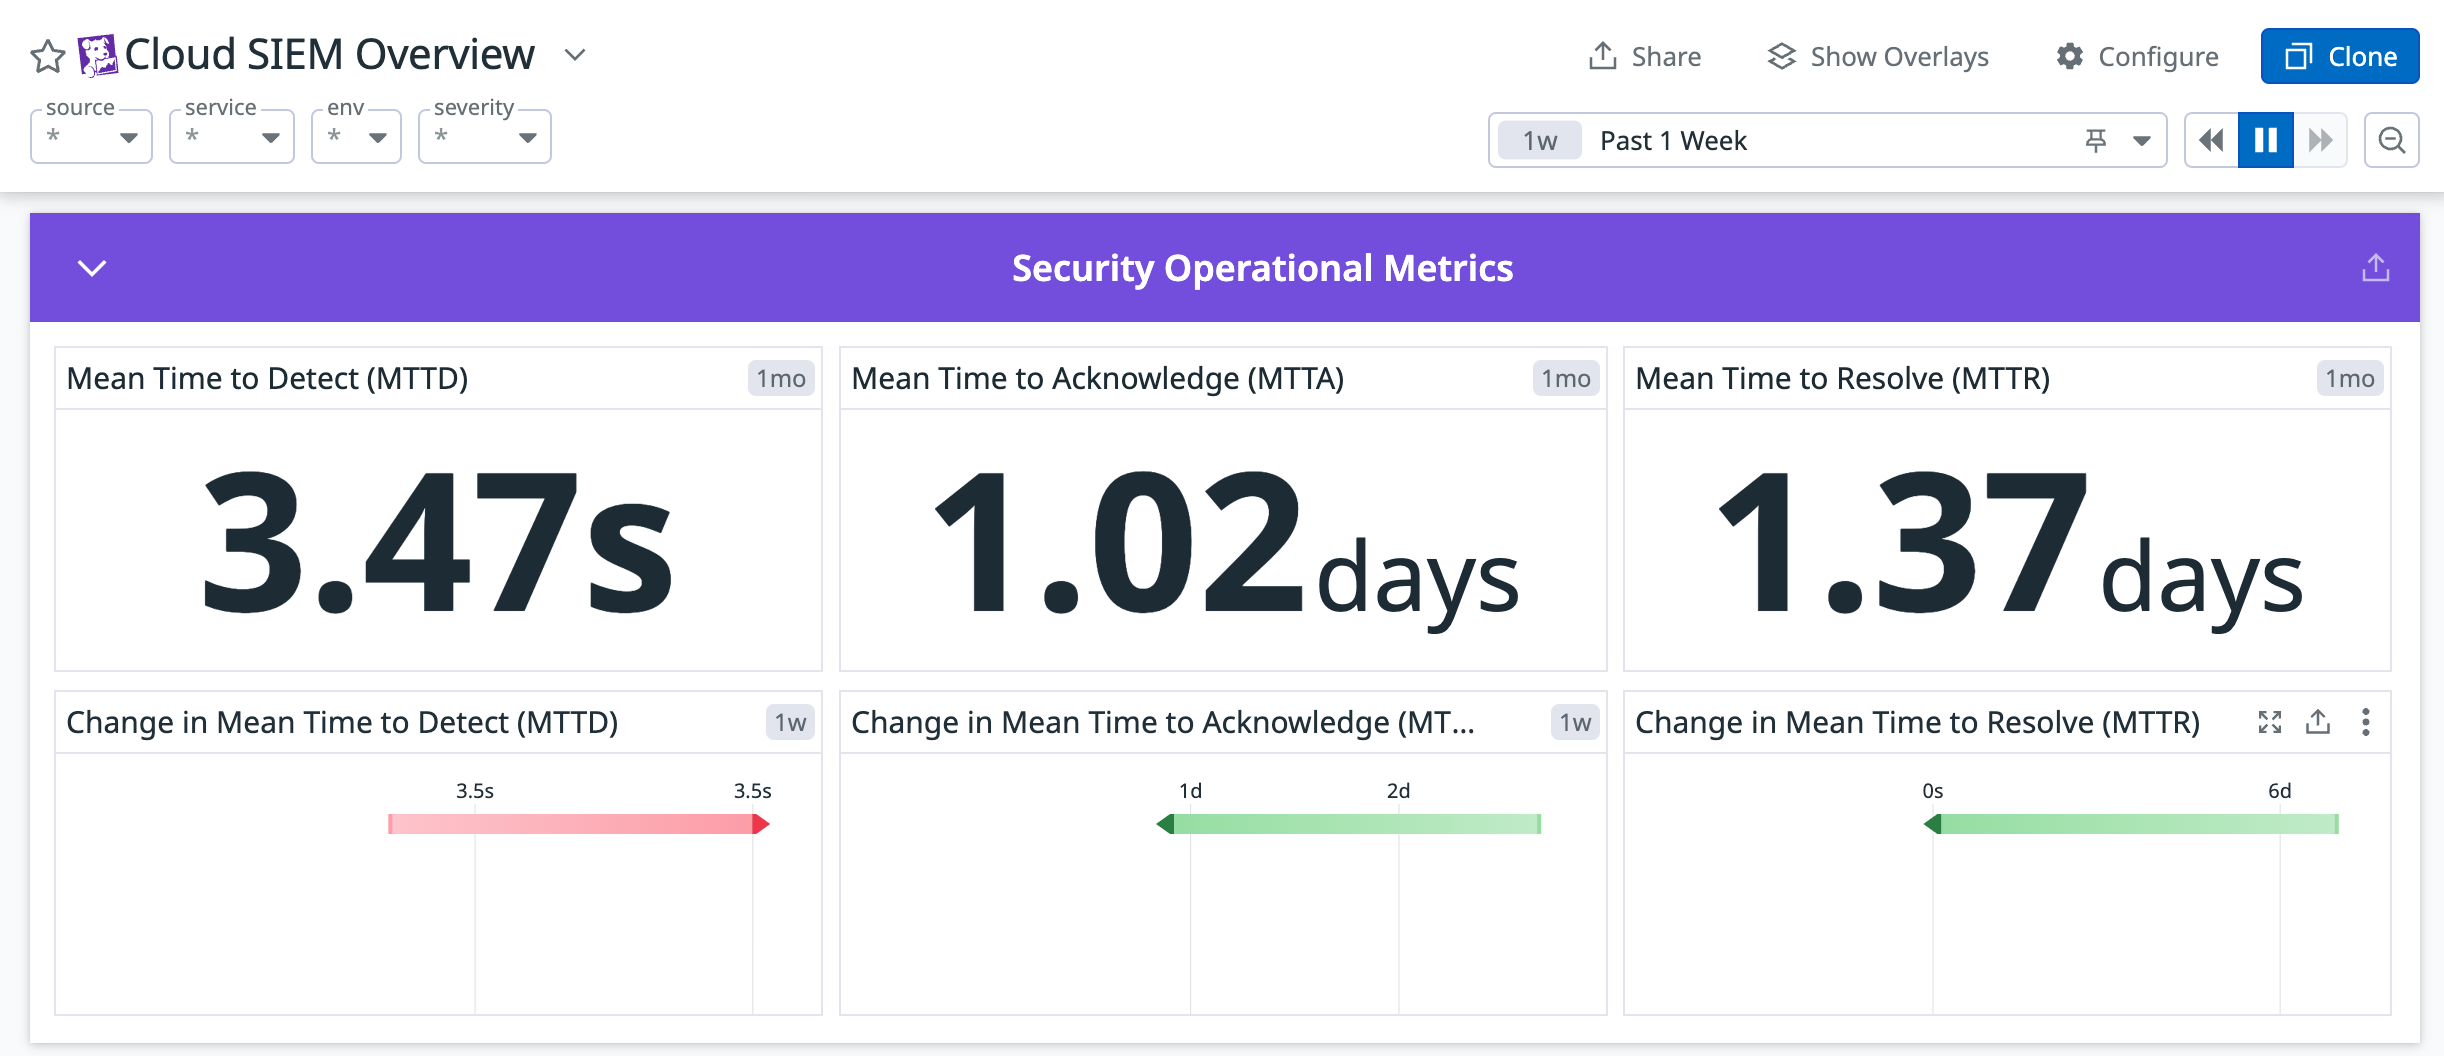
Cloud SIEM provides security operational metrics to help you determine the effectiveness of your team in responding to and resolving security threats to your cloud environments. These metrics are shown in the out-of-the-box Cloud SIEM dashboard and are sent in the Cloud SIEM weekly digest reports. You can also create dashboards and monitors for them.
Operational metrics
datadog.security.siem_signal.time_to_detect- Name: Time to Detect (TTD)
- Description: The time between when a matching log is triggered and when a signal is generated.
- Metric type: DISTRIBUTION
datadog.security.siem_signal.time_to_acknowledge- Name: Time to Acknowledge (TTA)
- Description: The time between when a signal is triggered and when an investigation on the signal begins.
- Metric type: DISTRIBUTION
datadog.security.siem_signal.time_to_resolve- Name: Time to Resolve (TTR)
- Description: The time it takes to close a signal starting from the time when you are first notified of the detection.
- Metric type: DISTRIBUTION
How the metrics are calculated
The TTD, TTA, and TTR metrics are calculated based on these timestamps:
- The timestamp (
T0) of the log that triggers a security signal. - The timestamp (
T1) of when the signal is generated. - The timestamp (
T3) of when the signal status is changed tounder_review. - The timestamp (
T4) of when the signal status is changed toarchived.
| Metric | How the metric is calculated |
|---|---|
Time to Detect (TTD)datadog.security.siem_signal.time_to_detect | T1 - T0 |
Time to Acknowledge (TTA)datadog.security.siem_signal.time_to_acknowledge | T2 - T1 |
Time to Resolve (TTR)datadog.security.siem_signal.time_to_resolve | T3 - T1 |
Explore, visualize, and monitor the metrics
Use the Metrics Summary to see metadata and tags for the operational metrics. You can also see which dashboards, notebooks, monitors, and SLOs are using those metrics.
Use tags to filter the metrics to specific teams, sources, and environments. You can then create dashboards for those metrics to visualize the data or create monitors to alert you if the metrics exceed a specified threshold.
Further reading
Additional helpful documentation, links, and articles:

