- Essentials
- Getting Started
- Datadog
- Datadog Site
- DevSecOps
- Serverless for AWS Lambda
- Agent
- Integrations
- Containers
- Dashboards
- Monitors
- Logs
- APM Tracing
- Profiler
- Tags
- API
- Service Catalog
- Session Replay
- Continuous Testing
- Synthetic Monitoring
- Incident Management
- Database Monitoring
- Cloud Security Management
- Cloud SIEM
- Application Security Management
- Workflow Automation
- CI Visibility
- Test Visibility
- Intelligent Test Runner
- Code Analysis
- Learning Center
- Support
- Glossary
- Standard Attributes
- Guides
- Agent
- Integrations
- OpenTelemetry
- Developers
- Authorization
- DogStatsD
- Custom Checks
- Integrations
- Create an Agent-based Integration
- Create an API Integration
- Create a Log Pipeline
- Integration Assets Reference
- Build a Marketplace Offering
- Create a Tile
- Create an Integration Dashboard
- Create a Recommended Monitor
- Create a Cloud SIEM Detection Rule
- OAuth for Integrations
- Install Agent Integration Developer Tool
- Service Checks
- IDE Plugins
- Community
- Guides
- API
- Datadog Mobile App
- CoScreen
- Cloudcraft
- In The App
- Dashboards
- Notebooks
- DDSQL Editor
- Sheets
- Monitors and Alerting
- Infrastructure
- Metrics
- Watchdog
- Bits AI
- Service Catalog
- API Catalog
- Error Tracking
- Service Management
- Infrastructure
- Application Performance
- APM
- Continuous Profiler
- Database Monitoring
- Data Streams Monitoring
- Data Jobs Monitoring
- Digital Experience
- Real User Monitoring
- Product Analytics
- Synthetic Testing and Monitoring
- Continuous Testing
- Software Delivery
- CI Visibility
- CD Visibility
- Test Visibility
- Intelligent Test Runner
- Code Analysis
- Quality Gates
- DORA Metrics
- Security
- Security Overview
- Cloud SIEM
- Cloud Security Management
- Application Security Management
- AI Observability
- Log Management
- Observability Pipelines
- Log Management
- Administration
Suspect Commits
Overview
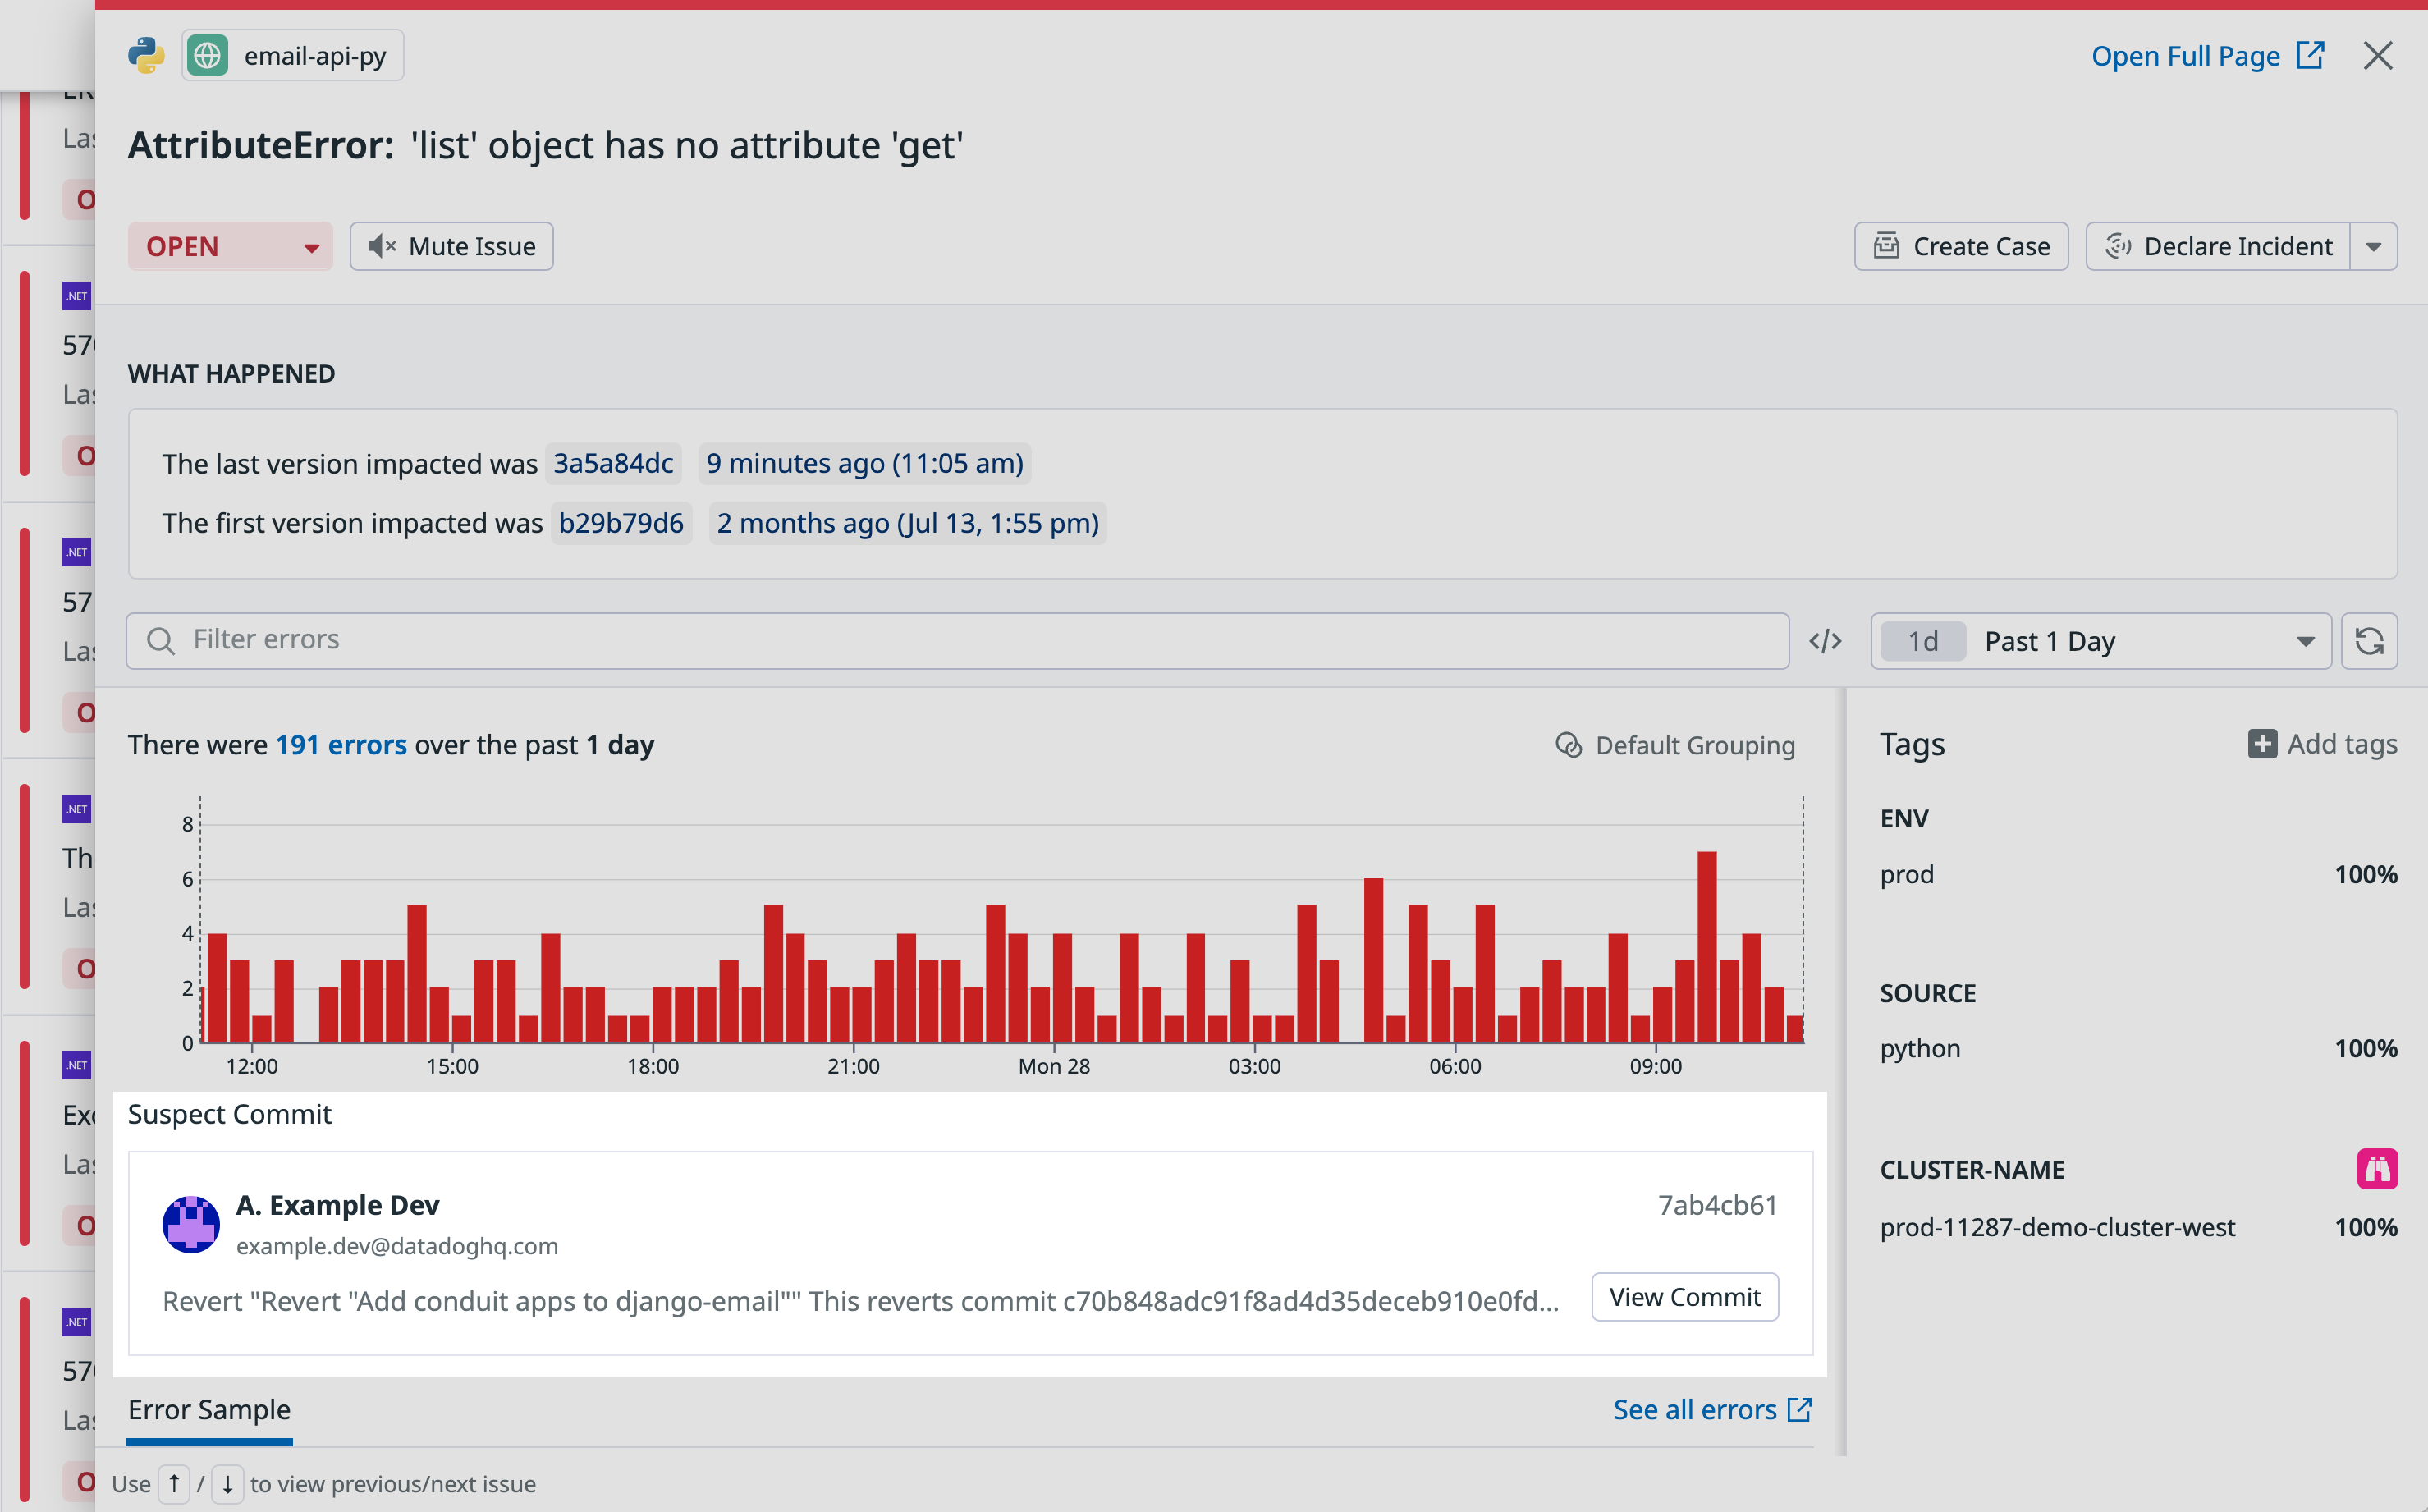
Error Tracking can identify suspect commits, helping you pinpoint the root cause of your errors and expedite resolution. This feature is automatically enabled on issues when the setup requirements are met.
Once a suspect commit has been identified, it is displayed on the issue panel, as shown in the highlighted area of the image below.
To view a suspect commit on GitHub, click the View Commit button.
Suspect commit criteria
A commit becomes a suspect commit if:
- It modifies one of the lines in the stack trace.
- It was authored before the first error occurrence.
- It was authored no more than 90 days before the first error occurrence.
- It is the most recent commit that meets the above criteria.
For a suspect commit to be displayed on an issue, at least one candidate commit must have been found.
Setup
Once the setup requirements are met, suspect commits automatically appear on issues where available. Commits made before the setup requirements were met are not displayed.
Enable Source Code Integration
The Suspect Commits feature requires Source Code Integration. To enable Source Code Integration:
- On the Integrations page in Datadog, choose Link Source Code in the top navbar.
- Follow the steps to associate a commit with your telemetry and configure your GitHub repository.
Install the GitHub integration
Install the GitHub integration, enabling read permissions for pull requests and contents.


