- Essentials
- Getting Started
- Datadog
- Datadog Site
- DevSecOps
- Serverless for AWS Lambda
- Agent
- Integrations
- Containers
- Dashboards
- Monitors
- Logs
- APM Tracing
- Profiler
- Tags
- API
- Service Catalog
- Session Replay
- Continuous Testing
- Synthetic Monitoring
- Incident Management
- Database Monitoring
- Cloud Security Management
- Cloud SIEM
- Application Security Management
- Workflow Automation
- CI Visibility
- Test Visibility
- Intelligent Test Runner
- Code Analysis
- Learning Center
- Support
- Glossary
- Standard Attributes
- Guides
- Agent
- Integrations
- OpenTelemetry
- Developers
- Authorization
- DogStatsD
- Custom Checks
- Integrations
- Create an Agent-based Integration
- Create an API Integration
- Create a Log Pipeline
- Integration Assets Reference
- Build a Marketplace Offering
- Create a Tile
- Create an Integration Dashboard
- Create a Recommended Monitor
- Create a Cloud SIEM Detection Rule
- OAuth for Integrations
- Install Agent Integration Developer Tool
- Service Checks
- IDE Plugins
- Community
- Guides
- API
- Datadog Mobile App
- CoScreen
- Cloudcraft
- In The App
- Dashboards
- Notebooks
- DDSQL Editor
- Sheets
- Monitors and Alerting
- Infrastructure
- Metrics
- Watchdog
- Bits AI
- Service Catalog
- API Catalog
- Error Tracking
- Service Management
- Infrastructure
- Application Performance
- APM
- Continuous Profiler
- Database Monitoring
- Data Streams Monitoring
- Data Jobs Monitoring
- Digital Experience
- Real User Monitoring
- Product Analytics
- Synthetic Testing and Monitoring
- Continuous Testing
- Software Delivery
- CI Visibility
- CD Visibility
- Test Visibility
- Intelligent Test Runner
- Code Analysis
- Quality Gates
- DORA Metrics
- Security
- Security Overview
- Cloud SIEM
- Cloud Security Management
- Application Security Management
- AI Observability
- Log Management
- Observability Pipelines
- Log Management
- Administration
Request Flow Map
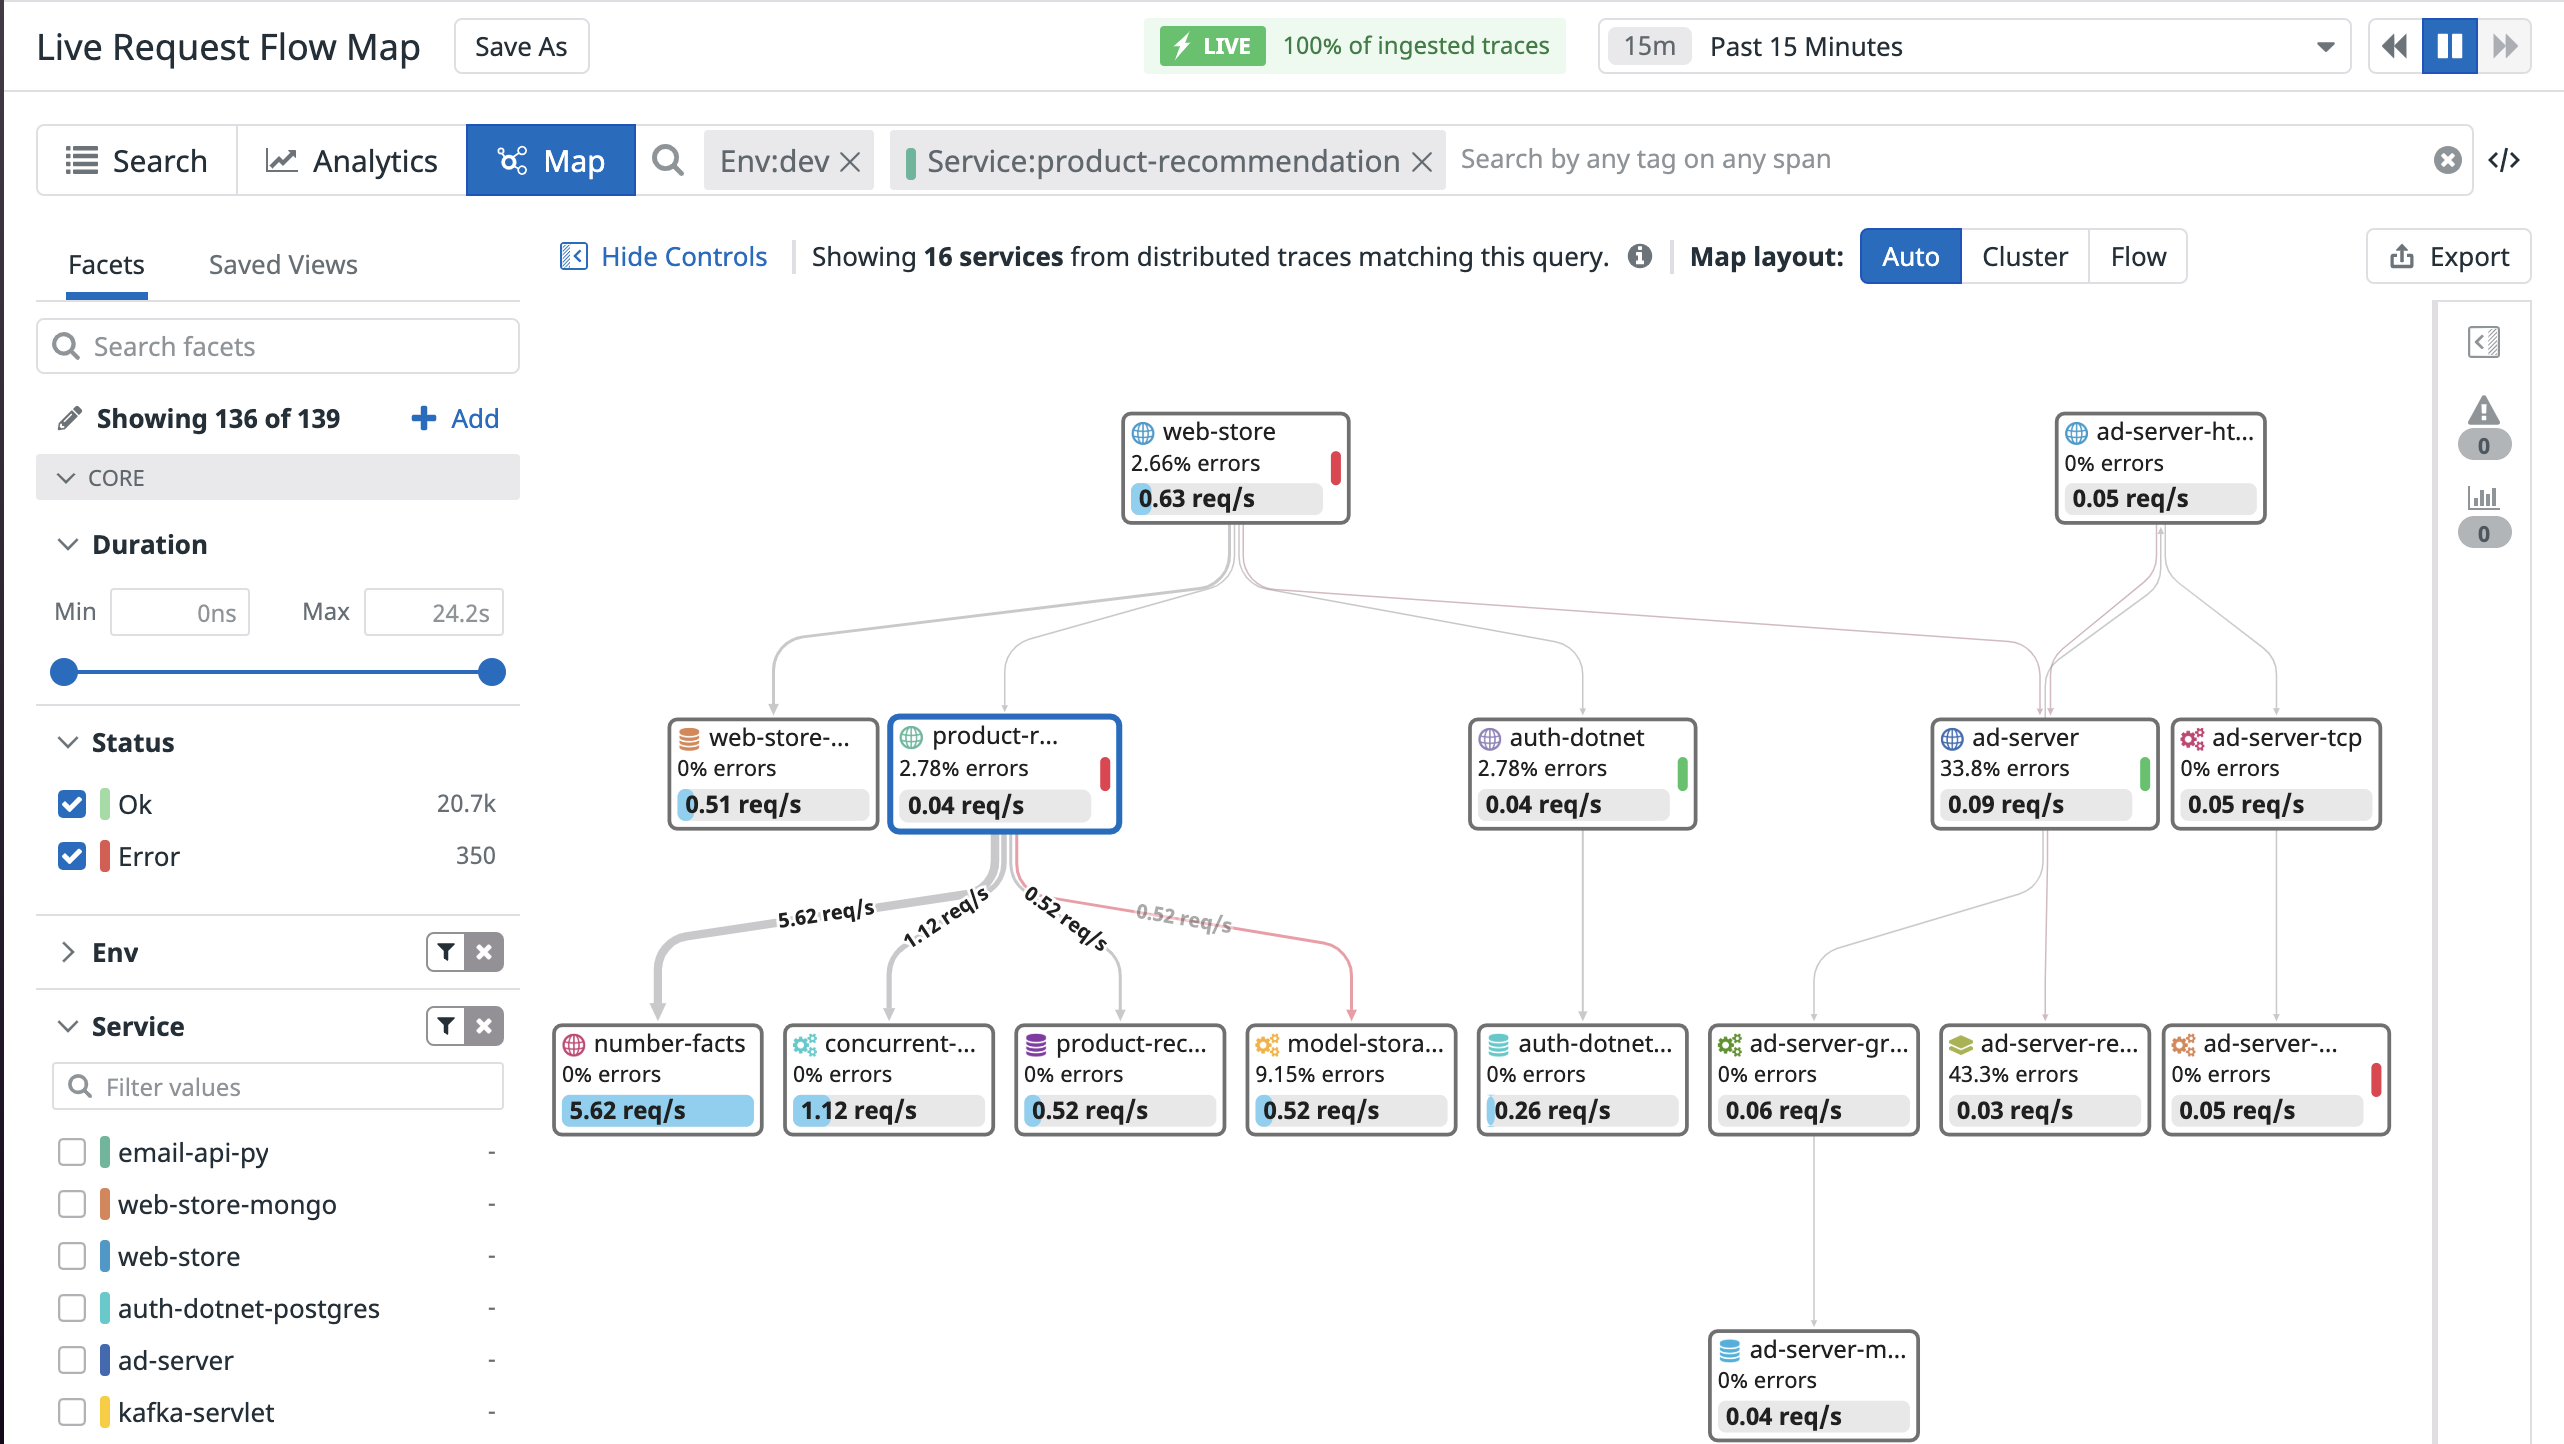
Request flow maps combine two key features of Datadog APM: the service map and live exploring, to help you understand and track request paths through your stack. Quickly identify noisy services and choke points, or how many database calls are generated by a request to a specific endpoint.
No additional configuration is required to use these flow maps, and they are powered by your ingested spans. Scope your LIVE (last 15 minutes) traces to any combination of tags and generate a dynamic map that represents the flow of requests between every service. The map is automatically generated based on your search criteria, and will regenerate live after any changes.
Navigating the request flow map
Hover over an edge that connects two services to see metrics for requests, errors, and latency for requests between those two services that match the query parameters.
The highest throughput connections are highlighted to show the most common path.
Click Export to save a PNG image of the current request flow map. This is a great way to generate a live architecture diagram, or one scoped to a specific user flow.
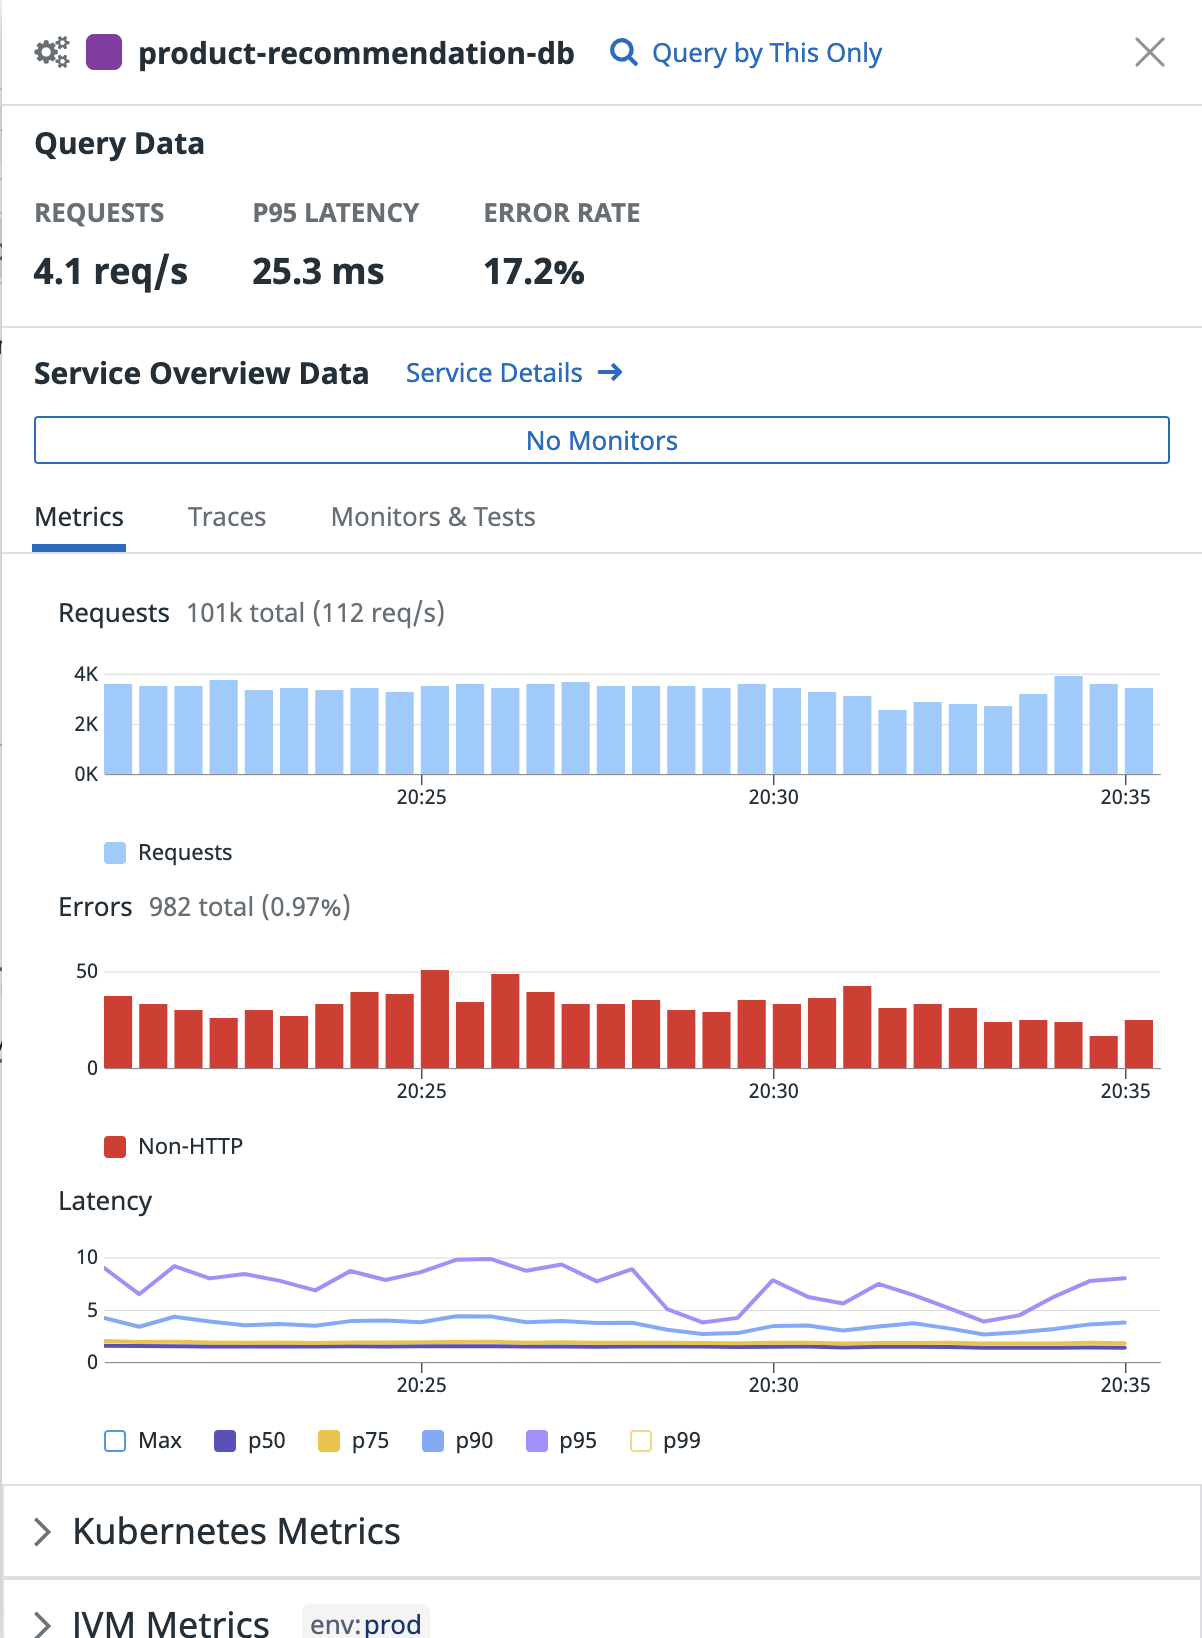
Click any service on the map to view overall health and performance information for that service (throughput, latency, error rates, monitor status), along with infrastructure and runtime metrics.
The map automatically selects an appropriate layout based on the number of services present, and you can click Cluster or Flow to switch between the two available layouts.
RUM Applications are represented on the request flow map if you have connected RUM and Traces.
Try the request flow map in the app. To get started, scope a simple query such as a single service or endpoint.
Examples
Use the request flow map to investigate your application’s behavior:
Search for a resource that corresponds to a particular HTTP request.
If you use shadow deployments or feature flags set as custom span tags, use the map to compare request latency between requests. This is a great pre-production complement to deployment tracking to observe how potential code changes will impact latency of deployed versions.
Further Reading
Additional helpful documentation, links, and articles:


