- Essentials
- Getting Started
- Datadog
- Datadog Site
- DevSecOps
- Serverless for AWS Lambda
- Agent
- Integrations
- Containers
- Dashboards
- Monitors
- Logs
- APM Tracing
- Profiler
- Tags
- API
- Service Catalog
- Session Replay
- Continuous Testing
- Synthetic Monitoring
- Incident Management
- Database Monitoring
- Cloud Security Management
- Cloud SIEM
- Application Security Management
- Workflow Automation
- CI Visibility
- Test Visibility
- Intelligent Test Runner
- Code Analysis
- Learning Center
- Support
- Glossary
- Standard Attributes
- Guides
- Agent
- Integrations
- OpenTelemetry
- Developers
- Authorization
- DogStatsD
- Custom Checks
- Integrations
- Create an Agent-based Integration
- Create an API Integration
- Create a Log Pipeline
- Integration Assets Reference
- Build a Marketplace Offering
- Create a Tile
- Create an Integration Dashboard
- Create a Recommended Monitor
- Create a Cloud SIEM Detection Rule
- OAuth for Integrations
- Install Agent Integration Developer Tool
- Service Checks
- IDE Plugins
- Community
- Guides
- API
- Datadog Mobile App
- CoScreen
- Cloudcraft
- In The App
- Dashboards
- Notebooks
- DDSQL Editor
- Sheets
- Monitors and Alerting
- Infrastructure
- Metrics
- Watchdog
- Bits AI
- Service Catalog
- API Catalog
- Error Tracking
- Service Management
- Infrastructure
- Application Performance
- APM
- Continuous Profiler
- Database Monitoring
- Data Streams Monitoring
- Data Jobs Monitoring
- Digital Experience
- Real User Monitoring
- Product Analytics
- Synthetic Testing and Monitoring
- Continuous Testing
- Software Delivery
- CI Visibility
- CD Visibility
- Test Visibility
- Intelligent Test Runner
- Code Analysis
- Quality Gates
- DORA Metrics
- Security
- Security Overview
- Cloud SIEM
- Cloud Security Management
- Application Security Management
- AI Observability
- Log Management
- Observability Pipelines
- Log Management
- Administration
Trace Retention
With Datadog APM, the ingestion and the retention of traces for 15 days are fully customizable.
To track or monitor your volume of ingested and indexed data, see the Usage Metrics documentation.
Retention filters
After spans have been ingested, some are kept for 15 days according to the retention filters that have been set on your account.
The following retention filters are enabled by default to ensure that you keep visibility over all of your services and endpoints, as well as errors and high-latency traces:
- The Intelligent Retention Filter retains spans for every environment, service, operation, and resource for different latency distributions.
- The
Error Defaultretention filter indexes error spans withstatus:error. The retention rate and the query are configurable. For example, to capture production errors, set the query tostatus:error, env:production. Disable the retention filter if you do not want to capture the errors by default. - The
Application Securityretention filter is enabled if you are using Application Security Management. It ensures the retention of all spans in traces that have been identified as having an application security impact (an attack attempt). - The
Syntheticsretention filter is enabled if you are using Synthetic Monitoring. It ensures that traces generated from synthetic API and browser tests remain available by default. See Synthetic APM for more information, including how to correlate traces with synthetic tests.
In addition to these, you can create any number of additional custom tag-based retention filters for your services, to capture the data that matters the most to your business.
Note: The permission apm_retention_filter_write is required to create, delete, modify, enable, or disable retention filters.
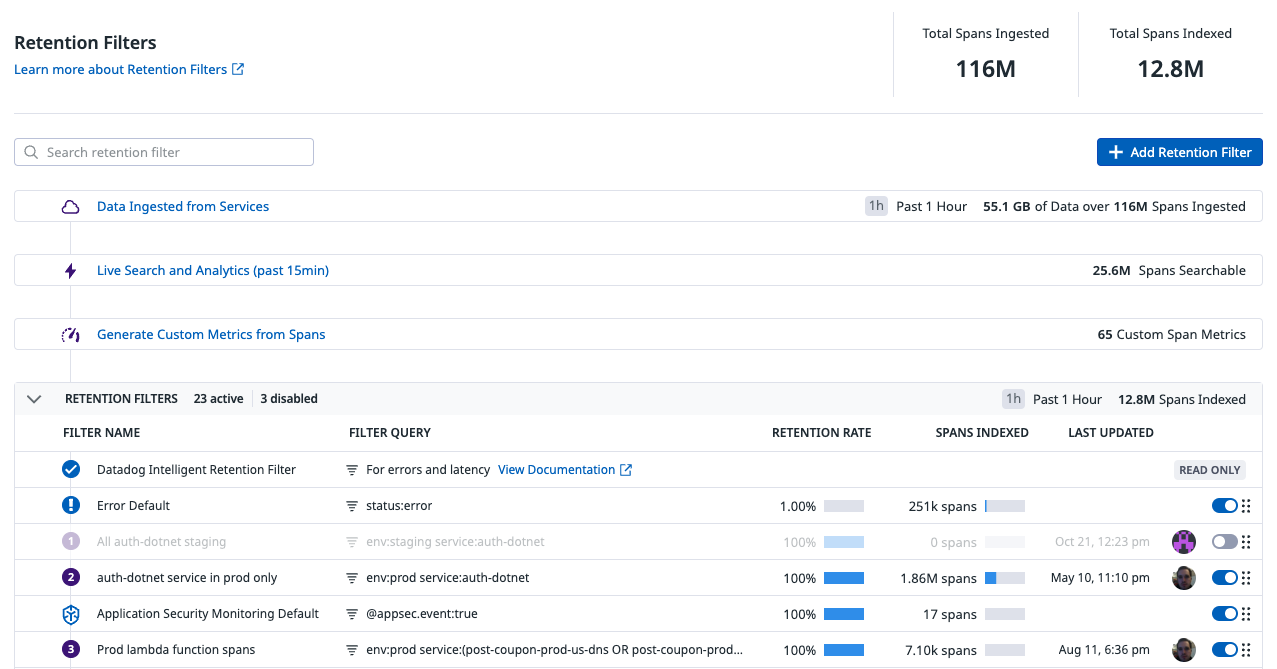
In Datadog, on the Retention Filters tab, you can see a list of all retention filters:
- Filter Name
- The name of each retention filter used to index spans.
- Filter Query
- The tag-based query for each filter.
- Retention Rate
- A percentage from 0 to 100% of how many matching spans are indexed. The retained spans are uniformly chosen from among spans that match the filter query.
- Spans Indexed
- The number of spans indexed by the filter over the selected time period.
- Last Updated
- The date and user who last modified the retention filter.
- Enabled toggle
- Allows filters to be turned on and off.
Note: The order of the retention filter list changes indexing behavior. If a span matches a retention filter early in the list, the span is either kept or dropped. Any matching retention filter lower on the list does not catch the already-processed span.
The Spans Indexed column for each retention filter is powered by the datadog.estimated_usage.apm.indexed_spans metric, which you can use to track your indexed span usage. For more information, read Usage Metrics, or see the dashboard available in your account.
Note: Retention filters do not affect what traces are collected by the Agent and sent to Datadog ("ingested"). The only way to change how much tracing data is ingested is through ingestion controls.
Datadog intelligent retention filter
The Datadog intelligent retention filter is always active for your services, and it keeps a representative selection of traces without requiring you to create dozens of custom retention filters. It is composed of:
Note: Trace Queries are based on the data indexed by the Intelligent Retention filter.
Spans indexed by the Intelligent retention filter (diversity sampling and 1% flat sampling) are not counted towards the usage of indexed spans, and so do not impact your bill.
If there are specific tags or attributes for which you want to index more spans than what the Intelligent Retention filter retains, then create your own retention filter.
Diversity sampling
Diversity sampling scans through the service entry spans and retains for 30 days:
- At least one span (and the associated trace) for each combination of environment, service, operation, and resource every 15 minutes at most, to ensure that you can always find example traces in service and resource pages, even for low traffic endpoints.
- High latency spans for the
p75,p90, andp95percentile spans (and the associated trace) for each combination of environment, service, operation, and resource. - A representative selection of errors, ensuring error diversity (for example, response status code 400s, 500s).
The set of data captured by diversity sampling is not uniformly sampled (that is, it is not proportionally representative of the full traffic). It is biased towards errors and high latency traces.
One percent flat sampling
The flat 1% sampling is a uniform 1% sample of ingested spans. It is applied based on the trace_id, meaning that all spans belonging to the same trace share the same sampling decision.
This sampling mechanism is uniform, and it is proportionally representative of the full ingested traffic. As a result, low-traffic services and endpoints might be missing from that dataset if you filter on a short time frame.
Create your own retention filter
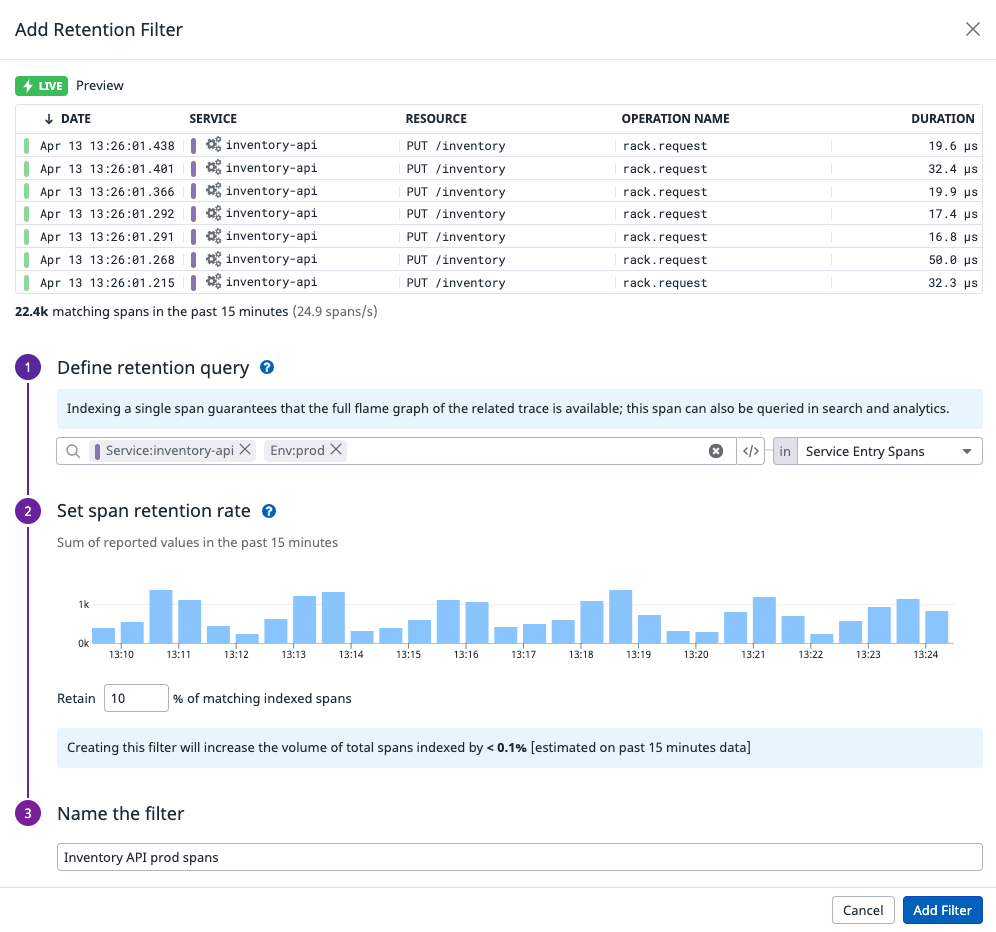
Decide which spans are indexed and retained for 15 days by creating, modifying, and disabling additional filters based on tags. Set a percentage of spans matching each filter to be retained. Any span that is retained has its corresponding trace saved as well, and when it is viewed in the Trace Explorer, the complete trace is available.
Note: In order for you to search by tag in the Trace Explorer, the span that directly contains the searched-upon tag must have been indexed by a retention filter.
- Define the retention query by adding any span tag. Choose to retain all spans with the defined tags, only service entry spans (selected by default), or only trace root spans.
- Set a percentage of spans matching these tags to be indexed.
- Name the filter.
- Save the new filter.
When you create a new filter or edit the retention rate of an existing filter, Datadog displays an estimate of the percentage change in global indexing volume.
Filters are retained in a serial order. If you have an upstream filter that retains spans with the resource:POST /hello_world tag, those spans do not show up in the Edit window of a downstream filter that searches for spans with the same tag because they have been retained by the upstream filter.
For example, you can create filters to keep all traces for:
- Credit card transactions over $100.
- High-priority customers using a mission-critical feature of your SaaS solution.
- Specific versions of an online delivery service application.
Trace search and analytics on indexed spans
In the Trace Explorer, dashboards, and notebooks
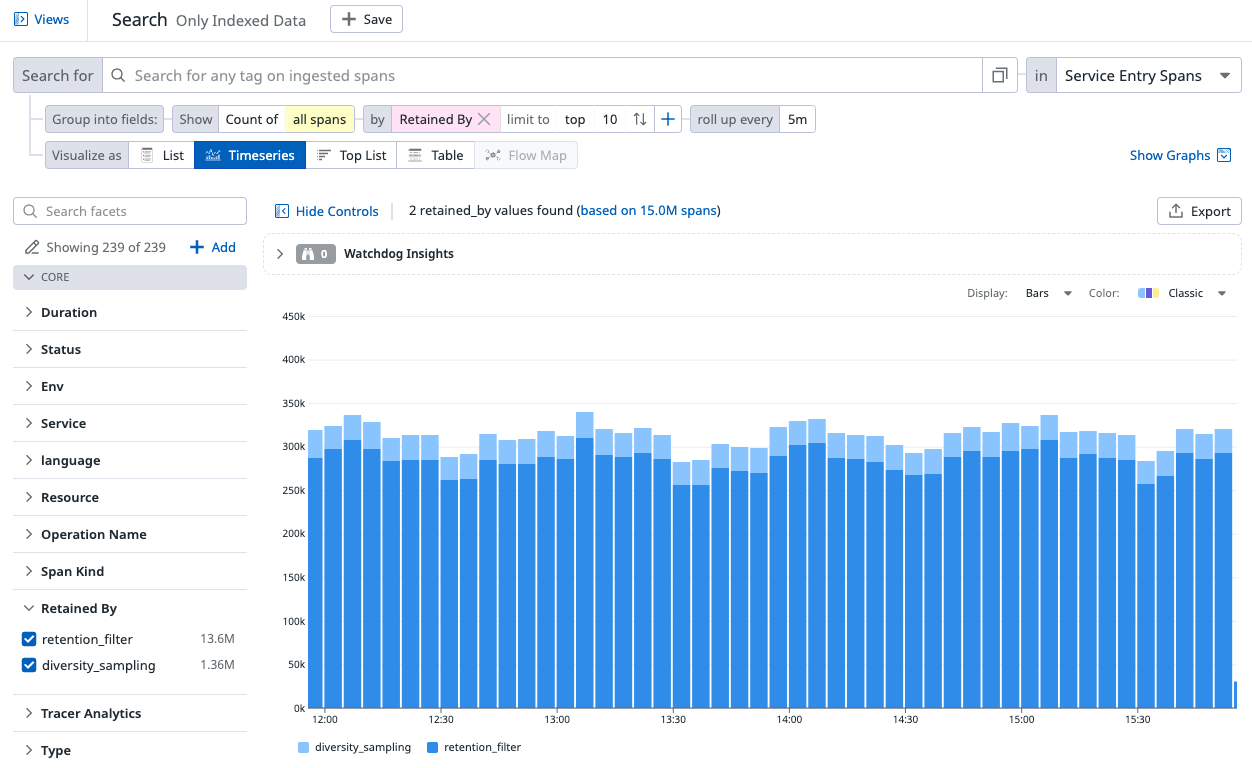
By default, spans indexed by custom retention filters and the intelligent retention filter are included in the Trace Explorer aggregated views (timeseries, toplist, table), as well as in dashboards and notebook queries.
However, because the diversity-sampled set of data is not uniformly sampled (that is, not proportionally representative of the full traffic) and is biased towards errors and high latency traces, you can choose to exclude these spans from these views by adding -retained_by:diversity_sampling query parameter to the query.
The retained_by attribute is present on all retained spans. Its value is:
retained_by:diversity_samplingif the span was captured by [diversity sampling] (part of the Intelligent retention filter).retained_by:flat_sampledif the span was indexed by the 1% flat sampling.retained_by:retention_filterif the span was captured by any tag-based retention filter, including theError DefaultandApplication Security Defaultretention filters.
In trace analytics monitors
For the reasons explained above, spans indexed by the intelligent retention filter are excluded from APM trace analytics monitor evaluation.
Further Reading
Additional helpful documentation, links, and articles:


