- Principales informations
- Getting Started
- Datadog
- Site Datadog
- DevSecOps
- Serverless for AWS Lambda
- Agent
- Intégrations
- Conteneurs
- Dashboards
- Monitors
- Logs
- Tracing
- Profileur
- Tags
- API
- Service Catalog
- Session Replay
- Continuous Testing
- Surveillance Synthetic
- Incident Management
- Database Monitoring
- Cloud Security Management
- Cloud SIEM
- Application Security Management
- Workflow Automation
- CI Visibility
- Test Visibility
- Intelligent Test Runner
- Code Analysis
- Learning Center
- Support
- Glossary
- Standard Attributes
- Guides
- Agent
- Intégrations
- OpenTelemetry
- Développeurs
- Authorization
- DogStatsD
- Checks custom
- Intégrations
- Create an Agent-based Integration
- Create an API Integration
- Create a Log Pipeline
- Integration Assets Reference
- Build a Marketplace Offering
- Create a Tile
- Create an Integration Dashboard
- Create a Recommended Monitor
- Create a Cloud SIEM Detection Rule
- OAuth for Integrations
- Install Agent Integration Developer Tool
- Checks de service
- IDE Plugins
- Communauté
- Guides
- API
- Application mobile
- CoScreen
- Cloudcraft
- In The App
- Dashboards
- Notebooks
- DDSQL Editor
- Alertes
- Infrastructure
- Métriques
- Watchdog
- Bits AI
- Service Catalog
- API Catalog
- Error Tracking
- Service Management
- Infrastructure
- Universal Service Monitoring
- Conteneurs
- Sans serveur
- Surveillance réseau
- Cloud Cost
- Application Performance
- APM
- Profileur en continu
- Database Monitoring
- Agent Integration Overhead
- Setup Architectures
- Configuration de Postgres
- Configuration de MySQL
- Configuration de SQL Server
- Setting Up Oracle
- Setting Up MongoDB
- Connecting DBM and Traces
- Données collectées
- Exploring Database Hosts
- Explorer les métriques de requête
- Explorer des échantillons de requêtes
- Dépannage
- Guides
- Data Streams Monitoring
- Data Jobs Monitoring
- Digital Experience
- RUM et Session Replay
- Product Analytics
- Surveillance Synthetic
- Continuous Testing
- Software Delivery
- CI Visibility
- CD Visibility
- Test Visibility
- Exécuteur de tests intelligent
- Code Analysis
- Quality Gates
- DORA Metrics
- Securité
- Security Overview
- Cloud SIEM
- Cloud Security Management
- Application Security Management
- AI Observability
- Log Management
- Pipelines d'observabilité
- Log Management
- Administration
Solve Memory Leaks with Profiling
Cette page n'est pas encore disponible en français, sa traduction est en cours.
Si vous avez des questions ou des retours sur notre projet de traduction actuel, n'hésitez pas à nous contacter.
Si vous avez des questions ou des retours sur notre projet de traduction actuel, n'hésitez pas à nous contacter.
Overview
Profiling has several datasets to help solve memory leaks, such as the Live Heap profile type, which is available for multiple languages.
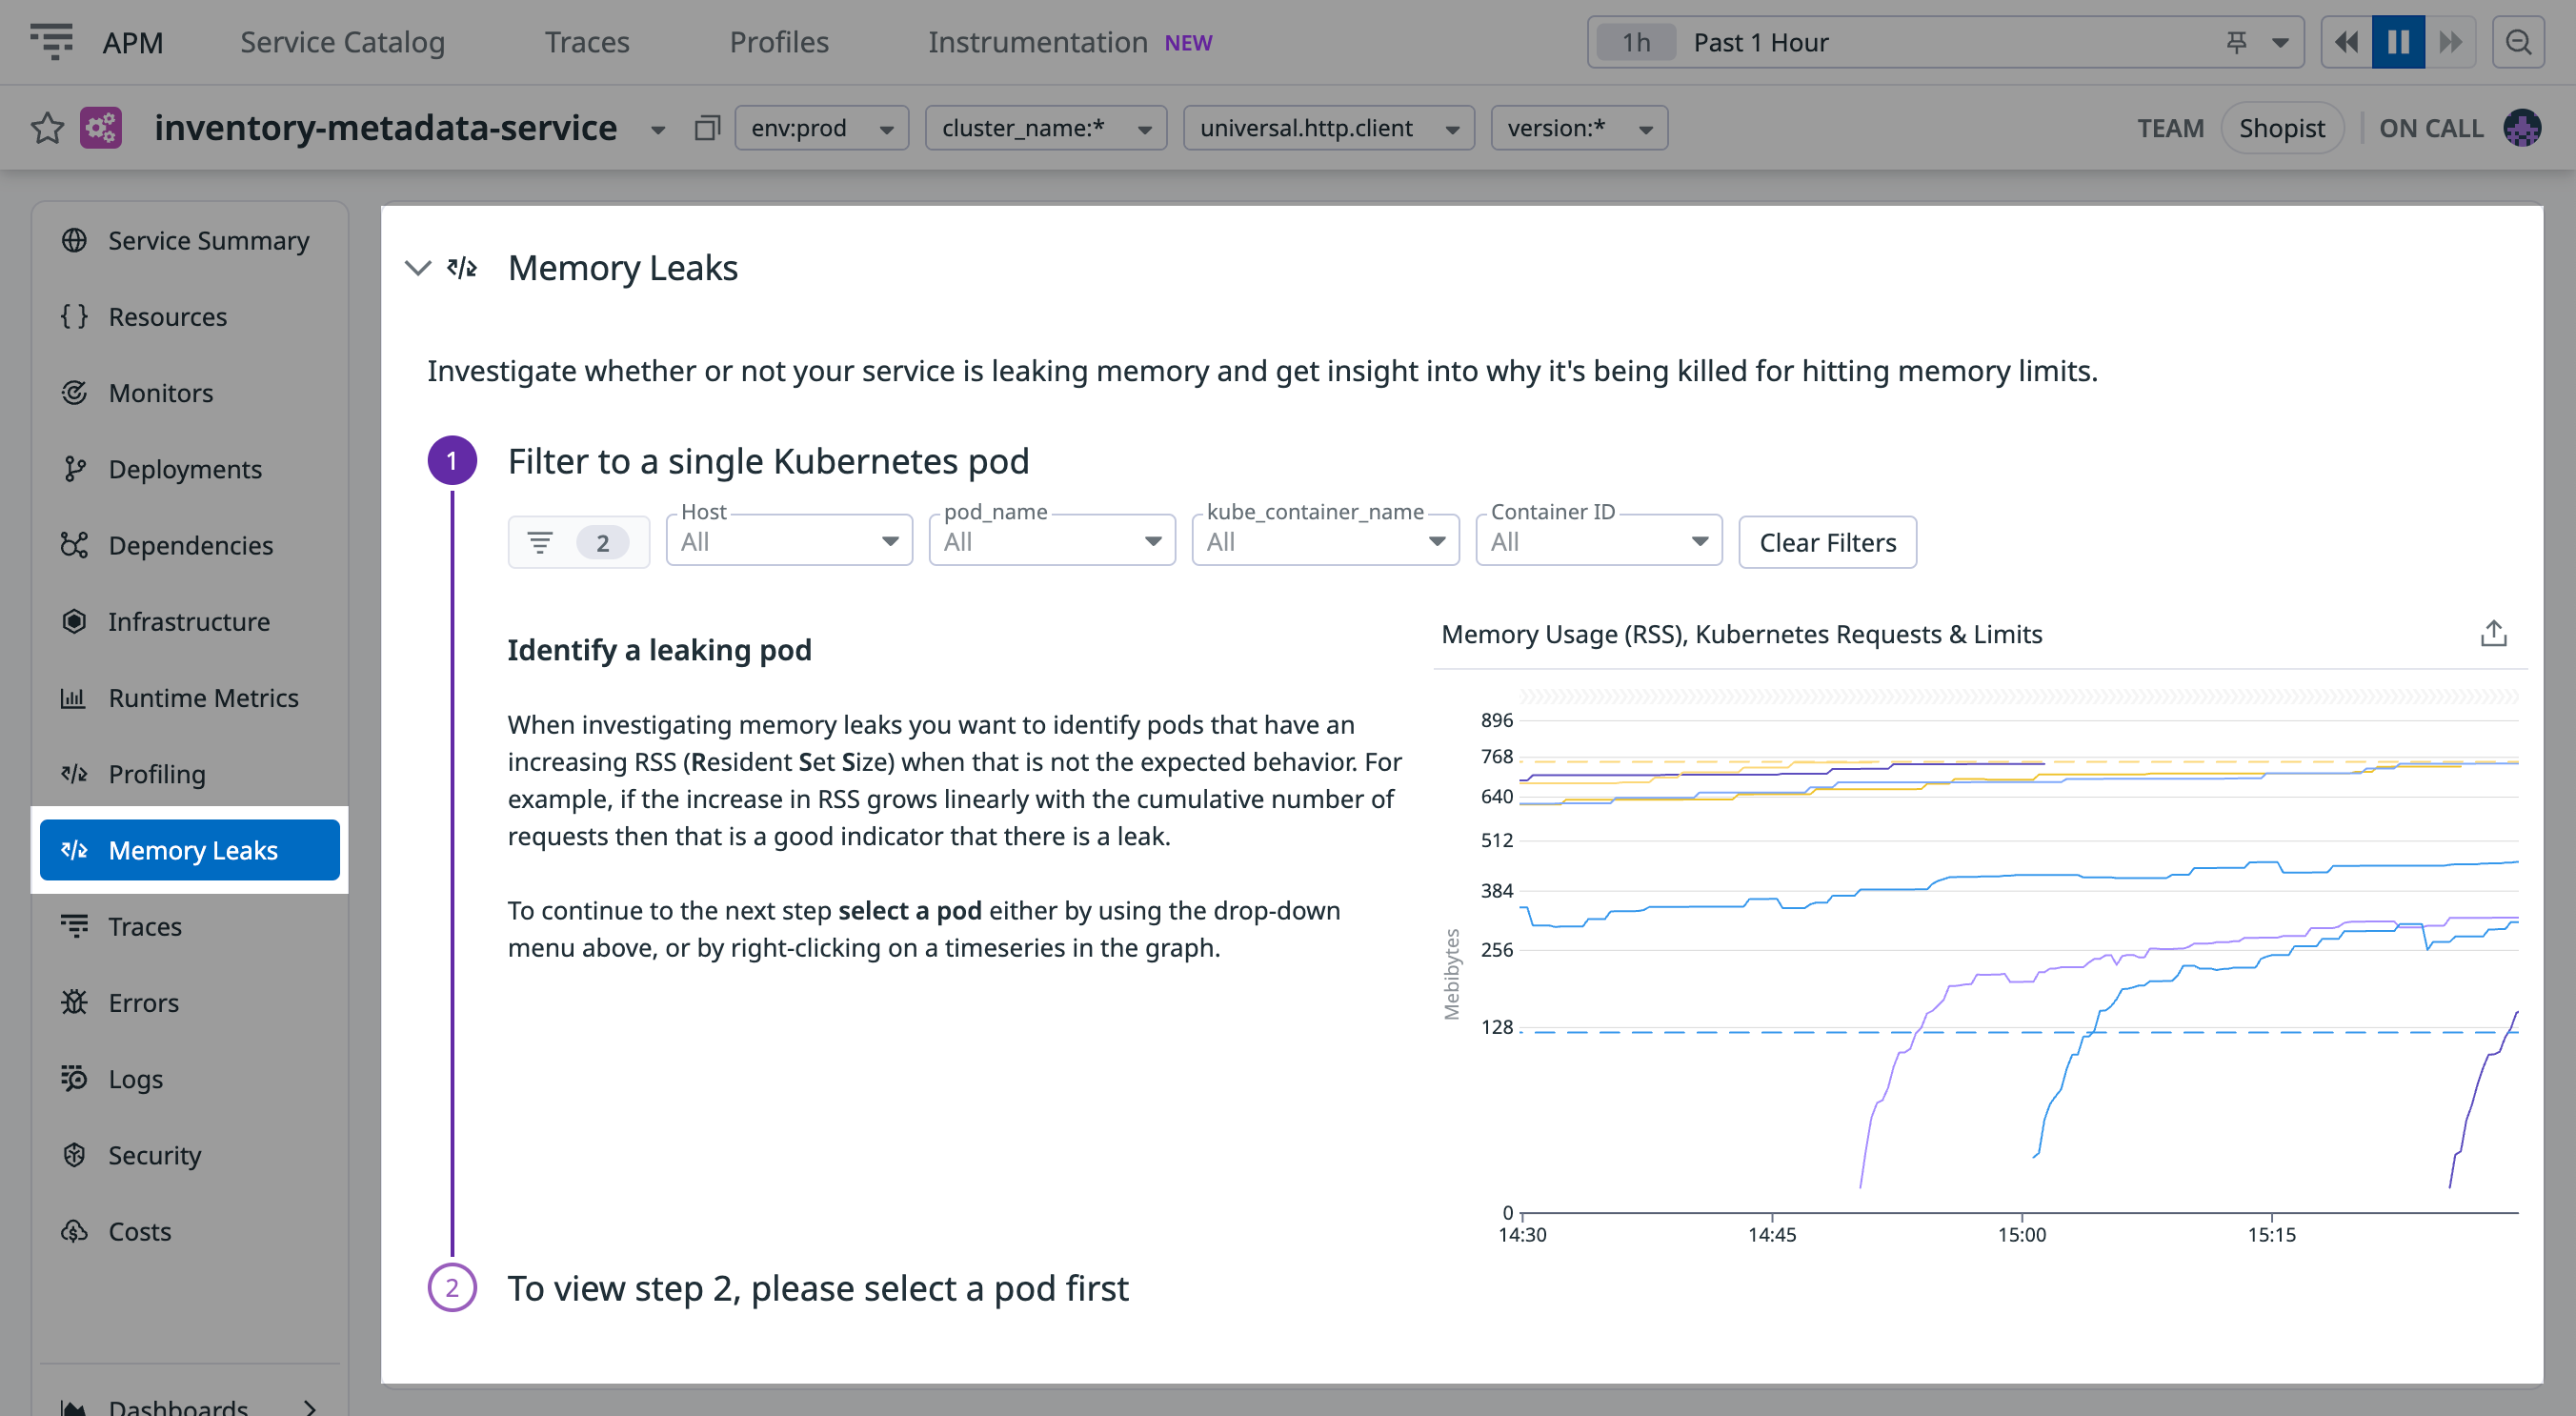
To help you get started, Datadog provides an end-to-end, guided walkthrough for Go or Java services:
What to expect
Following this walkthrough requires zero prior knowledge, and it is accessible for first-time investigations.
The walkthrough guides you through several steps to:
- Scope to the relevant data.
- Recommend Datadog integrations and upgrades that assist in the investigation.
- Explain how memory management works in your runtime.
- Propose potential root causes through Profile Comparisons.
Requirements
To use this walkthrough, you need:
- A Go or Java service running on Kubernetes with the Datadog Kubernetes integration installed.
- Continuous Profiler enabled.
Get started
To investigate a memory leak using the guided walkthrough:
- Go to APM > Service Catalog.
- Hover over the service you want to investigate and click Service Page.
- Click the Memory Leaks tab.
- Follow the guided steps to complete your investigation.
Further reading
Documentation, liens et articles supplémentaires utiles:

