- Essentials
- Getting Started
- Datadog
- Datadog Site
- DevSecOps
- Serverless for AWS Lambda
- Agent
- Integrations
- Containers
- Dashboards
- Monitors
- Logs
- APM Tracing
- Profiler
- Tags
- API
- Service Catalog
- Session Replay
- Continuous Testing
- Synthetic Monitoring
- Incident Management
- Database Monitoring
- Cloud Security Management
- Cloud SIEM
- Application Security Management
- Workflow Automation
- CI Visibility
- Test Visibility
- Test Impact Analysis
- Code Analysis
- Learning Center
- Support
- Glossary
- Standard Attributes
- Guides
- Agent
- Integrations
- OpenTelemetry
- Developers
- Authorization
- DogStatsD
- Custom Checks
- Integrations
- Create an Agent-based Integration
- Create an API Integration
- Create a Log Pipeline
- Integration Assets Reference
- Build a Marketplace Offering
- Create a Tile
- Create an Integration Dashboard
- Create a Recommended Monitor
- Create a Cloud SIEM Detection Rule
- OAuth for Integrations
- Install Agent Integration Developer Tool
- Service Checks
- IDE Plugins
- Community
- Guides
- Administrator's Guide
- API
- Datadog Mobile App
- CoScreen
- Cloudcraft
- In The App
- Dashboards
- Notebooks
- DDSQL Editor
- Sheets
- Monitors and Alerting
- Infrastructure
- Metrics
- Watchdog
- Bits AI
- Service Catalog
- API Catalog
- Error Tracking
- Service Management
- Infrastructure
- Application Performance
- APM
- Continuous Profiler
- Database Monitoring
- Data Streams Monitoring
- Data Jobs Monitoring
- Digital Experience
- Real User Monitoring
- Product Analytics
- Synthetic Testing and Monitoring
- Continuous Testing
- Software Delivery
- CI Visibility
- CD Visibility
- Test Optimization
- Code Analysis
- Quality Gates
- DORA Metrics
- Security
- Security Overview
- Cloud SIEM
- Cloud Security Management
- Application Security Management
- AI Observability
- Log Management
- Observability Pipelines
- Log Management
- Administration
Configure Monitors
Overview
To start configuring the monitor, complete the following:
- Define the search query: Construct a query to count events, measure metrics, group by one or several dimensions, and more.
- Set alert conditions: Define alert and warning thresholds , evaluation time frames, and configure advanced alert options.
- Configure notifications and automations: Write a custom notification title and message with variables. Choose how notifications are sent to your teams (email, Slack, or PagerDuty). Include workflow automations or cases in the alert notification.
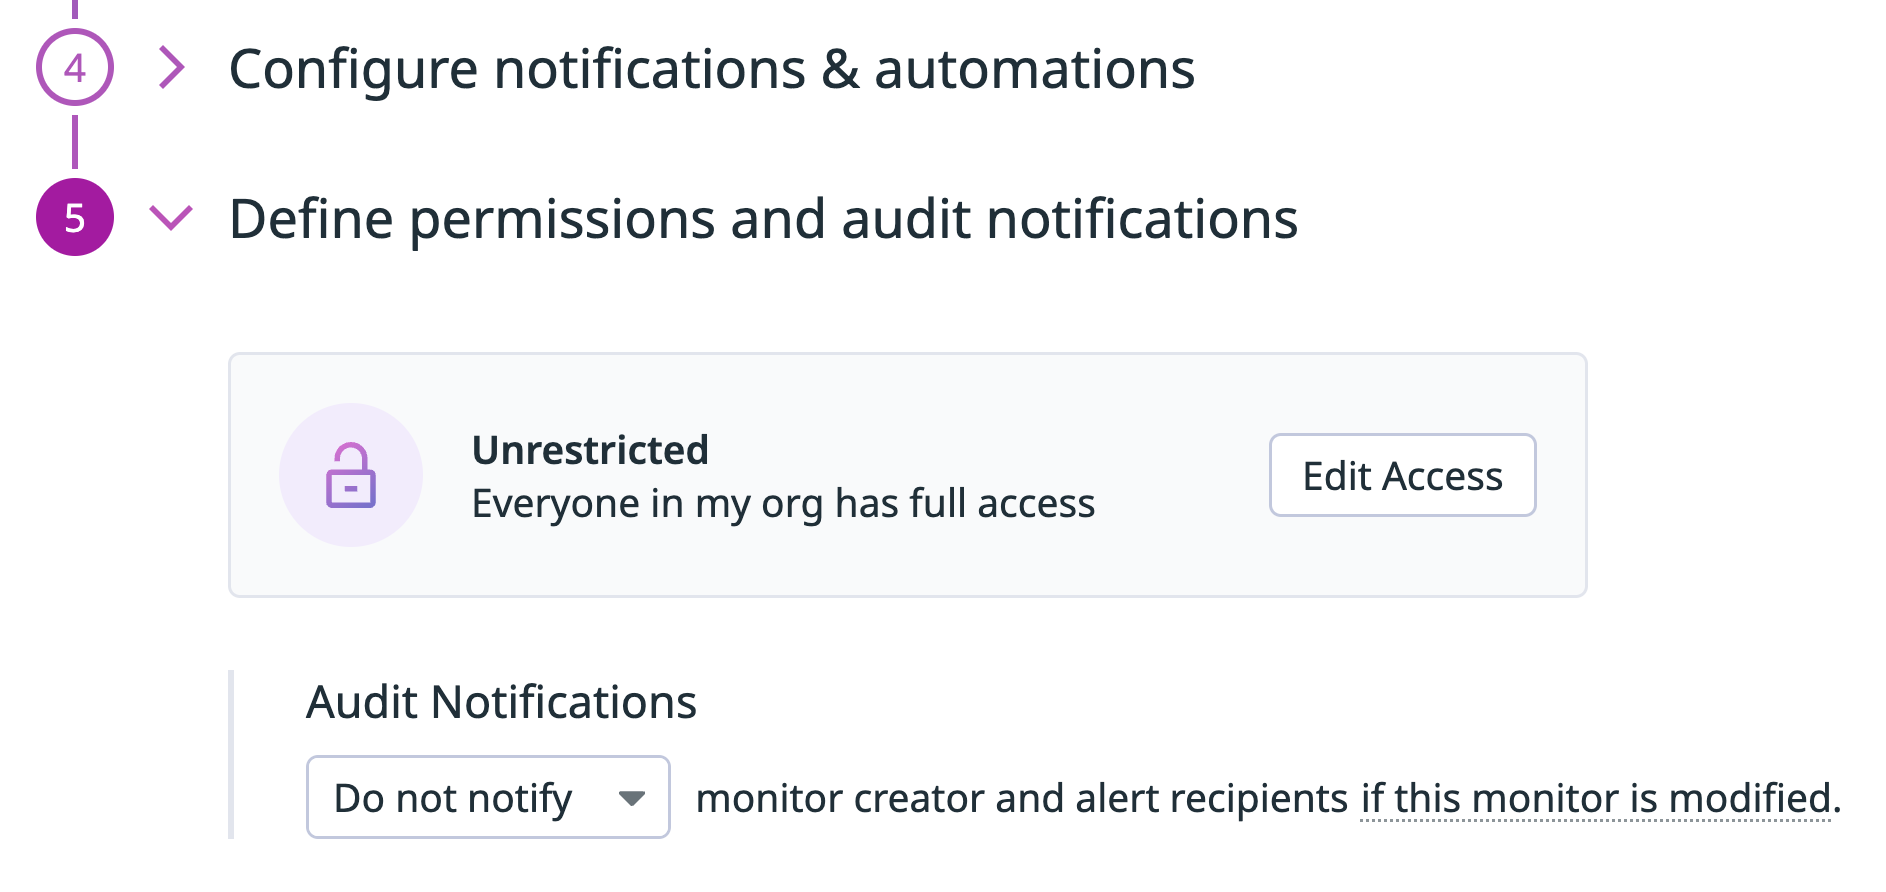
- Define permissions and audit notifications: Configure granular access controls and designate specific roles and users who can edit a monitor. Enable audit notifications to alert if a monitor is modified.
Define the search query
To learn how to construct the search query, see the individual monitor types pages. As you define the search query, the preview graph above the search fields updates.
Set alert conditions
The alert conditions vary based on the monitor type. Configure monitors to trigger if the query value crosses a threshold, or if a certain number of consecutive checks failed.
- Trigger when the
average,max,min, orsumof the metric is above,above or equal to,below, orbelow or equal tothe threshold- during the last
5 minutes,15 minutes,1 hour, orcustomto set a value between 1 minute and 48 hours (1 month for metric monitors)
Aggregation method
The query returns a series of points, but a single value is needed to compare to the threshold. The monitor must reduce the data in the evaluation window to a single value.
| Option | Description |
|---|---|
| average | The series is averaged to produce a single value that is checked against the threshold. It adds the avg() function to your monitor query. |
| max | If any single value in the generated series crosses the threshold, then an alert is triggered. It adds the max() function to your monitor query.* |
| min | If all points in the evaluation window for your query cross the threshold, then an alert is triggered. It adds the min() function to your monitor query.* |
| sum | If the summation of every point in the series crosses the threshold, then an alert is triggered. It adds the sum() function to your monitor query. |
* These descriptions of max and min assume that the monitor alerts when the metric goes above the threshold. For monitors that alert when below the threshold, the max and min behavior is reversed. For more examples, see the Monitor aggregators guide.
Note: There are different behaviors when utilizing as_count(). See as_count() in Monitor Evaluations for details.
Evaluation window
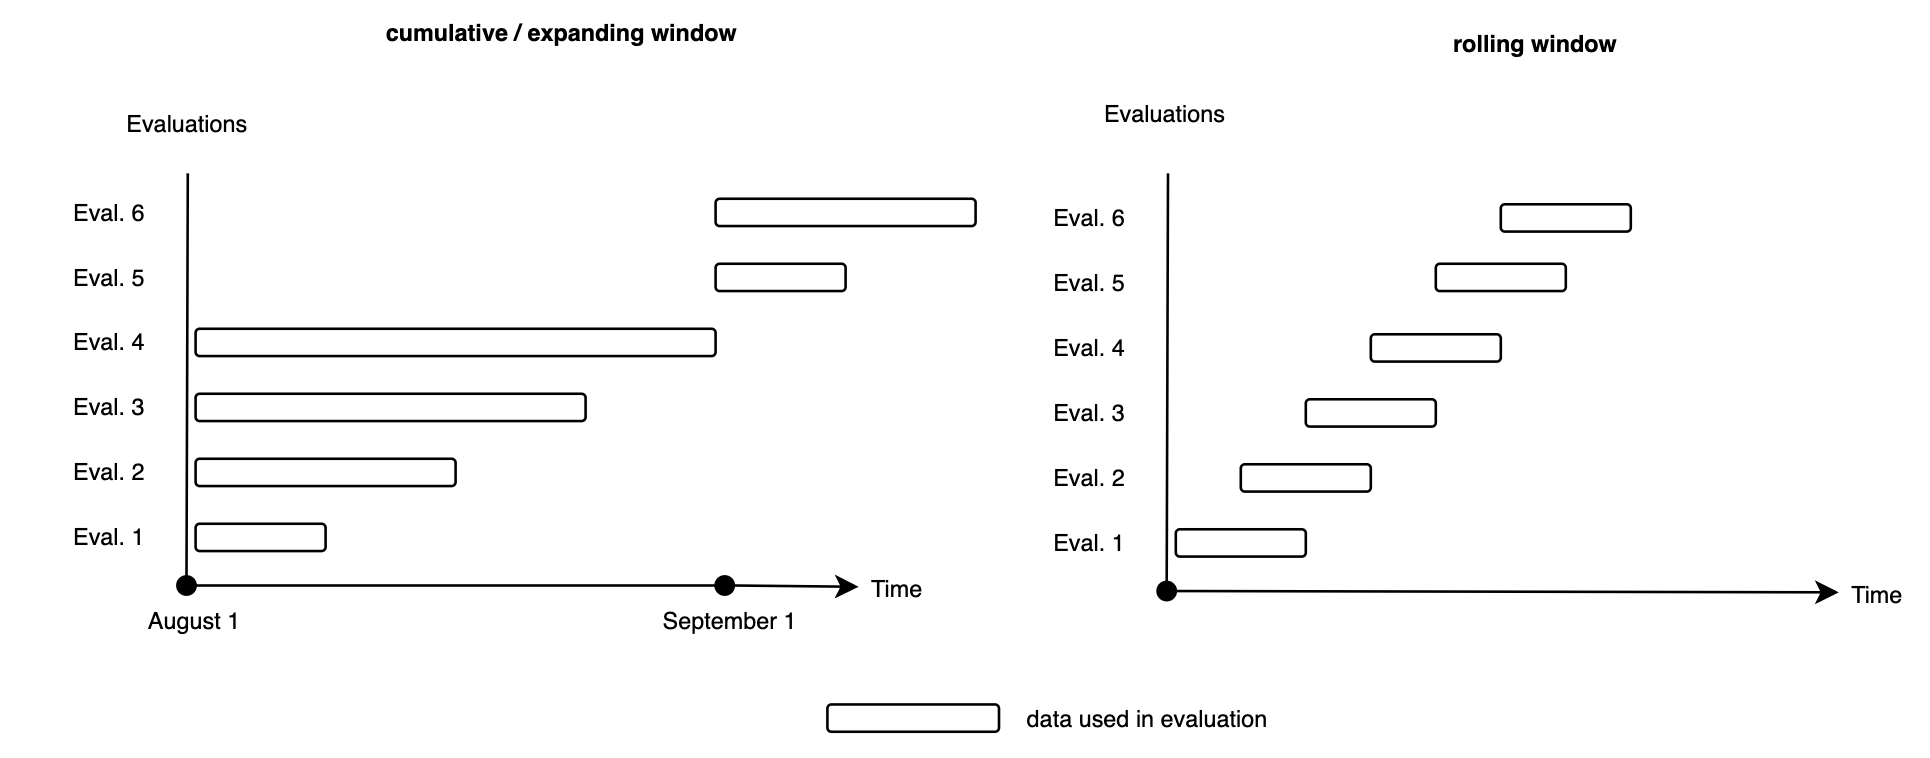
A monitor can be evaluated using cumulative time windows or rolling time windows. Cumulative time windows are best suited for questions that require historical context, such as “What’s the sum of all the data available up to this point in time?” Rolling time windows are best suited for answering questions that do not require this context, such as “What’s the average of the last N data points?”
The figure below illustrates the difference between cumulative and rolling time windows.
Rolling time windows
A rolling time window has a fixed size and shifts its starting point over time. Monitors can look back at the last 5 minutes, 15 minutes, 1 hour, or over a custom time window of up to 1 month.
Cumulative time windows
A cumulative time window has a fixed starting point and expands over time. Monitors support three different cumulative time windows:
Current hour: A time window with a maximum of one hour starting at a configurable minute of an hour. For example, monitor amount of calls an HTTP endpoint receives in one hour starting at minute 0.Current day: A time window with a maximum of 24 hours starting at a configurable hour and minute of a day. For example, monitor a daily log index quota by using thecurrent daytime window and letting it start at 2:00pm UTC.Current month: Looks back at the current month starting on a configurable day of the month at a configurable hour and minute. This option represents a month-to-date time window and is only available for metric monitors.
A cumulative time window is reset after its maximum time span is reached. For example, a cumulative time window looking at the current month resets itself on the first of each month at midnight UTC. Alternatively, a cumulative time window of current hour, which starts at minute 30, resets itself every hour. For example, at 6:30am, 7:30am, 8:30am.
Evaluation frequency
The evaluation frequency defines how often Datadog performs the monitor query. For most configurations, the evaluation frequency is 1 minute, which means that every minute, the monitor queries the selected data over the selected evaluation window and compares the aggregated value against the defined thresholds.
By default, evaluation frequencies depend on the evaluation window that is used. A longer window results in lower evaluation frequencies. The following table illustrates how the evaluation frequency is controlled by larger time windows:
| Evaluation Window Ranges | Evaluation Frequency |
|---|---|
| window < 24 hours | 1 minute |
| 24 hours <= window < 48 hours | 10 minutes |
| window >= 48 hours | 30 minutes |
The evaluation frequency can also be configured so that the alerting condition of the monitor is checked on a daily, weekly, or monthly basis. In this configuration, the evaluation frequency is no longer dependent on the evaluation window, but on the configured schedule.
For more information, see the guide on how to Customize monitor evaluation frequencies.
Thresholds
Use thresholds to set a numeric value for triggering an alert. Depending on your chosen metric, the editor displays the unit used (byte, kibibyte, gibibyte, etc).
Datadog has two types of notifications (alert and warning). Monitors recover automatically based on the alert or warning threshold but additional conditions can be specified. For additional information on recovery thresholds, see What are recovery thresholds?. For example, if a monitor alerts when the metric is above 3 and recovery thresholds are not specified, the monitor recovers once the metric value goes back below 3.
| Option | Description |
|---|---|
| Alert threshold (required) | The value used to trigger an alert notification. |
| Warning threshold | The value used to trigger a warning notification. |
| Alert recovery threshold | An optional threshold to indicate an additional condition for alert recovery. |
| Warning recovery threshold | An optional threshold to indicate an additional condition for warning recovery. |
As you change a threshold, the preview graph in the editor displays a marker showing the cutoff point.
Note: When entering decimal values for thresholds, if your value is <1, add a leading 0 to the number. For example, use 0.5, not .5.
A check alert tracks consecutive statuses submitted per check grouping and compares it to your thresholds. Set up the check alert to:
Trigger the alert after selected consecutive failures:
<NUMBER>Each check run submits a single status of
OK,WARN, orCRITICAL. Choose how many consecutive runs with theWARNandCRITICALstatus trigger a notification. For example, your process might have a single blip where connection fails. If you set this value to> 1, the blip is ignored but a problem with more than one consecutive failure triggers a notification.Resolve the alert after selected consecutive successes:
<NUMBER>Choose how many consecutive runs with the
OKstatus resolves the alert.
See the documentation for process check, integration check, and custom check monitors for more information on configuring check alerts.
Advanced alert conditions
No data
Notifications for missing data are useful if you expect a metric to always be reporting data under normal circumstances. For example, if a host with the Agent must be up continuously, you can expect the system.cpu.idle metric to always report data.
In this case, you should enable notifications for missing data. The sections below explain how to accomplish this with each option.
Note: The monitor must be able to evaluate data before alerting on missing data. For example, if you create a monitor for service:abc and data from that service is not reporting, the monitor does not send alerts.
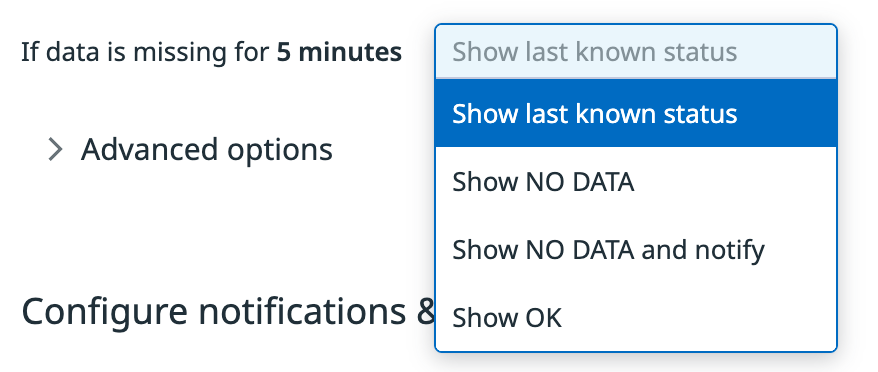
If data is missing for N minutes, select an option from the dropdown menu:
Evaluate as zero/Show last known statusShow NO DATAShow NO DATA and notifyShow OK.
The selected behavior is applied when a monitor’s query does not return any data. Contrary to the Do not notify option, the missing data window is not configurable.
| Option | Monitor status & notification |
|---|---|
Evaluate as zero | Empty result is replaced with zero and is compared to the alert/warning thresholds. For example, if the alert threshold is set to > 10, a zero would not trigger that condition, and the monitor status is set to OK. |
Show last known status | The last known status of the group or monitor is set. |
Show NO DATA | Monitor status is set to NO DATA. |
Show NO DATA and notify | Monitor status is set to NO DATA and a notification is sent out. |
Show OK | Monitor is resolved and status is set to OK. |
The Evaluate as zero and Show last known status options are displayed based on the query type:
- Evaluate as zero: This option is available for monitors using
Countqueries without thedefault_zero()function. - Show last known status: This option is available for monitors using any other query type than
Count, for exampleGauge,Rate, andDistribution, as well as forCountqueries withdefault_zero().
Auto resolve
[Never], After 1 hour, After 2 hours and so on. automatically resolve this event from a triggered state.
Auto-resolve works when data is no longer being submitted. Monitors do not auto-resolve from an ALERT or WARN state if data is still reporting. If data is still being submitted, the renotify feature can be utilized to let your team know when an issue is not resolved.
For some metrics that report periodically, it may make sense for triggered alerts to auto-resolve after a certain time period. For example, if you have a counter that reports only when an error is logged, the alert never resolves because the metric never reports 0 as the number of errors. In this case, set your alert to resolve after a certain time of inactivity on the metric. Note: If a monitor auto-resolves and the value of the query does not meet the recovery threshold at the next evaluation, the monitor triggers an alert again.
In most cases this setting is not useful because you only want an alert to resolve after it is actually fixed. So, in general, it makes sense to leave this as [Never] so alerts only resolve when the metric is above or below the set threshold.
Group retention time
You can drop the group from the monitor status after N hours of missing data. The length of time can be at minimum 1 hour, and at maximum 72 hours. For multi alert monitors, select Remove the non-reporting group after N (length of time).
Similar to the Auto-resolve option, the group retention works when data is no longer being submitted. This option controls how long the group is kept in the monitor’s status once data stops reporting. By default, a group keeps the status for 24 hours before it is dropped. The start time of the group retention and the Auto-resolve option are identical as soon as the monitor query returns no data.
Some use cases to define a group retention time include:
- When you would like to drop the group immediately or shortly after data stops reporting
- When you would like to keep the group in the status for as long as you usually take for troubleshooting
Note: The group retention time option requires a multi alert monitor that supports the On missing data option. These monitor types are APM Trace Analytics, Audit Logs, CI Pipelines, Error Tracking, Events, Logs, and RUM monitors.
New group delay
Delay the evaluation start by N seconds for new groups.
The time (in seconds) to wait before starting alerting, to allow newly created groups to boot and applications to fully start. This should be a non-negative integer.
For example, if you are using containerized architecture, setting a group delay prevents monitor groups scoped on containers from triggering due to high resource usage or high latency when a new container is created. The delay is applied to every new group (which has not been seen in the last 24 hours) and defaults to 60 seconds.
The option is available with multi alert mode.
Evaluation delay
Datadog recommends a 15-minute delay for cloud metrics, which are backfilled by service providers. Additionally, when using a division formula, a 60-second delay is helpful to ensure your monitor evaluates on complete values. See the Cloud Metric Delay page for estimated delay times.
Delay evaluation by N seconds.
The time (in seconds) to delay evaluation. This should be a non-negative integer. So, if the delay is set to 900 seconds (15 minutes), the monitor evaluation is during the last 5 minutes, and the time is 7:00, the monitor evaluates data from 6:40 to 6:45. The maximum configurable evaluation delay is 86400 seconds (24 hours).
Configure notifications and automations
Configure your notification messages to include the information you are most interested in. Specify which teams to send these alerts to as well as which attributes to trigger alerts for.
Message
Use this section to configure notifications to your team and configure how to send these alerts:
- Configure your notification with Template Variables
- Send notifications to your team through email, Slack, or PagerDuty
For more information on the configuration options for the notification message, see Alerting Notifications.
Add metadata
Monitor tags are independent of tags sent by the Agent or integrations. See the Manage Monitors documentation.
- Use the Tags dropdown to associate tags with your monitor.
- Use the Teams dropdown to associate teams with your monitor.
- Choose a Priority.
Set alert aggregation
Alerts are grouped automatically based on your selection of the aggregation selected for your query (for example, avg by service). If the query has no grouping, it defaults to Simple Alert. If the query is grouped by any dimension, grouping changes to Multi Alert.
Simple alert
Simple Alert mode triggers a notification by aggregating over all reporting sources. You receive one alert when the aggregated value meets the set conditions. For example, you might set up a monitor to notify you if the average CPU usage of all servers exceeds a certain threshold. If that threshold is met, you’ll receive a single notification, regardless of the number of individual servers that met the threshold. This can be useful for monitoring broad system trends or behaviors.
Multi alert
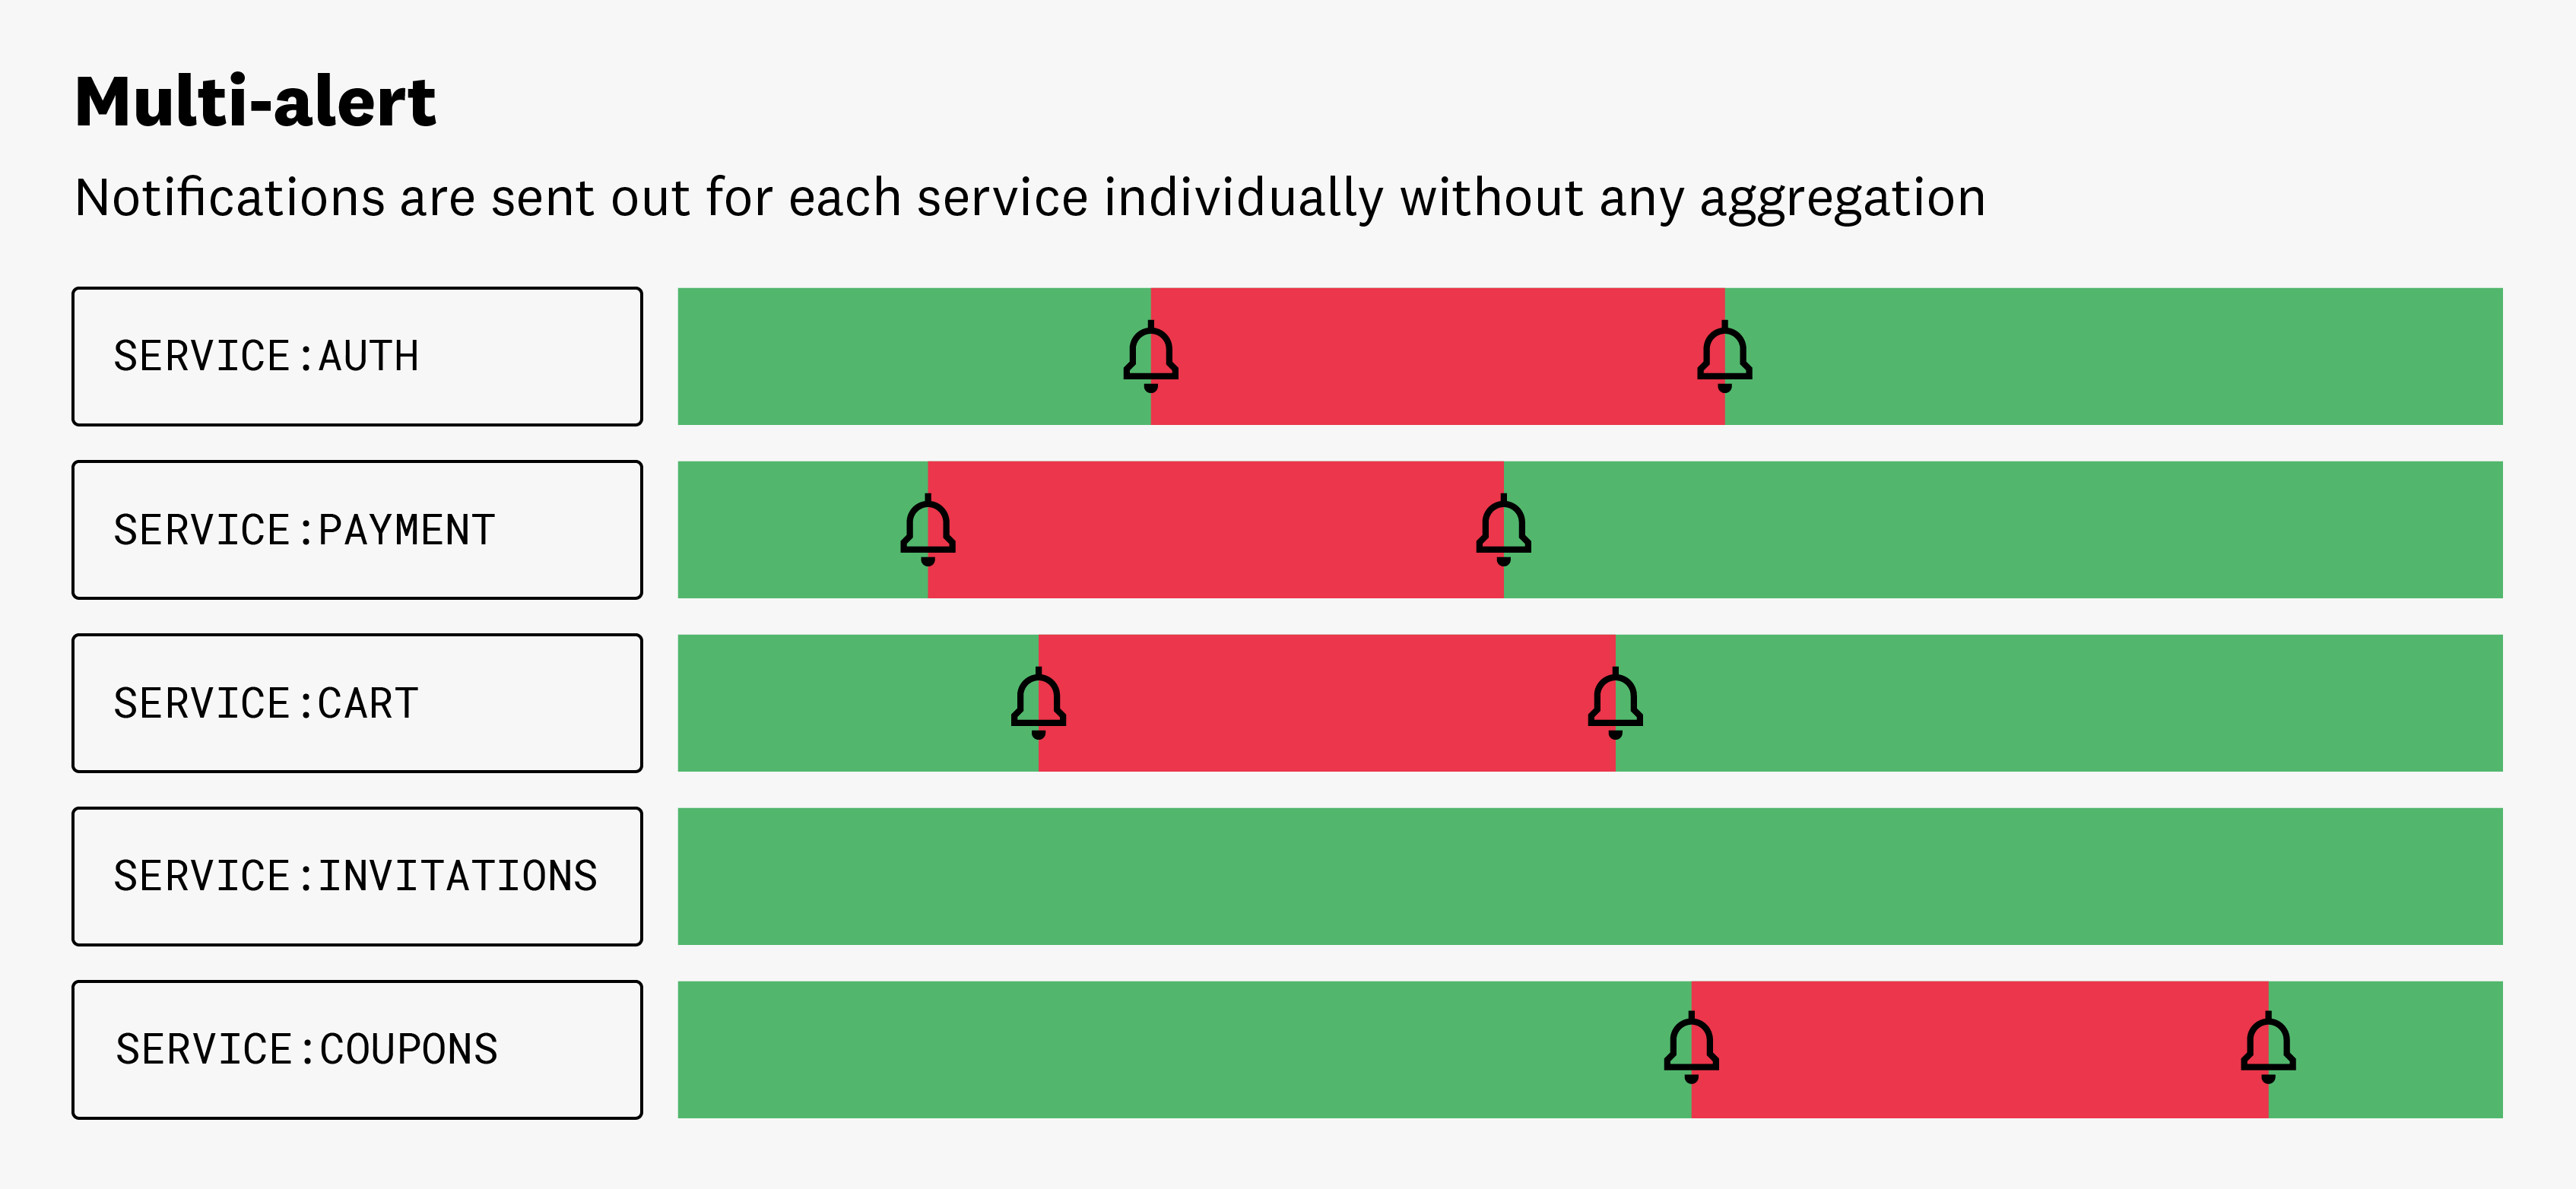
A Multi Alert monitor triggers individual notifications for each entity in a monitor that meets the alert threshold.
For example, when setting up a monitor to notify you if the P99 latency, aggregated by service, exceeds a certain threshold, you would receive a separate alert for each individual service whose P99 latency exceeded the alert threshold. This can be useful for identifying and addressing specific instances of system or application issues. It allows you to track problems on a more granular level.
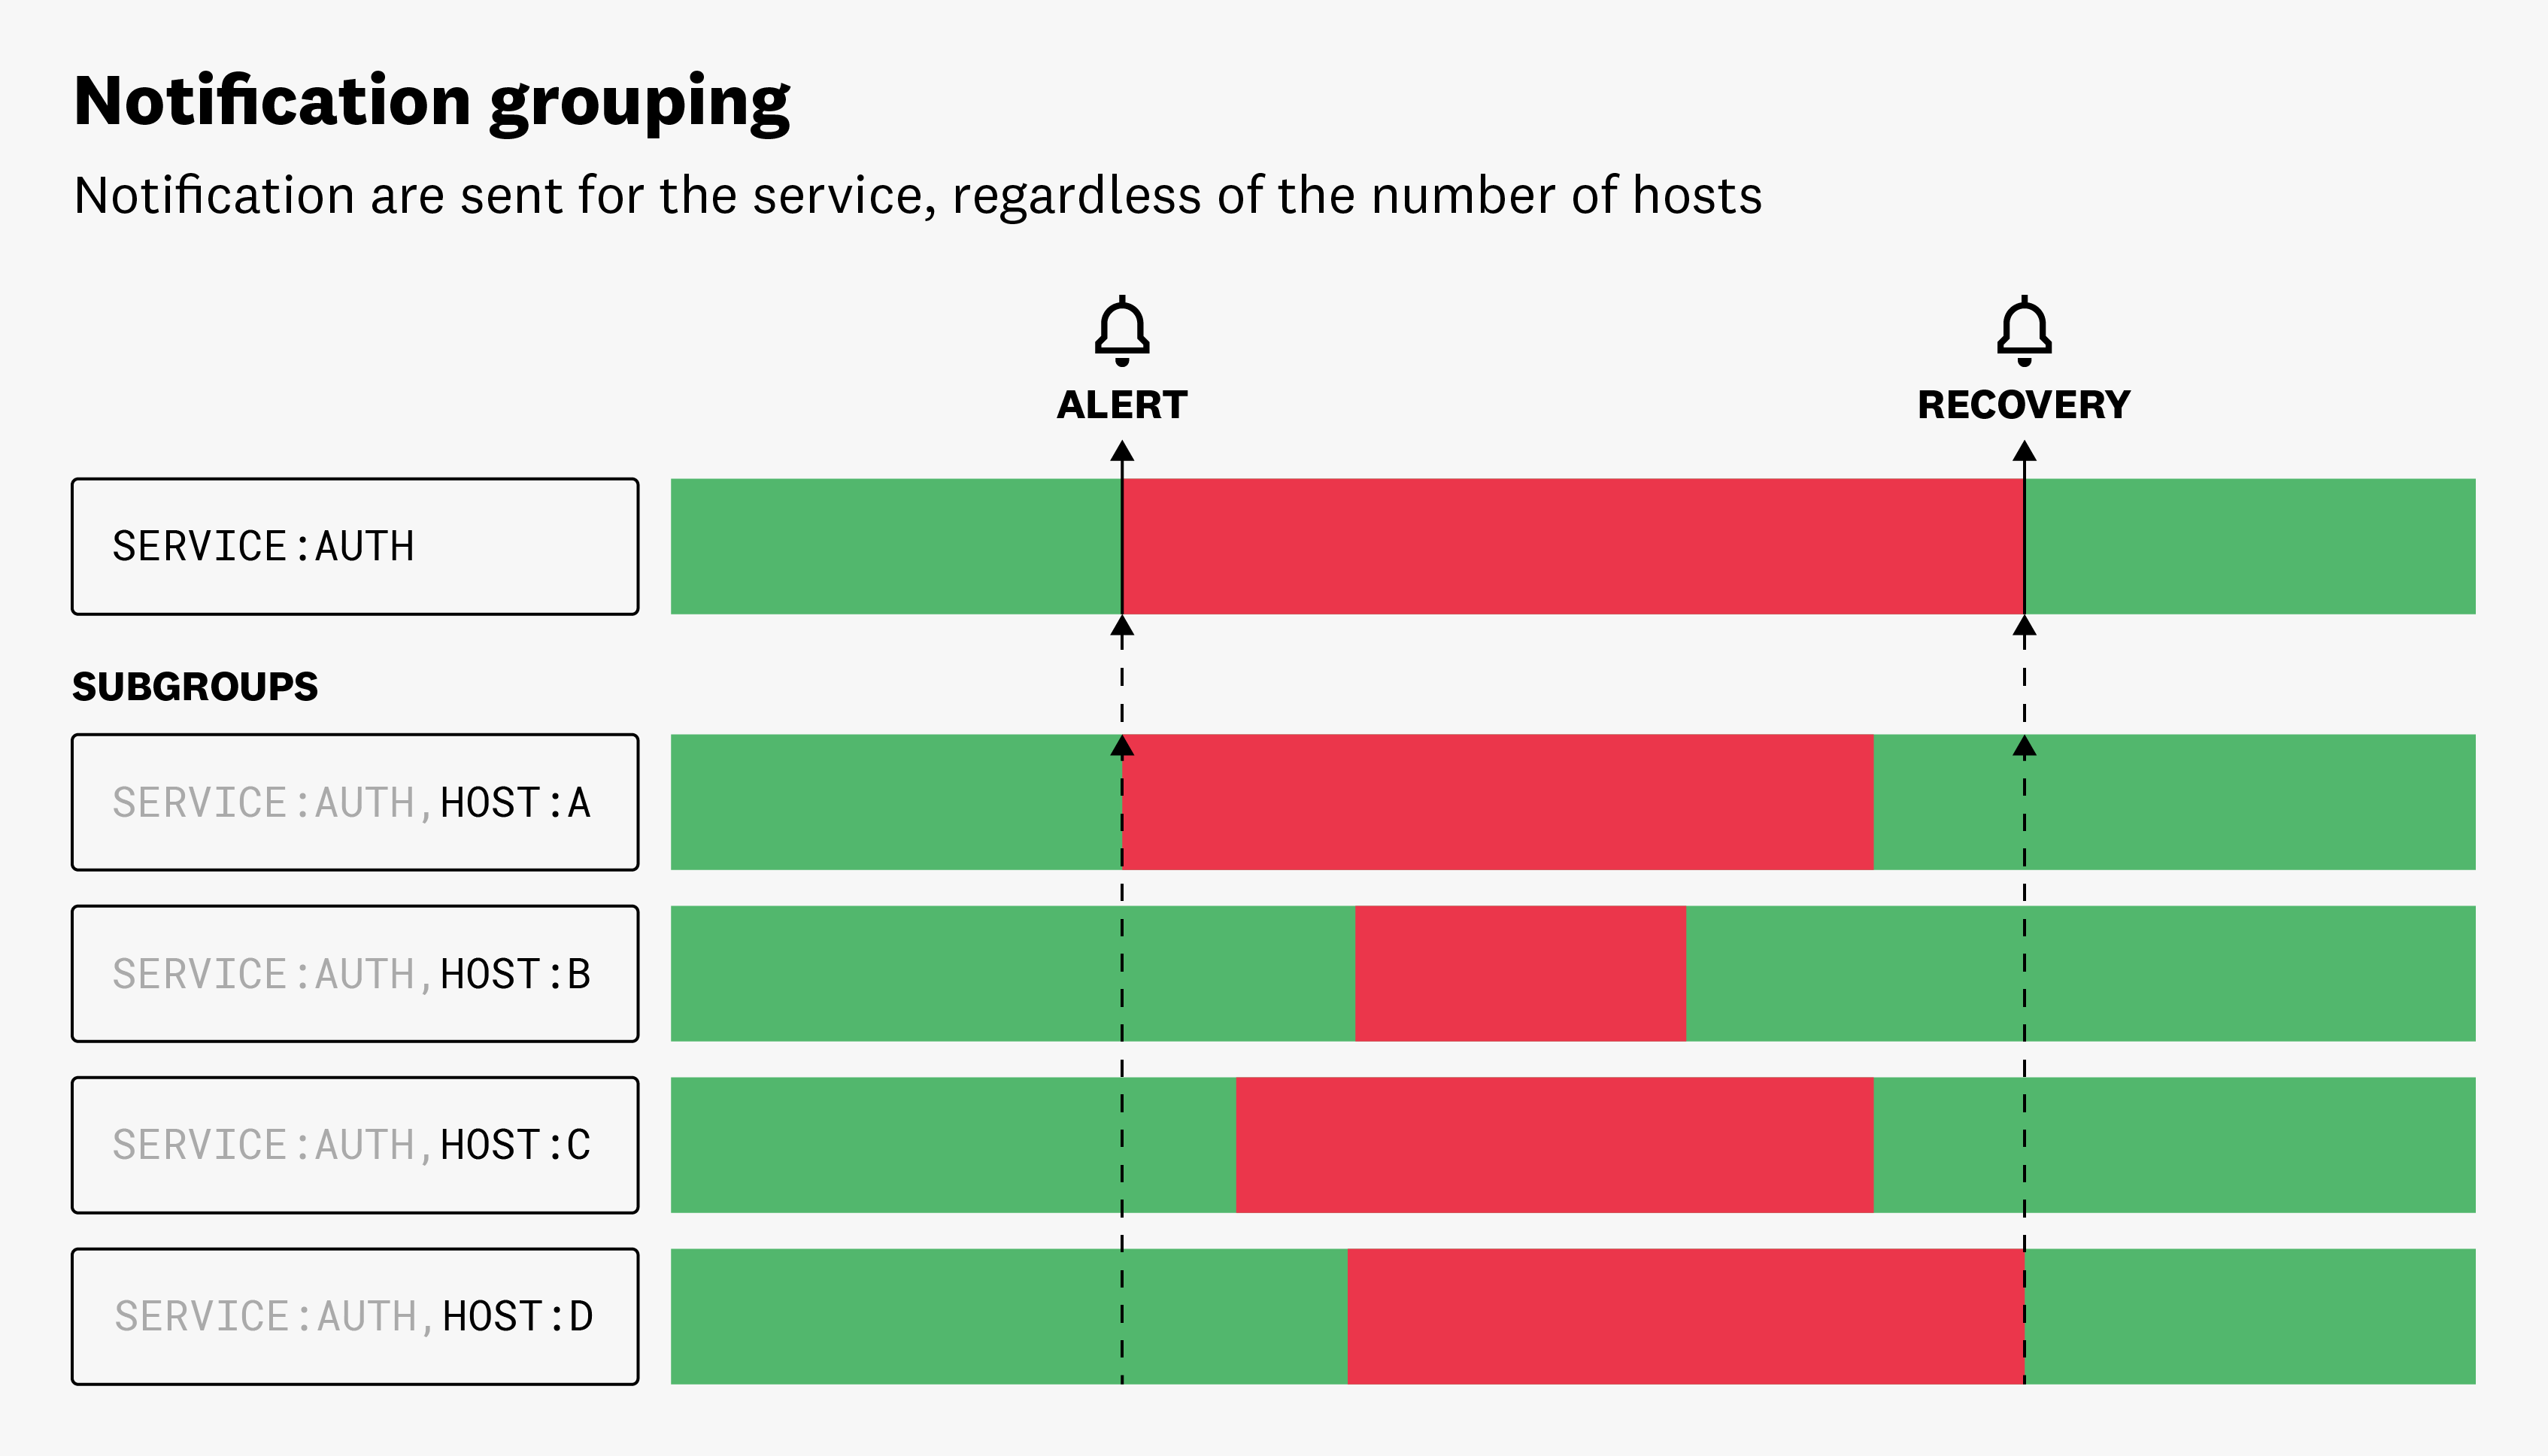
When monitoring a large group of entities, multi alerts can lead to noisy monitors. To mitigate this, customize which dimensions trigger alerts. This reduces the noise and allows you to focus on the alerts that matter most. For instance, you are monitoring the average CPU usage of all your hosts. If you group your query by service and host but only want alerts to be sent once for each service attribute meeting the threshold, remove the host attribute from your multi alert options and reduce the number of notifications that are sent.
When aggregating notifications in Multi Alert mode, the dimensions that are not aggregated on become Sub Groups in the UI.
Note: If your metric is only reporting by host with no service tag, it is not detected by the monitor. Metrics with both host and service tags are detected by the monitor.
If you configure tags or dimensions in your query, these values are available for every group evaluated in the multi alert to dynamically fill in notifications with useful context. See Attribute and tag variables to learn how to reference tag values in the notification message.
| Group by | Simple alert mode | Multi alert mode |
|---|---|---|
| (everything) | One single group triggering one notification | N/A |
| 1 or more dimensions | One notification if one or more groups meet the alert conditions | One notification per group meeting the alert conditions |
Permissions
All users can view all monitors, regardless of the team or role they are associated with. By default, only users attached to roles with the Monitors Write permission can edit monitors. Datadog Admin Role and Datadog Standard Role have the Monitors Write permission by default. If your organization uses Custom Roles, other custom roles may have the Monitors Write permission. For more information on setting up RBAC for Monitors and migrating monitors from the locked setting to using role restrictions, see the guide on How to set up RBAC for Monitors.
You can further restrict your monitor by specifying a list of teams, roles, or users allowed to edit it. The monitor’s creator has edit rights on the monitor by default. Editing includes any updates to the monitor configuration, deleting the monitor, and muting the monitor for any amount of time.
Note: The limitations are applied both in the UI and API.
Granular access controls
Use granular access controls to limit the teams, roles, or users that can edit a monitor:
- While editing or configuring a monitor, find the Define permissions and audit notifications section.
- Click Edit Access.
- Click Restrict Access.
- The dialog box updates to show that members of your organization have Viewer access by default.
- Use the dropdown to select one or more teams, roles, or users that may edit the monitor.
- Click Add.
- The dialog box updates to show that the role you selected has the Editor permission.
- Click Done.
Note: To maintain your edit access to the monitor, the system requires you to include at least one role or team that you are a member of before saving.
To restore general access to a monitor with restricted access, follow the steps below:
- While viewing a monitor, click the More dropdown menu.
- Select Permissions.
- Click Restore Full Access.
- Click Save.
Further reading
Additional helpful documentation, links, and articles:
