- Essentials
- Getting Started
- Datadog
- Datadog Site
- DevSecOps
- Serverless for AWS Lambda
- Agent
- Integrations
- Containers
- Dashboards
- Monitors
- Logs
- APM Tracing
- Profiler
- Tags
- API
- Service Catalog
- Session Replay
- Continuous Testing
- Synthetic Monitoring
- Incident Management
- Database Monitoring
- Cloud Security Management
- Cloud SIEM
- Application Security Management
- Workflow Automation
- CI Visibility
- Test Visibility
- Test Impact Analysis
- Code Analysis
- Learning Center
- Support
- Glossary
- Standard Attributes
- Guides
- Agent
- Integrations
- OpenTelemetry
- Developers
- Authorization
- DogStatsD
- Custom Checks
- Integrations
- Create an Agent-based Integration
- Create an API Integration
- Create a Log Pipeline
- Integration Assets Reference
- Build a Marketplace Offering
- Create a Tile
- Create an Integration Dashboard
- Create a Recommended Monitor
- Create a Cloud SIEM Detection Rule
- OAuth for Integrations
- Install Agent Integration Developer Tool
- Service Checks
- IDE Plugins
- Community
- Guides
- Administrator's Guide
- API
- Datadog Mobile App
- CoScreen
- Cloudcraft
- In The App
- Dashboards
- Notebooks
- DDSQL Editor
- Sheets
- Monitors and Alerting
- Infrastructure
- Metrics
- Watchdog
- Bits AI
- Service Catalog
- API Catalog
- Error Tracking
- Service Management
- Infrastructure
- Application Performance
- APM
- Continuous Profiler
- Database Monitoring
- Data Streams Monitoring
- Data Jobs Monitoring
- Digital Experience
- Real User Monitoring
- Product Analytics
- Synthetic Testing and Monitoring
- Continuous Testing
- Software Delivery
- CI Visibility
- CD Visibility
- Test Optimization
- Code Analysis
- Quality Gates
- DORA Metrics
- Security
- Security Overview
- Cloud SIEM
- Cloud Security Management
- Application Security Management
- AI Observability
- Log Management
- Observability Pipelines
- Log Management
- Administration
Imperva
Supported OS

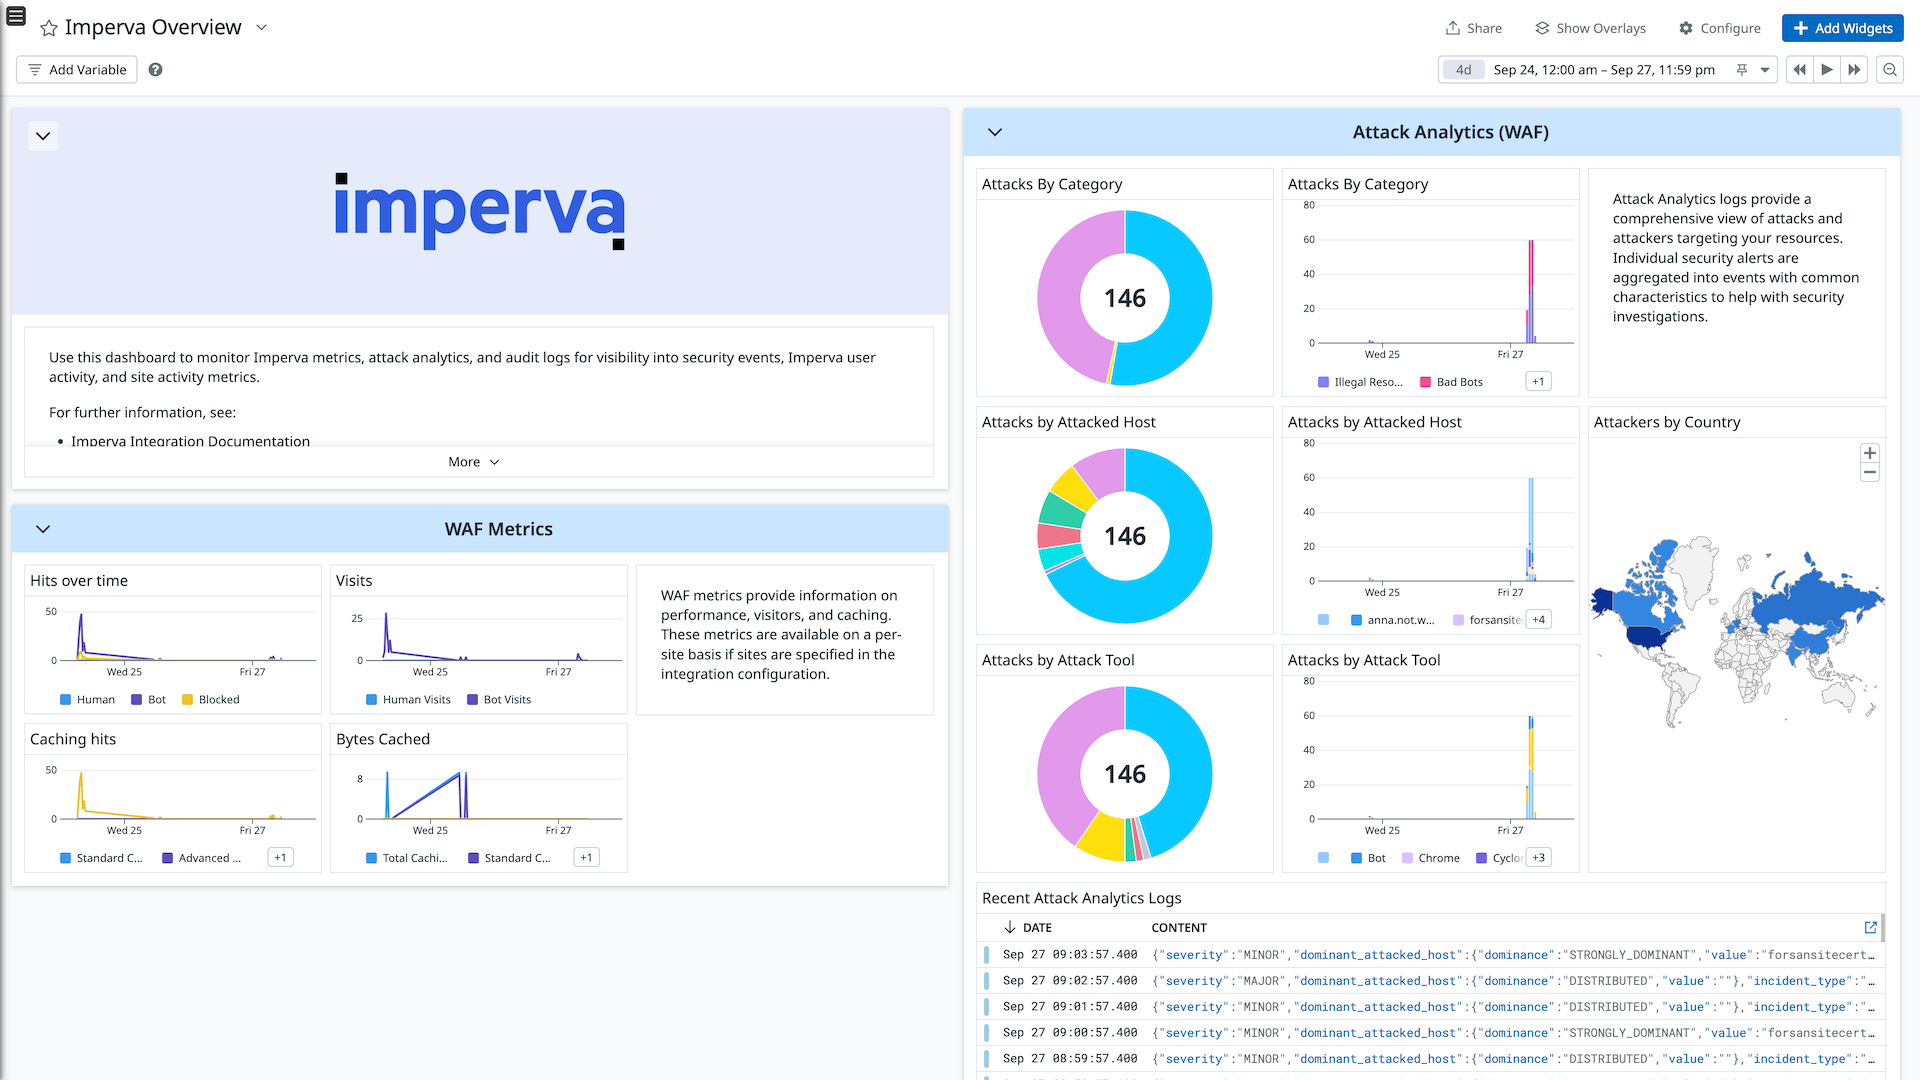
Imperva Dashboard
Overview
Imperva provides network and application security solutions to protect applications and APIs from attacks and monitor incidents. It also acts as a global Content Delivery Network (CDN) to cache pages and reduce bandwidth usage.
Datadog’s integration with Imperva collects logs and metrics from Imperva’s API, which generates:
Attack Analytics Logs These logs represent incidents of cyberattacks against your account, providing a comprehensive view of attacks and attackers targeting your resources. They are formed by aggregating and analyzing security alerts, then grouping them into security incidents.
Audit Trail Logs These logs contain actions performed in your account by account users, system processes, and Imperva system administrators and support.
Cloud Application Security Statistics Metrics These Web Application Firewall (WAF) metrics measure hits, visits, caching performance, and bandwidth usage for sites protected by Imperva.
Setup
Installation
Step 1: Get your Imperva API Key and API ID
- Log in to your Imperva account at https://management.service.imperva.com/ then click Account / My Profile
- At the bottom of the page, click Add API key and follow the instructions.
- After creating the API key, copy and save the API Key and API ID values.
- Make sure the Status field for your API key is set to Enabled.
Step 2: Get your Imperva Account ID
- In the Imperva console, choose the account to monitor.
- Click the Account button and copy the ID listed for the current account. This is the number in parentheses after the account name.
Step 3: Create the Datadog Integration
- Paste the Account ID, API ID and API Key into the fields below.
- Enter a name for the account.
Step 4 (Optional): Add Site IDs
To retrieve more granular per-site metrics, add Site IDs to your account.
- Retrieve the Site ID from the Imperva management console.
- Paste the Site ID and Site URL into the fields below.
- The Site ID and URL will be used to tag the Imperva metrics so that they can be filtered by site in Datadog.`}
Configuration
Validation
Once the integration is installed, your Imperva logs will be available for query within Datadog logs using source:imperva. Cloud Application Security Stats metrics will be available with the prefix imperva..
Data Collected
Metrics
| imperva.visits_human (count) | Human visits Shown as event |
| imperva.visits_bot (count) | Bot visits Shown as event |
| imperva.hits_human (count) | Human requests Shown as request |
| imperva.hits_human_per_second (rate) | Human requests per second Shown as request |
| imperva.hits_bot (count) | Bot requests Shown as request |
| imperva.hits_bot_per_second (rate) | Bot requests per second Shown as request |
| imperva.hits_blocked (count) | Blocked requests Shown as request |
| imperva.hits_blocked_per_second (rate) | Blocked requests per second Shown as request |
| imperva.caching_hits_standard (count) | Standard Requests Caching Shown as request |
| imperva.caching_bytes_standard (count) | Standard Bandwidth Caching Shown as byte |
| imperva.caching_hits_advanced (count) | Advanced Requests Caching Shown as request |
| imperva.caching_bytes_advanced (count) | Advanced Bandwidth Caching Shown as byte |
| imperva.caching_hits_total (count) | Total Requests Caching Shown as request |
| imperva.caching_bytes_total (count) | Total Bandwidth Caching Shown as byte |
| imperva.bandwidth_bandwidth (count) | Bandwidth Shown as byte |
| imperva.bandwidth_bits_per_second (rate) | Bits per second Shown as bit |
| imperva.incapsula_rule_incidents (count) | Incapsula Rule Incidents Shown as event |
Service Checks
Imperva does not include any service checks.
Events
Imperva does not include any events.
Logs
The Imperva integration collects audit logs and attack analytics logs.
Troubleshooting
Need help? Contact Datadog support.
