- Essentials
- Getting Started
- Datadog
- Datadog Site
- DevSecOps
- Serverless for AWS Lambda
- Agent
- Integrations
- Containers
- Dashboards
- Monitors
- Logs
- APM Tracing
- Profiler
- Tags
- API
- Service Catalog
- Session Replay
- Continuous Testing
- Synthetic Monitoring
- Incident Management
- Database Monitoring
- Cloud Security Management
- Cloud SIEM
- Application Security Management
- Workflow Automation
- CI Visibility
- Test Visibility
- Test Impact Analysis
- Code Analysis
- Learning Center
- Support
- Glossary
- Standard Attributes
- Guides
- Agent
- Integrations
- OpenTelemetry
- Developers
- Authorization
- DogStatsD
- Custom Checks
- Integrations
- Create an Agent-based Integration
- Create an API Integration
- Create a Log Pipeline
- Integration Assets Reference
- Build a Marketplace Offering
- Create a Tile
- Create an Integration Dashboard
- Create a Recommended Monitor
- Create a Cloud SIEM Detection Rule
- OAuth for Integrations
- Install Agent Integration Developer Tool
- Service Checks
- IDE Plugins
- Community
- Guides
- Administrator's Guide
- API
- Datadog Mobile App
- CoScreen
- Cloudcraft
- In The App
- Dashboards
- Notebooks
- DDSQL Editor
- Sheets
- Monitors and Alerting
- Infrastructure
- Metrics
- Watchdog
- Bits AI
- Service Catalog
- API Catalog
- Error Tracking
- Service Management
- Infrastructure
- Application Performance
- APM
- Continuous Profiler
- Database Monitoring
- Data Streams Monitoring
- Data Jobs Monitoring
- Digital Experience
- Real User Monitoring
- Product Analytics
- Synthetic Testing and Monitoring
- Continuous Testing
- Software Delivery
- CI Visibility
- CD Visibility
- Test Optimization
- Code Analysis
- Quality Gates
- DORA Metrics
- Security
- Security Overview
- Cloud SIEM
- Cloud Security Management
- Application Security Management
- AI Observability
- Log Management
- Observability Pipelines
- Log Management
- Administration
k6
Supported OS
Overview
k6 is an open-source load testing tool that helps you catch performance issues and regressions earlier.
With the k6 integration, you can track performance metrics of k6 tests to:
- Correlate application performance with load testing metrics.
- Create alerts based on performance testing metrics.
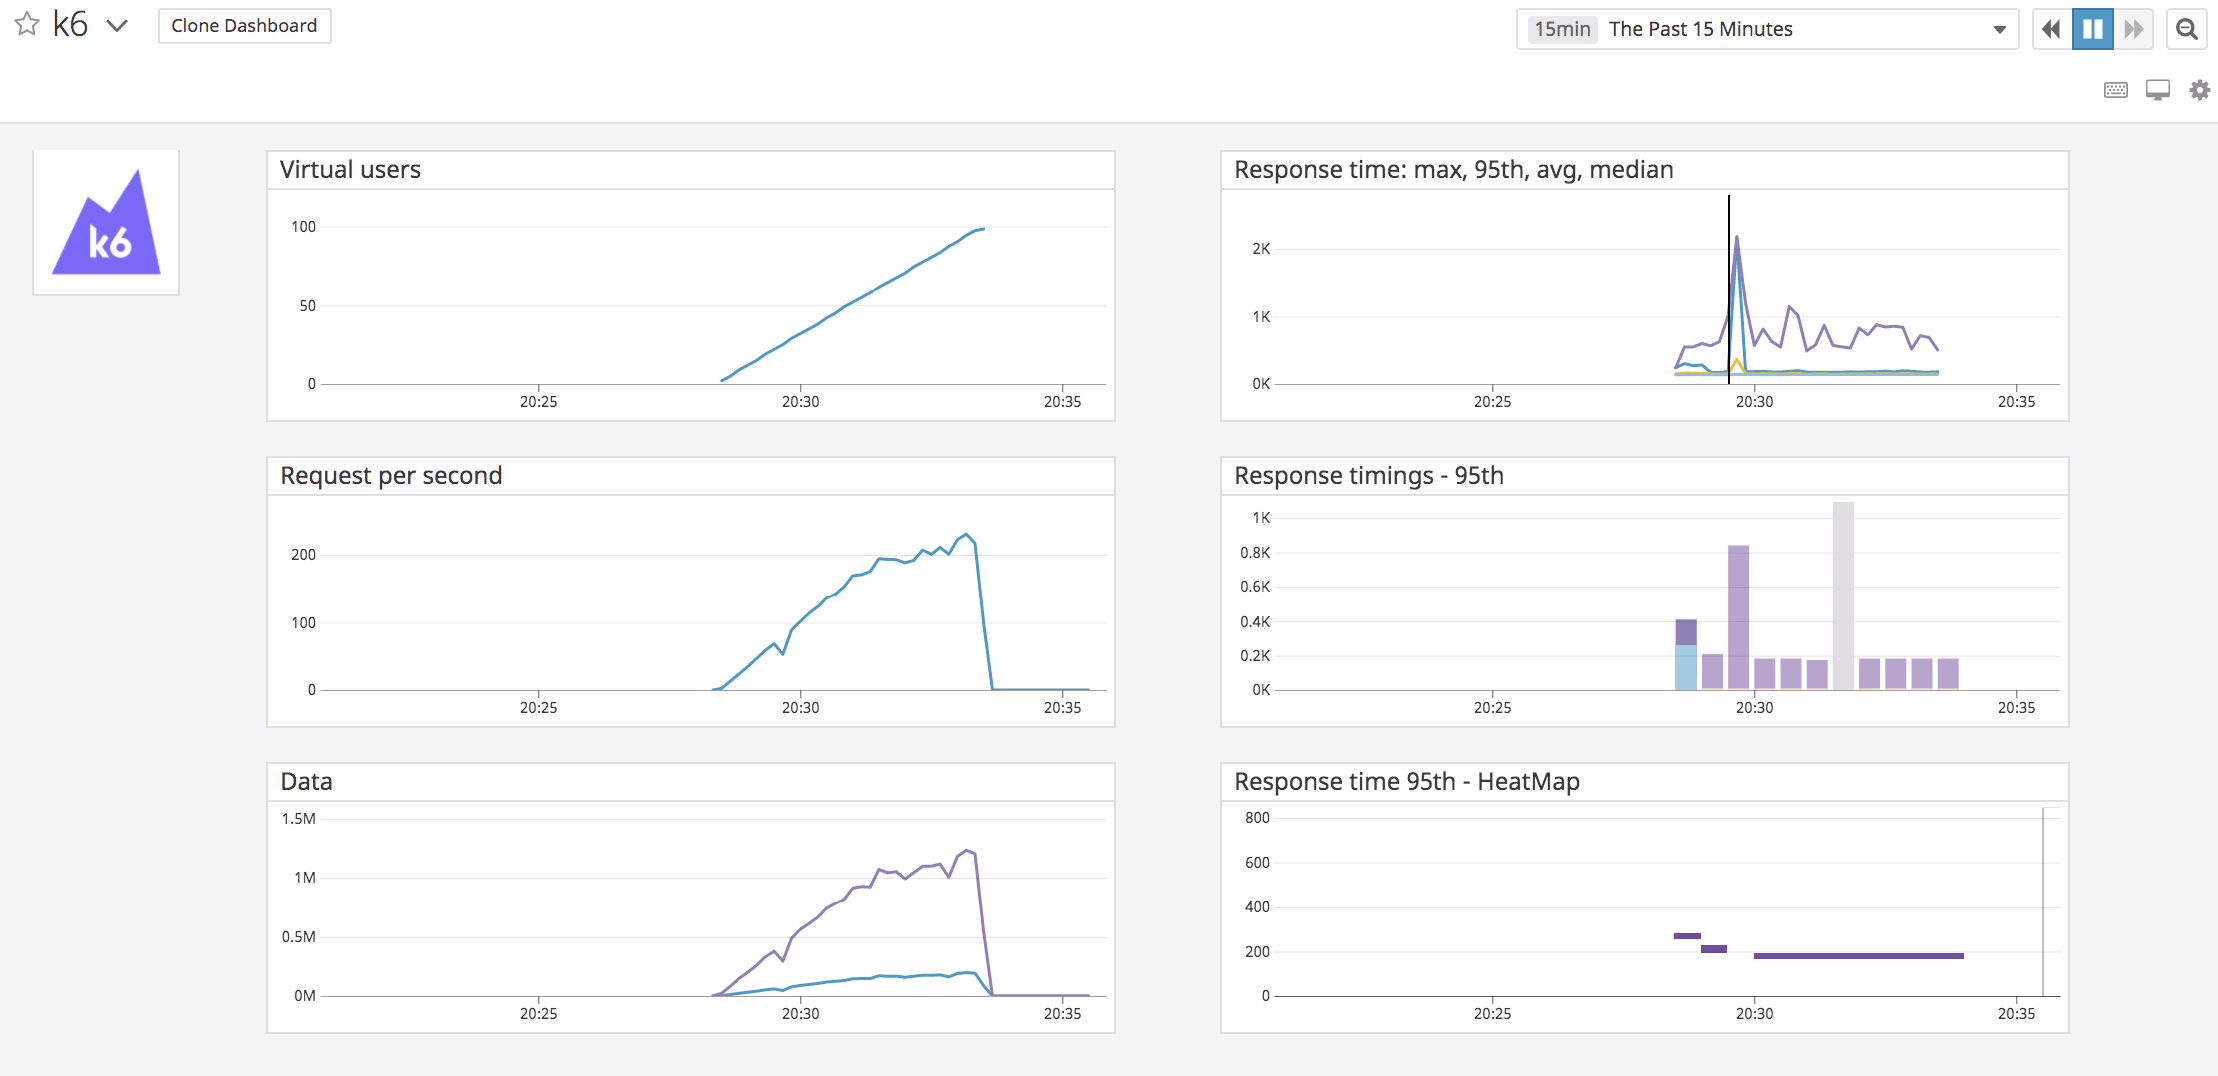
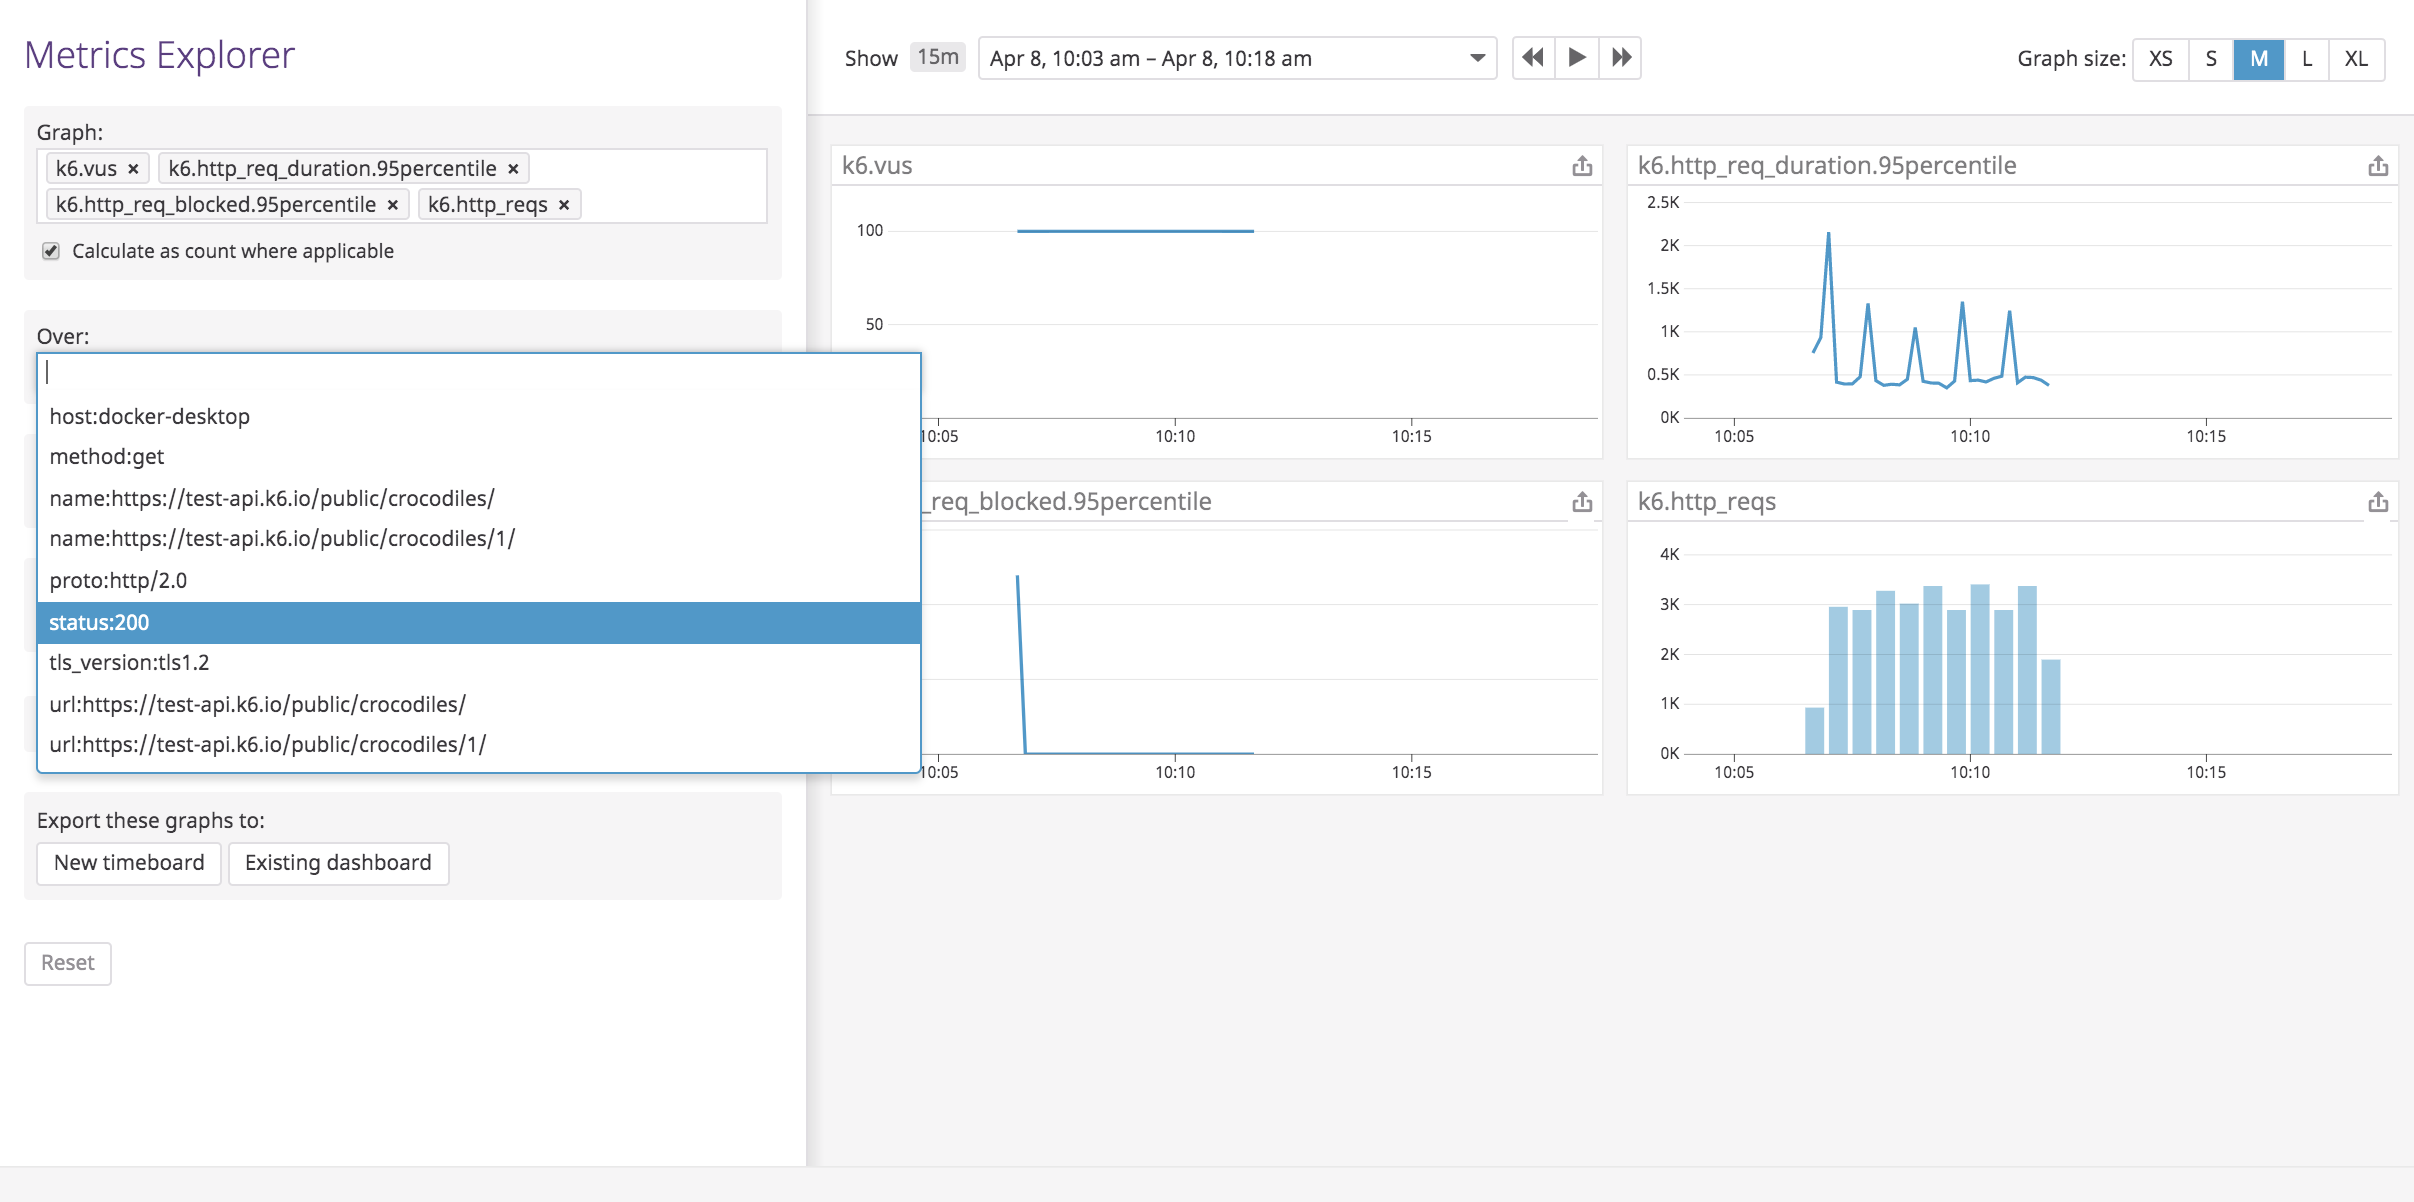
- Analyze and visualize k6 metrics using the k6 Datadog Dashboard or Metrics Explorer.

Setup
For the detailed instructions, follow the k6 documentation.
Installation
In Datadog, navigate to Integrations > API to copy your API key.
Run the Datadog Agent:
To get k6 metrics into Datadog, k6 sends metrics through the Datadog Agent, which collects, aggregates, and forwards the metrics to the Datadog platform.
Run the Datadog Agent service as a Docker container with this command:
DOCKER_CONTENT_TRUST=1 \ docker run -d \ --name datadog \ -v /var/run/docker.sock:/var/run/docker.sock:ro \ -v /proc/:/host/proc/:ro \ -v /sys/fs/cgroup/:/host/sys/fs/cgroup:ro \ -e DD_SITE="datadoghq.com" \ -e DD_API_KEY=<YOUR_DATADOG_API_KEY> \ -e DD_DOGSTATSD_NON_LOCAL_TRAFFIC=1 \ -p 8125:8125/udp \ datadog/agent:latestNote: Replace
<YOUR_DATADOG_API_KEY>with your API key. If your account is registered with Datadog EU, change the value ofDD_SITEtodatadoghq.eu.Run the k6 test and output the results to Datadog.
Once the Datadog Agent service is running, run the k6 test and send the metrics to the Agent with:
K6_STATSD_ENABLE_TAGS=true k6 run --out statsd script.jsVisualize the k6 metrics in Datadog.
While running the test, k6 sends metrics periodically to DataDog. By default, these metrics have
k6.as the name prefix.You can visualize k6 metrics in realtime with the metrics explorer, monitors, or custom dashboards.

Additionally, the first time Datadog detects the
k6.http_reqsmetric, the k6 integration tile is installed automatically, and the default k6 dashboard is added to your dashboard list.
Data Collected
Metrics
| k6.data_sent (count) | The amount of data sent Shown as byte |
| k6.data_received (count) | The amount of received data Shown as byte |
| k6.http_req_blocked.avg (gauge) | Average time spent blocked before initiating the request Shown as millisecond |
| k6.http_req_blocked.max (gauge) | Max time spent blocked before initiating the request Shown as millisecond |
| k6.http_req_blocked.median (gauge) | Median time spent blocked before initiating the request Shown as millisecond |
| k6.http_req_blocked.95percentile (gauge) | 95th time spent blocked before initiating the request Shown as millisecond |
| k6.http_req_blocked.99percentile (gauge) | 99th time spent blocked before initiating the request Shown as millisecond |
| k6.http_req_blocked.count (rate) | The number of httpreqblocked values submitted during the interval Shown as unit |
| k6.http_req_connecting.avg (gauge) | Average time spent establishing TCP connection Shown as millisecond |
| k6.http_req_connecting.max (gauge) | Max time spent establishing TCP connection Shown as millisecond |
| k6.http_req_connecting.median (gauge) | Median time spent establishing TCP connection Shown as millisecond |
| k6.http_req_connecting.95percentile (gauge) | 95th time spent blocked before initiating the request Shown as millisecond |
| k6.http_req_connecting.99percentile (gauge) | 99th time spent blocked before initiating the request Shown as millisecond |
| k6.http_req_connecting.count (rate) | The number of httpreqconnecting values submitted during the interval Shown as unit |
| k6.http_req_duration.avg (gauge) | Average request time Shown as millisecond |
| k6.http_req_duration.max (gauge) | Max request time Shown as millisecond |
| k6.http_req_duration.median (gauge) | Median request time Shown as millisecond |
| k6.http_req_duration.95percentile (gauge) | 95th request time Shown as millisecond |
| k6.http_req_duration.99percentile (gauge) | 99th request time Shown as millisecond |
| k6.http_req_duration.count (rate) | The number of httpreqduration values submitted during the interval Shown as unit |
| k6.http_reqs (count) | Total number of HTTP requests Shown as request |
| k6.http_req_receiving.avg (gauge) | Average time spent receiving response data Shown as millisecond |
| k6.http_req_receiving.max (gauge) | Max time spent receiving response data Shown as millisecond |
| k6.http_req_receiving.median (gauge) | Median time spent receiving response data Shown as millisecond |
| k6.http_req_receiving.95percentile (gauge) | 95th time spent receiving response data Shown as millisecond |
| k6.http_req_receiving.99percentile (gauge) | 99th time spent receiving response data Shown as millisecond |
| k6.http_req_receiving.count (rate) | The number of httpreqreceiving values submitted during the interval Shown as unit |
| k6.http_req_sending.avg (gauge) | Average time spent sending data Shown as millisecond |
| k6.http_req_sending.max (gauge) | Max time spent sending data Shown as millisecond |
| k6.http_req_sending.median (gauge) | Median time spent sending data Shown as millisecond |
| k6.http_req_sending.95percentile (gauge) | 95th time spent sending data Shown as millisecond |
| k6.http_req_sending.99percentile (gauge) | 99th time spent sending data Shown as millisecond |
| k6.http_req_sending.count (rate) | The number of httpreqsending values submitted during the interval Shown as unit |
| k6.http_req_tls_handshaking.avg (gauge) | Average time spent handshaking TLS session Shown as millisecond |
| k6.http_req_tls_handshaking.max (gauge) | Max time spent handshaking TLS session Shown as millisecond |
| k6.http_req_tls_handshaking.median (gauge) | Median time spent handshaking TLS session Shown as millisecond |
| k6.http_req_tls_handshaking.95percentile (gauge) | 95th time spent handshaking TLS session Shown as millisecond |
| k6.http_req_tls_handshaking.99percentile (gauge) | 99th time spent handshaking TLS session Shown as millisecond |
| k6.http_req_tls_handshaking.count (rate) | The number of httpreqtls_handshaking values submitted during the interval Shown as unit |
| k6.http_req_waiting.avg (gauge) | Average time spent waiting for response (TTFB) Shown as millisecond |
| k6.http_req_waiting.max (gauge) | Max time spent waiting for response (TTFB) Shown as millisecond |
| k6.http_req_waiting.median (gauge) | Median time spent waiting for response (TTFB) Shown as millisecond |
| k6.http_req_waiting.95percentile (gauge) | 95th time spent waiting for response (TTFB) Shown as millisecond |
| k6.http_req_waiting.99percentile (gauge) | 99th time spent waiting for response (TTFB) Shown as millisecond |
| k6.http_req_waiting.count (rate) | The number of httpreqwaiting values submitted during the interval Shown as unit |
| k6.iteration_duration.avg (gauge) | Average time spent for a VU iteration Shown as millisecond |
| k6.iteration_duration.max (gauge) | Max time spent for a VU iteration Shown as millisecond |
| k6.iteration_duration.median (gauge) | Median time spent for a VU iteration Shown as millisecond |
| k6.iteration_duration.95percentile (gauge) | 95th time spent for a VU iteration Shown as millisecond |
| k6.iteration_duration.99percentile (gauge) | 99th time spent for a VU iteration Shown as millisecond |
| k6.iteration_duration.count (rate) | The number of iteration_duration values submitted during the interval Shown as unit |
| k6.iterations (count) | Aggregated number of VU iterations Shown as unit |
| k6.vus (gauge) | Current number of active virtual users Shown as user |
| k6.vus_max (gauge) | Max possible number of virtual users Shown as user |
Service Checks
The k6 integration does not include any service checks.
Events
The k6 integration does not include any events.
Troubleshooting
Need help? Read the k6 Datadog documentation or contact k6 support.
