- Essentials
- Getting Started
- Datadog
- Datadog Site
- DevSecOps
- Serverless for AWS Lambda
- Agent
- Integrations
- Containers
- Dashboards
- Monitors
- Logs
- APM Tracing
- Profiler
- Tags
- API
- Service Catalog
- Session Replay
- Continuous Testing
- Synthetic Monitoring
- Incident Management
- Database Monitoring
- Cloud Security Management
- Cloud SIEM
- Application Security Management
- Workflow Automation
- CI Visibility
- Test Visibility
- Test Impact Analysis
- Code Analysis
- Learning Center
- Support
- Glossary
- Standard Attributes
- Guides
- Agent
- Integrations
- OpenTelemetry
- Developers
- Authorization
- DogStatsD
- Custom Checks
- Integrations
- Create an Agent-based Integration
- Create an API Integration
- Create a Log Pipeline
- Integration Assets Reference
- Build a Marketplace Offering
- Create a Tile
- Create an Integration Dashboard
- Create a Recommended Monitor
- Create a Cloud SIEM Detection Rule
- OAuth for Integrations
- Install Agent Integration Developer Tool
- Service Checks
- IDE Plugins
- Community
- Guides
- Administrator's Guide
- API
- Datadog Mobile App
- CoScreen
- Cloudcraft
- In The App
- Dashboards
- Notebooks
- DDSQL Editor
- Sheets
- Monitors and Alerting
- Infrastructure
- Metrics
- Watchdog
- Bits AI
- Service Catalog
- API Catalog
- Error Tracking
- Service Management
- Infrastructure
- Application Performance
- APM
- Continuous Profiler
- Database Monitoring
- Data Streams Monitoring
- Data Jobs Monitoring
- Digital Experience
- Real User Monitoring
- Product Analytics
- Synthetic Testing and Monitoring
- Continuous Testing
- Software Delivery
- CI Visibility
- CD Visibility
- Test Optimization
- Code Analysis
- Quality Gates
- DORA Metrics
- Security
- Security Overview
- Cloud SIEM
- Cloud Security Management
- Application Security Management
- AI Observability
- Log Management
- Observability Pipelines
- Log Management
- Administration
Log Monitor
Overview
Logs are essential for security investigations, aiding in threat detection, compliance tracking, and security monitoring. Log Management systems correlate logs with observability data for rapid root cause detection. Log management also enables efficient troubleshooting, issue resolution, and security audits.
Once log management is enabled for your organization, you can create a logs monitor to alert you when a specified log type exceeds a user-defined threshold over a given period of time. The logs monitor only evaluates indexed logs.
Monitor creation
To create a log monitor in Datadog, use the main navigation: Monitors > New Monitor > Logs.
Note: There is a default limit of 1000 Log monitors per account. If you are encountering this limit, consider using multi alerts, or Contact Support.
Define the search query
As you define the search query, the graph above the search fields updates.
Construct a search query using the same logic as a Log Explorer search.
Choose to monitor over a log count, facet, an attribute, or measure:
- Monitor over a log count: Use the search bar (optional) and do not select an attribute or measure. Datadog evaluates the number of logs over a selected time frame, then compares it to the threshold conditions.
- Monitor over a facet or an attribute: If a an attribute is selected, the monitor alerts over the
Unique value countof the attribute. For example, if you have an attribute such asuser.email, the unique value count is the number of unique user emails. Any attribute can be used in a monitor, but only facets are shown in the autocompletion. - Monitor over measure: If a measure is selected, the monitor alerts over the numerical value of the log facet (similar to a metric monitor) and aggregation needs to be selected (
min,avg,sum,median,pc75,pc90,pc95,pc98,pc99, ormax).
Group logs by multiple dimensions (optional):
All logs matching the query are aggregated into groups based on the value of tags, attributes, and up to four facets. When there are multiple dimensions, the top values are determined according to the first dimension, then according to the second dimension within the top values of the first dimension, and so on up to the last dimension. Dimensions limit depends on the total number of dimension:
- 1 facet: 1000 top values
- 2 facets: 30 top values per facet (at most 900 groups)
- 3 facets: 10 top values per facet (at most 1000 groups)
- 4 facets: 5 top values per facet (at most 625 groups)
Configure the alerting grouping strategy (optional):
- Simple-Alert: Simple alerts aggregate over all reporting sources. You receive one alert when the aggregated value meets the set conditions. This works best to monitor a metric from a single host or the sum of a metric across many hosts. This strategy may be selected to reduce notification noise.
- Multi Alert: Multi alerts apply the alert to each source according to your group parameters. An alerting event is generated for each group that meets the set conditions. For example, you could group
system.disk.in_usebydeviceto receive a separate alert for each device that is running out of space.
Set alert conditions
Trigger when the query meets one of the following conditions compared to a threshold value:
aboveabove or equal tobelowbelow or equal toequal tonot equal to
No data and below alerts
NO DATA is a state given when no logs match the monitor query during the timeframe.
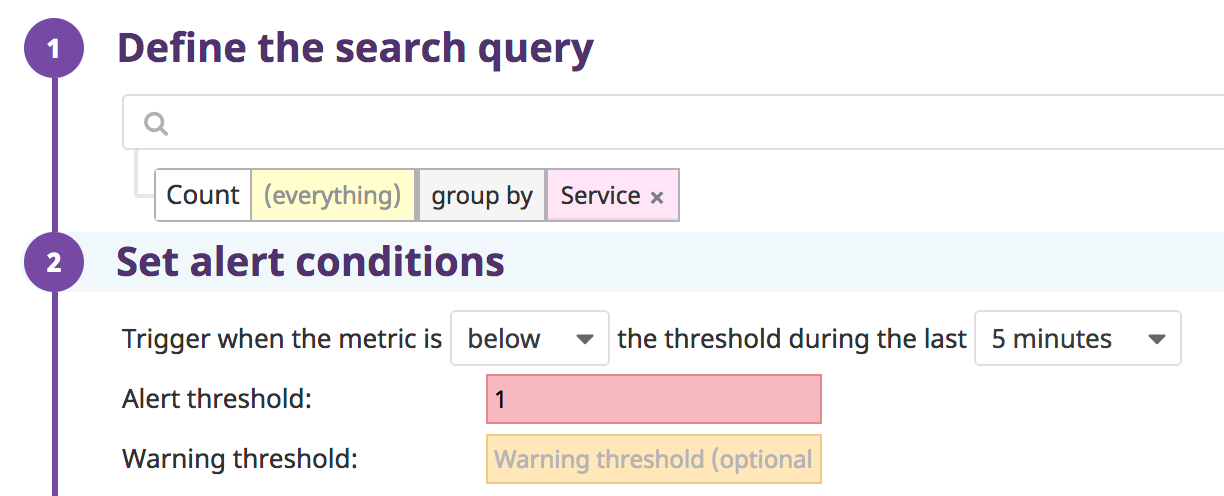
To receive a notification when all groups matching a specific query have stopped sending logs, set the condition to below 1. This notifies when no logs match the monitor query in a given timeframe across all aggregate groups.
When splitting the monitor by any dimension (tag or facet) and using a below condition, the alert is triggered if and only if there are logs for a given group, and the count is below the threshold—or if there are no logs for all of the groups.
Examples:
- This monitor triggers if and only if there are no logs for all services:
- This monitor triggers if there are no logs for the service
backend:
Advanced alert conditions
For detailed instructions on the advanced alert options (evaluation delay, new group delay, etc.), see the Monitor configuration page.
Notifications
For detailed instructions on the Configure notifications and automations section, see the Notifications page.
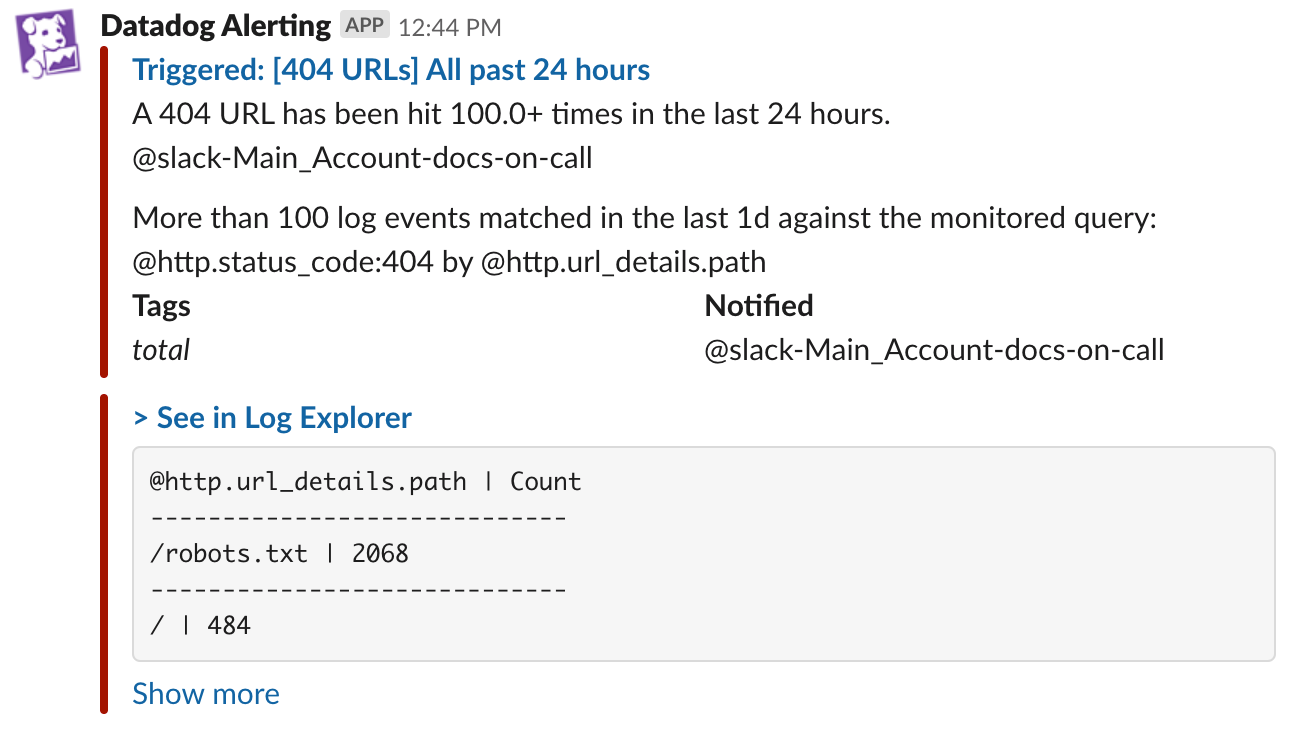
Log samples and breaching values toplist
When a logs monitor is triggered, samples or values can be added to the notification message. Logs without a message are not included in samples. In order to add the content of a log attribute to the monitor’s message, use Log monitor template variables directly in the monitor’s message body.
| Monitor Setup | Can be added to notification message |
|---|---|
| Ungrouped Simple-Alert Log count | Up to 10 log samples. |
| Grouped Simple-Alert Log count | Up to 10 facet or measure values. |
| Grouped Multi Alert Log count | Up to 10 log samples. |
| Ungrouped Simple-Alert measure | Up to 10 log samples. |
| Grouped Simple-Alert measure | Up to 10 facet or measure values. |
| Grouped Multi Alert Log measure | Up to 10 facet or measure values. |
These are available for notifications sent to Slack, Jira, webhooks, Microsoft Teams, Pagerduty, and email. Note: Samples are not displayed for recovery notifications.
To disable log samples, uncheck the box at the bottom of the Configure notification & automations section. The text next to the box is based on your monitor’s grouping (as stated above).
Examples
Include a table of the top 10 breaching values:
Include a sample of 10 logs in the alert notification:


