- Essentials
- Getting Started
- Datadog
- Datadog Site
- DevSecOps
- Serverless for AWS Lambda
- Agent
- Integrations
- Containers
- Dashboards
- Monitors
- Logs
- APM Tracing
- Profiler
- Tags
- API
- Service Catalog
- Session Replay
- Continuous Testing
- Synthetic Monitoring
- Incident Management
- Database Monitoring
- Cloud Security Management
- Cloud SIEM
- Application Security Management
- Workflow Automation
- CI Visibility
- Test Visibility
- Test Impact Analysis
- Code Analysis
- Learning Center
- Support
- Glossary
- Standard Attributes
- Guides
- Agent
- Integrations
- OpenTelemetry
- Developers
- Authorization
- DogStatsD
- Custom Checks
- Integrations
- Create an Agent-based Integration
- Create an API Integration
- Create a Log Pipeline
- Integration Assets Reference
- Build a Marketplace Offering
- Create a Tile
- Create an Integration Dashboard
- Create a Recommended Monitor
- Create a Cloud SIEM Detection Rule
- OAuth for Integrations
- Install Agent Integration Developer Tool
- Service Checks
- IDE Plugins
- Community
- Guides
- Administrator's Guide
- API
- Datadog Mobile App
- CoScreen
- Cloudcraft
- In The App
- Dashboards
- Notebooks
- DDSQL Editor
- Sheets
- Monitors and Alerting
- Infrastructure
- Metrics
- Watchdog
- Bits AI
- Service Catalog
- API Catalog
- Error Tracking
- Service Management
- Infrastructure
- Application Performance
- APM
- Continuous Profiler
- Database Monitoring
- Data Streams Monitoring
- Data Jobs Monitoring
- Digital Experience
- Real User Monitoring
- Product Analytics
- Synthetic Testing and Monitoring
- Continuous Testing
- Software Delivery
- CI Visibility
- CD Visibility
- Test Optimization
- Code Analysis
- Quality Gates
- DORA Metrics
- Security
- Security Overview
- Cloud SIEM
- Cloud Security Management
- Application Security Management
- AI Observability
- Log Management
- Observability Pipelines
- Log Management
- Administration
List View
Network Path for Datadog Network Performance Monitoring is not supported for your selected Datadog site ().
Network Path for Datadog Network Performance Monitoring is in Preview. Reach out to your Datadog representative to sign up.
Overview
The List View of Network Path is the default view for exploring various paths. Group by sources such as hostname and service.
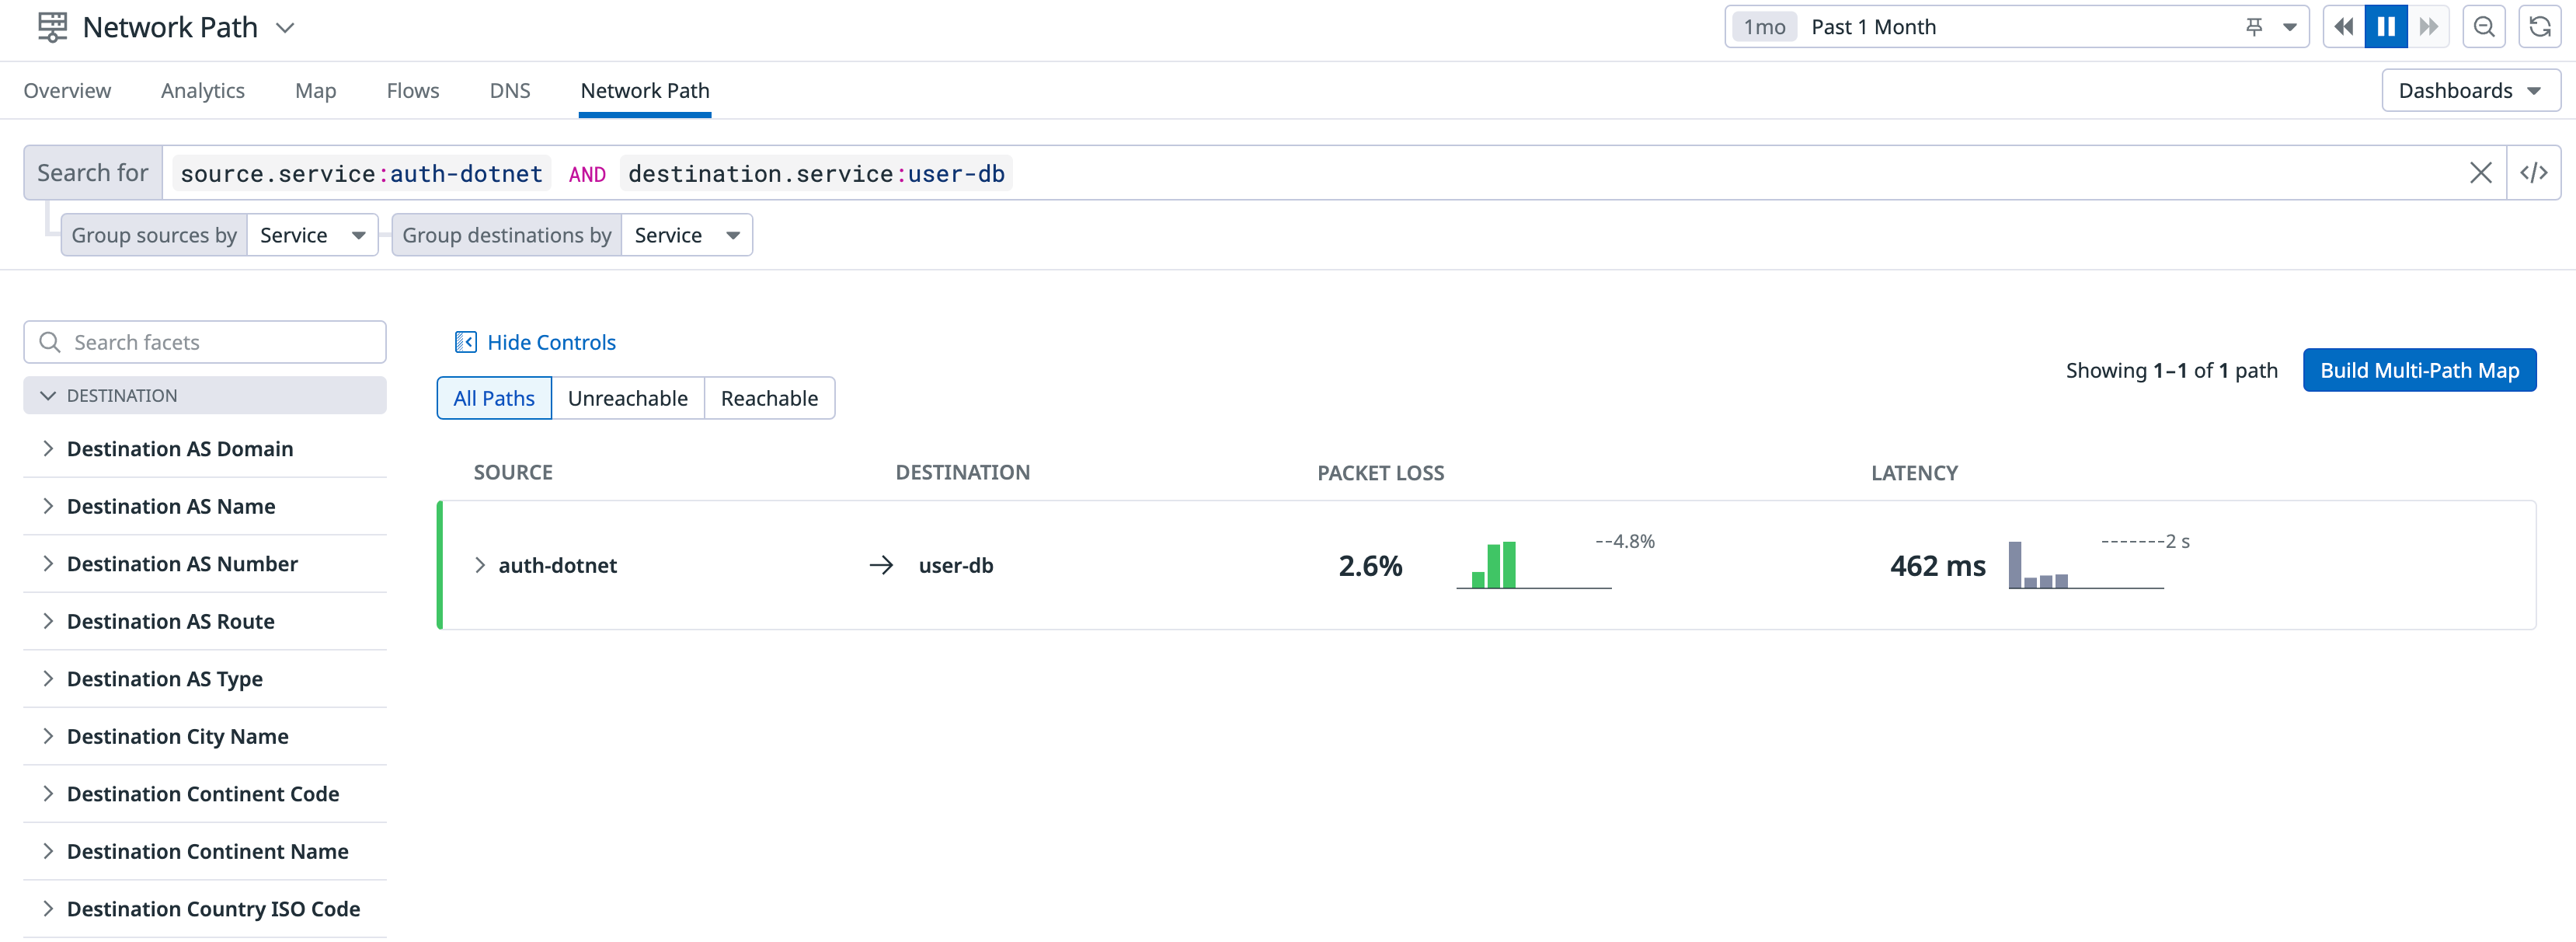
Use the search bar to search for specific endpoints, source, or destination locations.
For example, search by a specific source.service and destination.service to narrow your results:
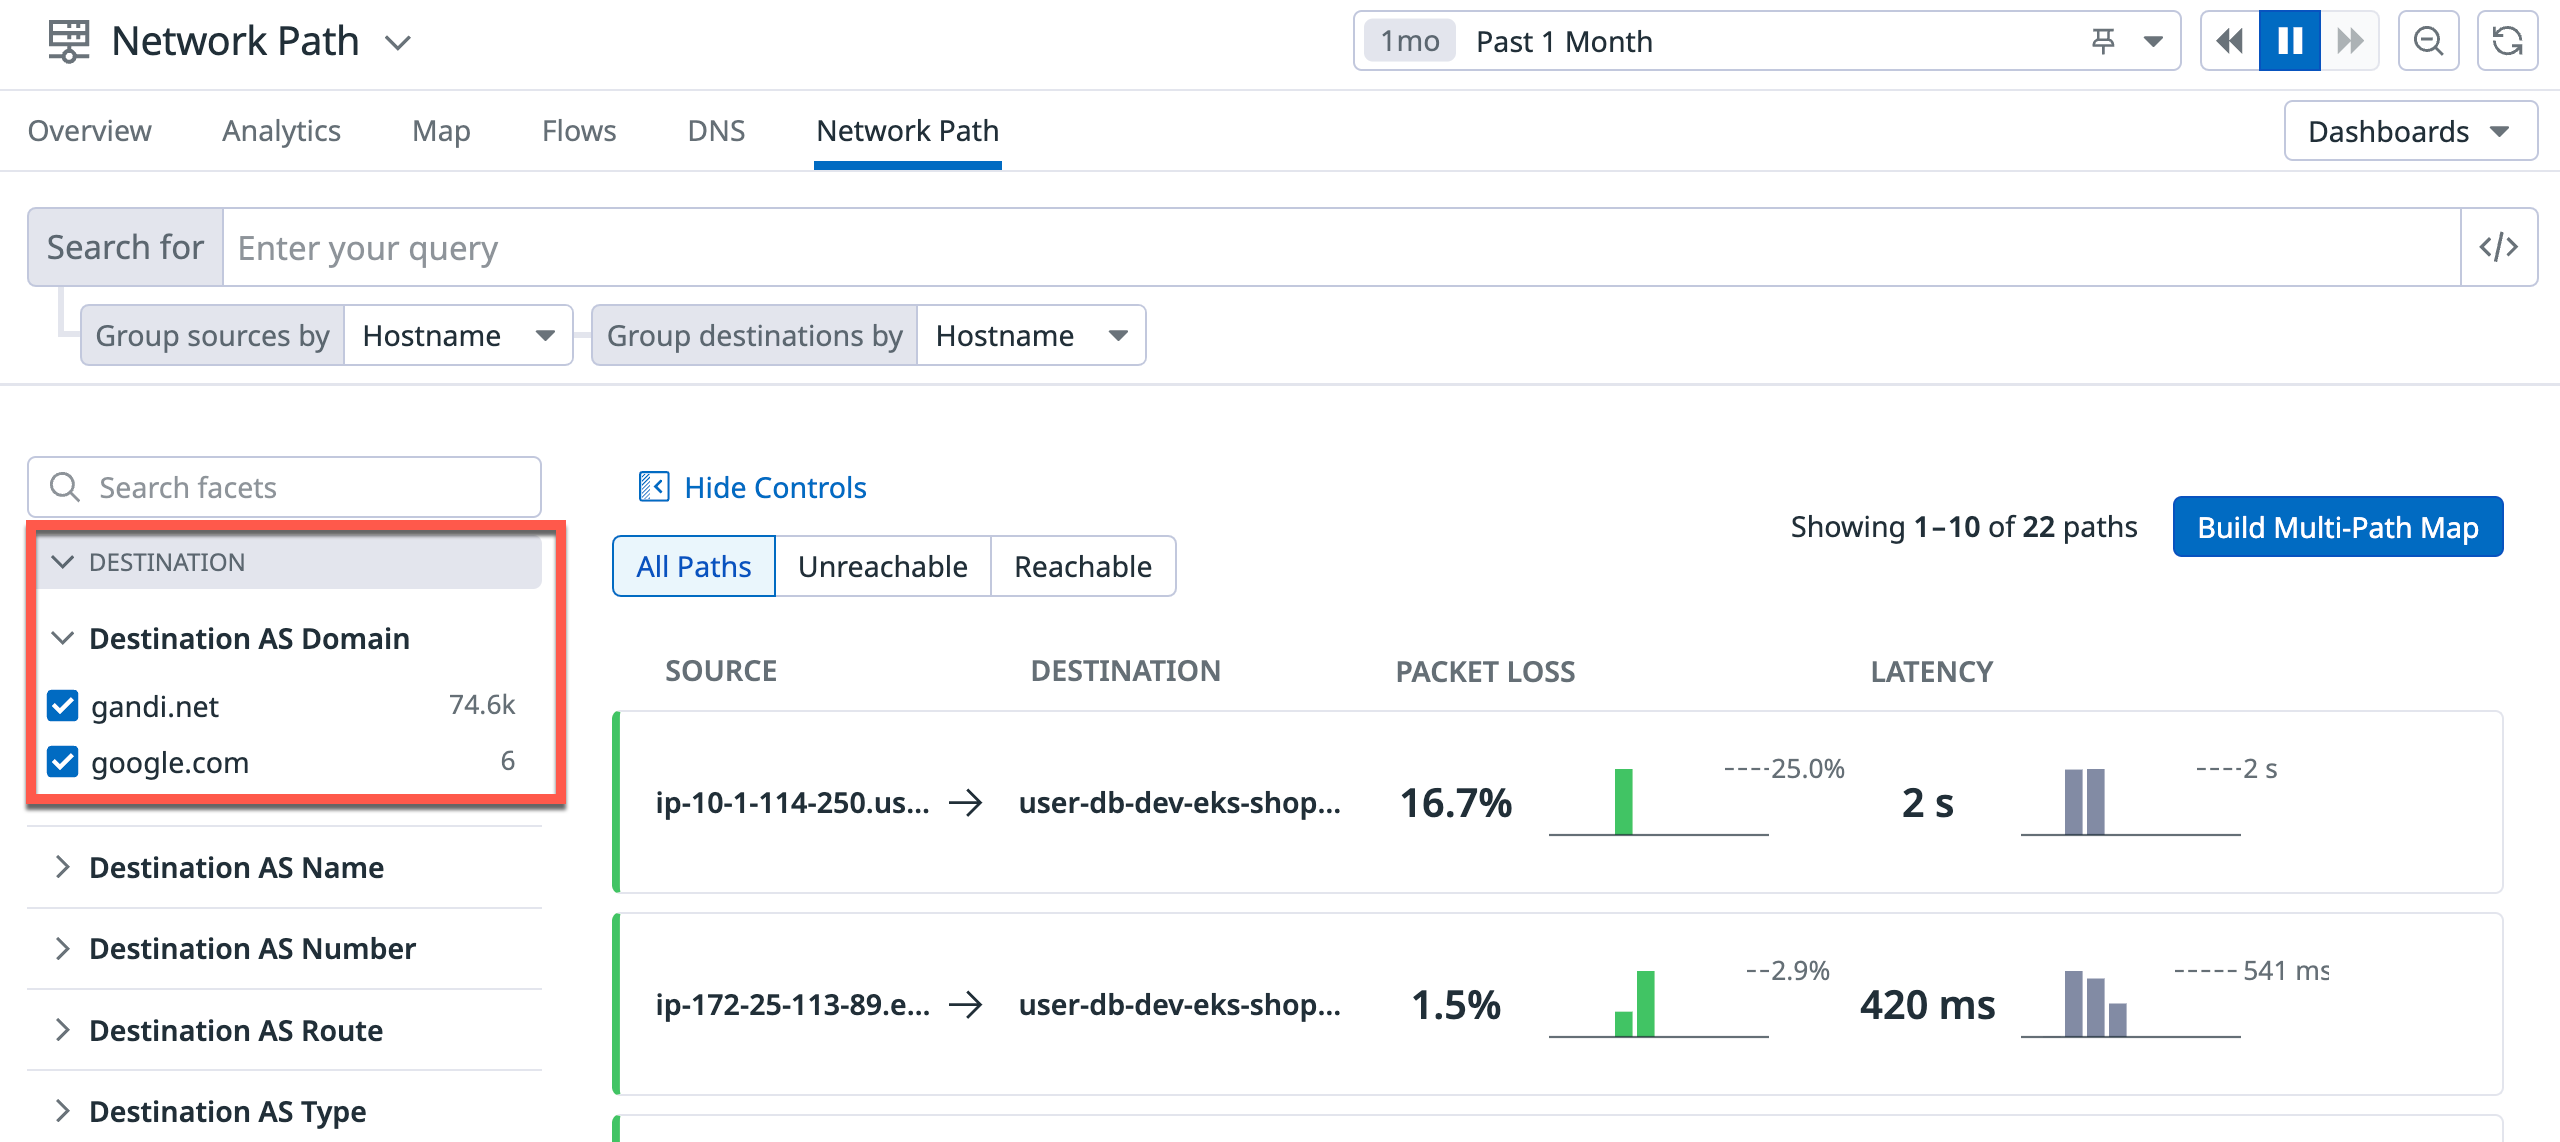
Additionally, search specific paths using the Destination and Source facet panels on the left hand side, such as Destination AS Name, Destination Service, or Source Hostname.
Filter controls
The top of the List View page also contains filter controls that can be used to give you a more granular search into the overall health of your network:
- Unreachable
- Filters to paths where the
traceroutehas not successfully reached the destination. This filter control can be useful to dive into a specific hop to determine where the failure is occurring. - Reachable
- Filters to paths where the
traceroutehas successfully reached the destination.
Multi-path map
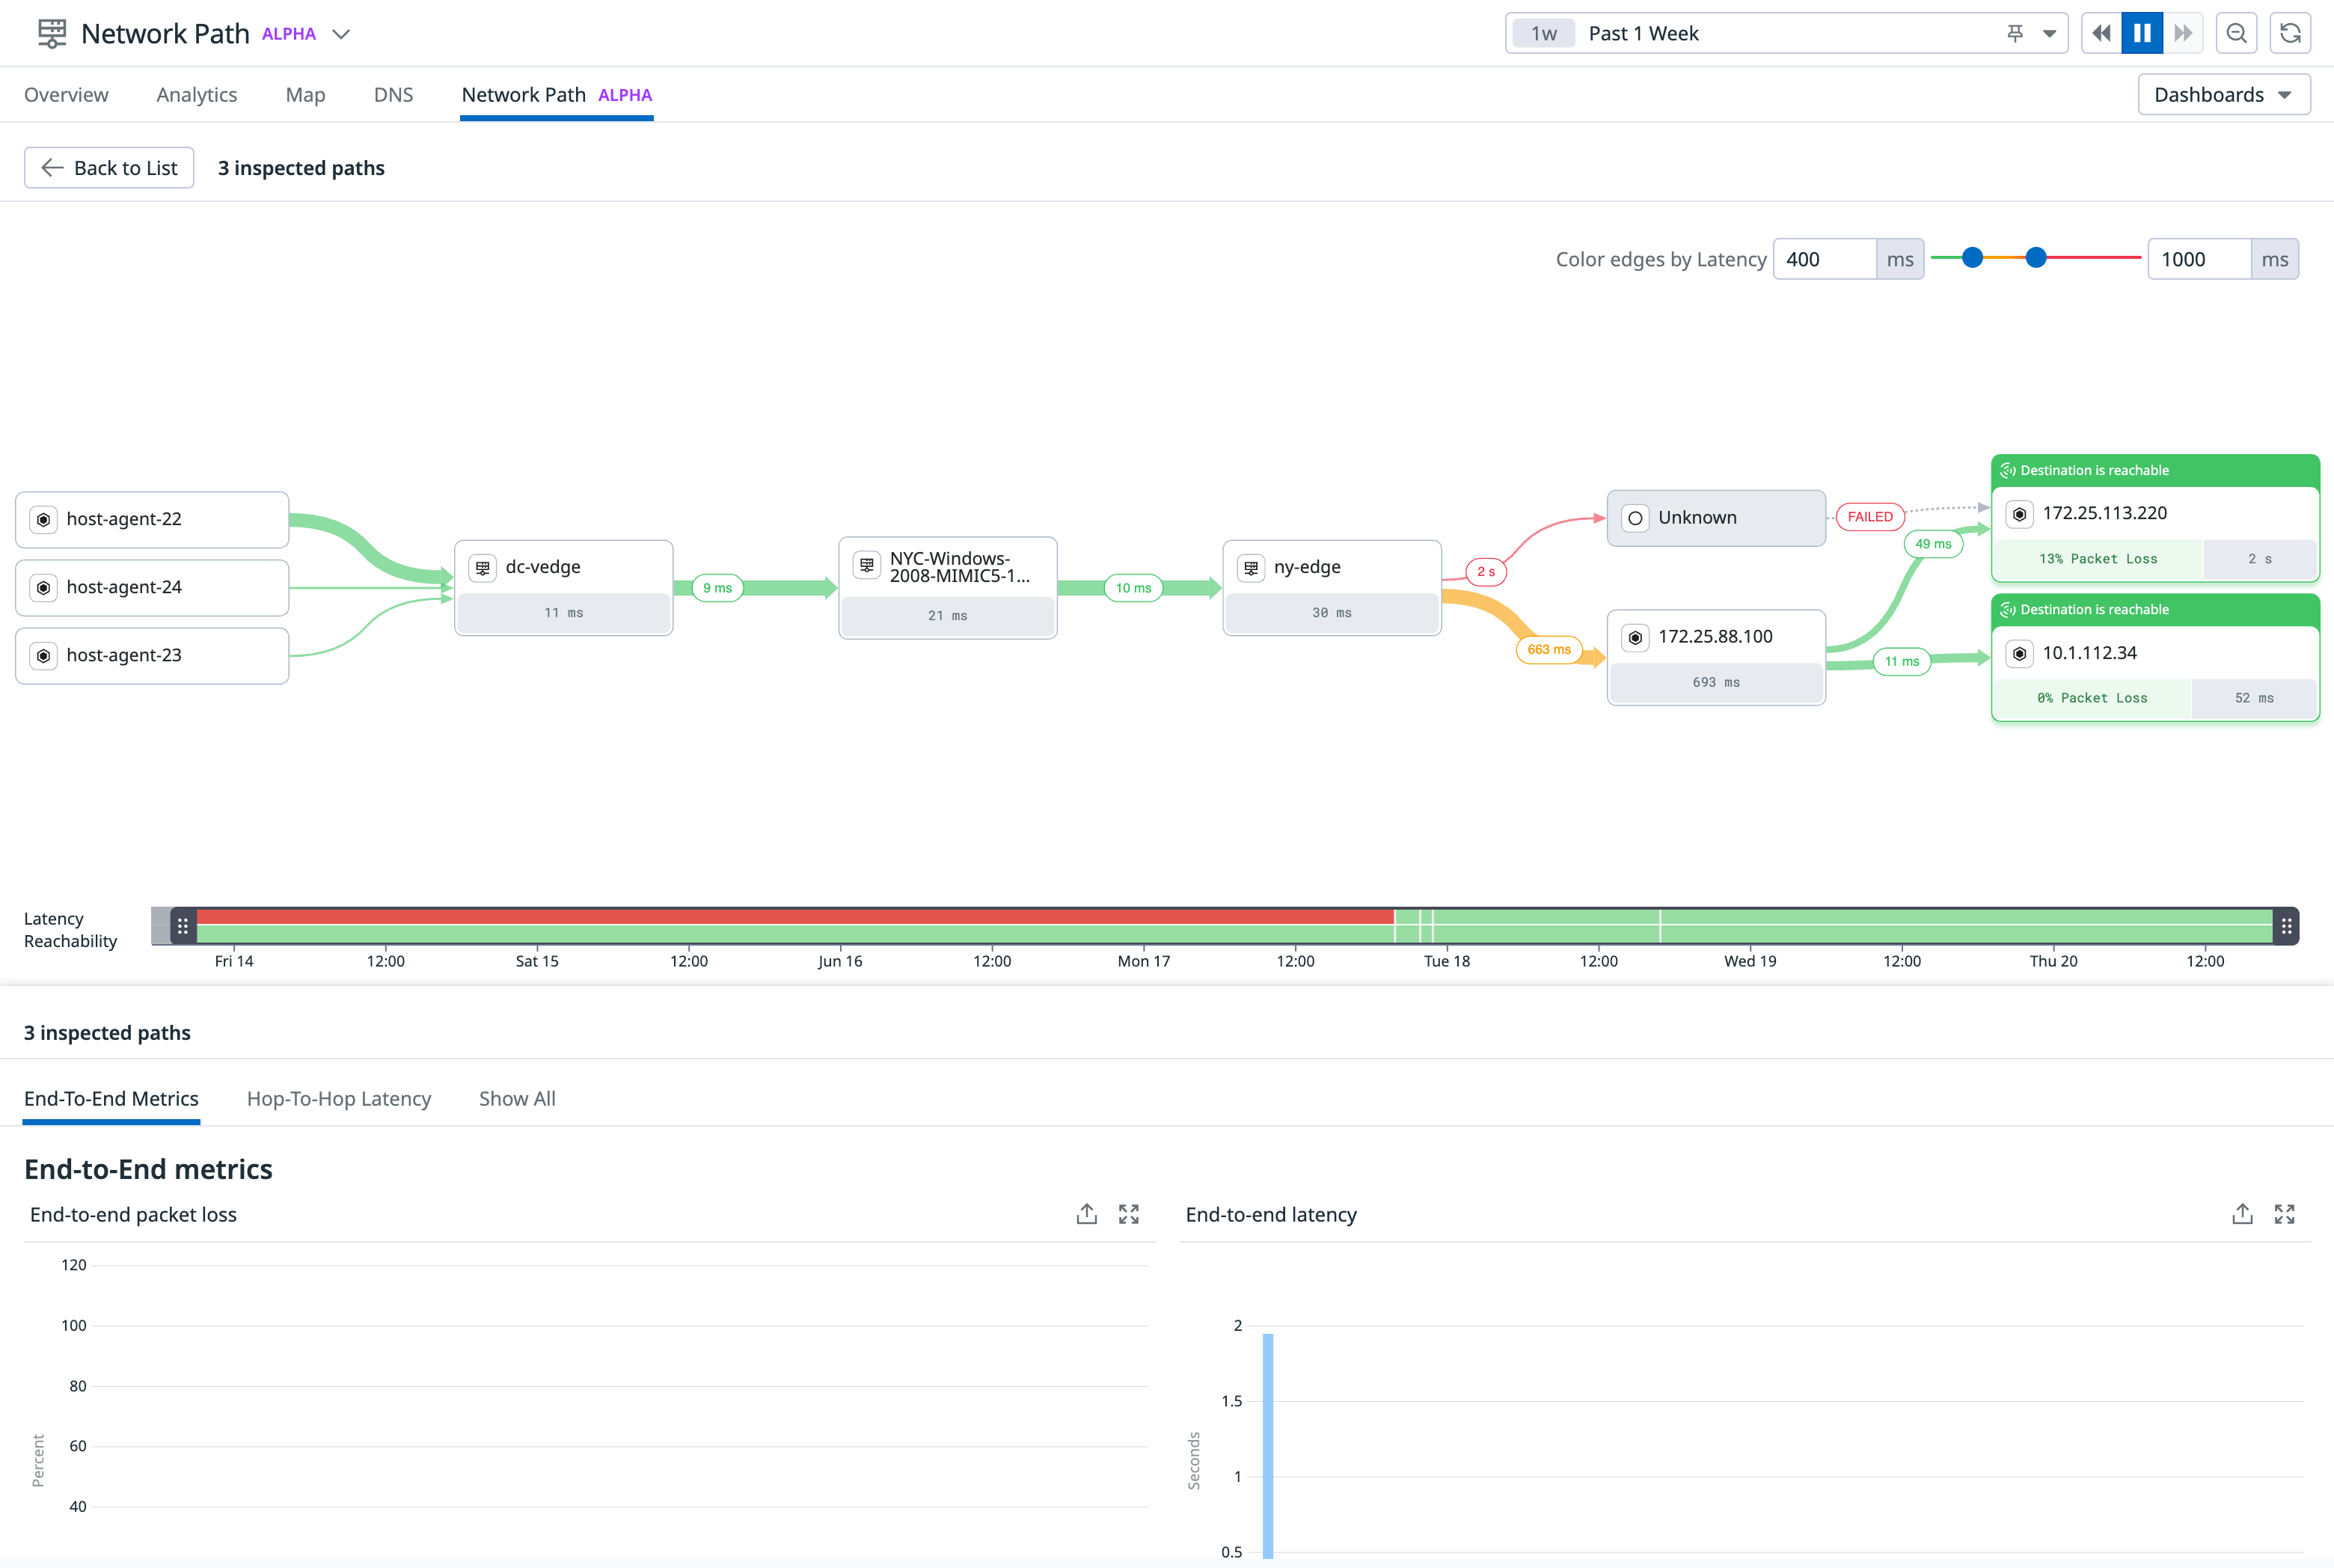
Use the Multi-path map button to build a path map based on one or more selected paths:
From this view, you can view the latency and reachability for the selected paths, as well as investigate end-to-end packet loss and hop-to-hop latency. For more information on this view, see the Path View documentation.
Further Reading
Additional helpful documentation, links, and articles:


