- Essentials
- Getting Started
- Datadog
- Datadog Site
- DevSecOps
- Serverless for AWS Lambda
- Agent
- Integrations
- Containers
- Dashboards
- Monitors
- Logs
- APM Tracing
- Profiler
- Tags
- API
- Service Catalog
- Session Replay
- Continuous Testing
- Synthetic Monitoring
- Incident Management
- Database Monitoring
- Cloud Security Management
- Cloud SIEM
- Application Security Management
- Workflow Automation
- CI Visibility
- Test Visibility
- Test Impact Analysis
- Code Analysis
- Learning Center
- Support
- Glossary
- Standard Attributes
- Guides
- Agent
- Integrations
- OpenTelemetry
- Developers
- Authorization
- DogStatsD
- Custom Checks
- Integrations
- Create an Agent-based Integration
- Create an API Integration
- Create a Log Pipeline
- Integration Assets Reference
- Build a Marketplace Offering
- Create a Tile
- Create an Integration Dashboard
- Create a Recommended Monitor
- Create a Cloud SIEM Detection Rule
- OAuth for Integrations
- Install Agent Integration Developer Tool
- Service Checks
- IDE Plugins
- Community
- Guides
- Administrator's Guide
- API
- Datadog Mobile App
- CoScreen
- Cloudcraft
- In The App
- Dashboards
- Notebooks
- DDSQL Editor
- Sheets
- Monitors and Alerting
- Infrastructure
- Metrics
- Watchdog
- Bits AI
- Service Catalog
- API Catalog
- Error Tracking
- Service Management
- Infrastructure
- Application Performance
- APM
- Continuous Profiler
- Database Monitoring
- Data Streams Monitoring
- Data Jobs Monitoring
- Digital Experience
- Real User Monitoring
- Product Analytics
- Synthetic Testing and Monitoring
- Continuous Testing
- Software Delivery
- CI Visibility
- CD Visibility
- Test Optimization
- Code Analysis
- Quality Gates
- DORA Metrics
- Security
- Security Overview
- Cloud SIEM
- Cloud Security Management
- Application Security Management
- AI Observability
- Log Management
- Observability Pipelines
- Log Management
- Administration
Monitor Your RUM Usage
Overview
The goal of this guide is to explain how to monitor your RUM usage with:
- The RUM estimated usage metric
- The RUM events stored under your account
This guide covers how to track the amount of RUM sessions priced under a specific SKU or application, alert on expected traffic spikes, and alert when you are getting close to a budget threshold on your sessions.
RUM usage metrics
This metric is free and available for 15 months.
By default, you can use the RUM datadog.estimated_usage.rum.sessions metric to track the number of user sessions with the following information:
- Application ID: Identifies the application available on the Application Overview page
- Service: Scope inside a RUM application belonging to a given team.
- Source: Which programming language or framework it is built with.
- SKU: Which paid plan the session is priced under.
Track count of sessions for an application
To track the count of sessions generated by a RUM application, navigate to the Dashboard List and select a dashboard to track your RUM usage trend.
- Click + Add Widgets to open the widgets and apps side panel.
- Select Timeseries under Graphs.
- In the Graph your data section, select Metrics and
datadog.estimated_usage.rum.sessionsfrom the dropdown menus. - In the
fromclause, select the application ID you are interested in tracking. The RUM application ID is available on its Application Overview page. - Set your display preferences and enter a name for your graph.
- Click Save.
Track count of sessions priced under a SKU
To track the count of sessions priced under a given RUM SKU, navigate to the Dashboard List and select a dashboard to track your RUM usage trend.
- Click + Add Widgets to open the widgets and apps side panel.
- Select Timeseries under Graphs.
- In the Graph your data section, select Metrics and
datadog.estimated_usage.rum.sessionsfrom the dropdown menus. - In the
sumclause, select theskutag from the dropdown menu. - Set your display preferences and enter a name for your graph.
- Click Save.
Alert on unexpected spikes
You can use the RUM metric in anomaly detection monitors.
To create an anomaly detection monitor to be alerted of unexpected session count spikes:
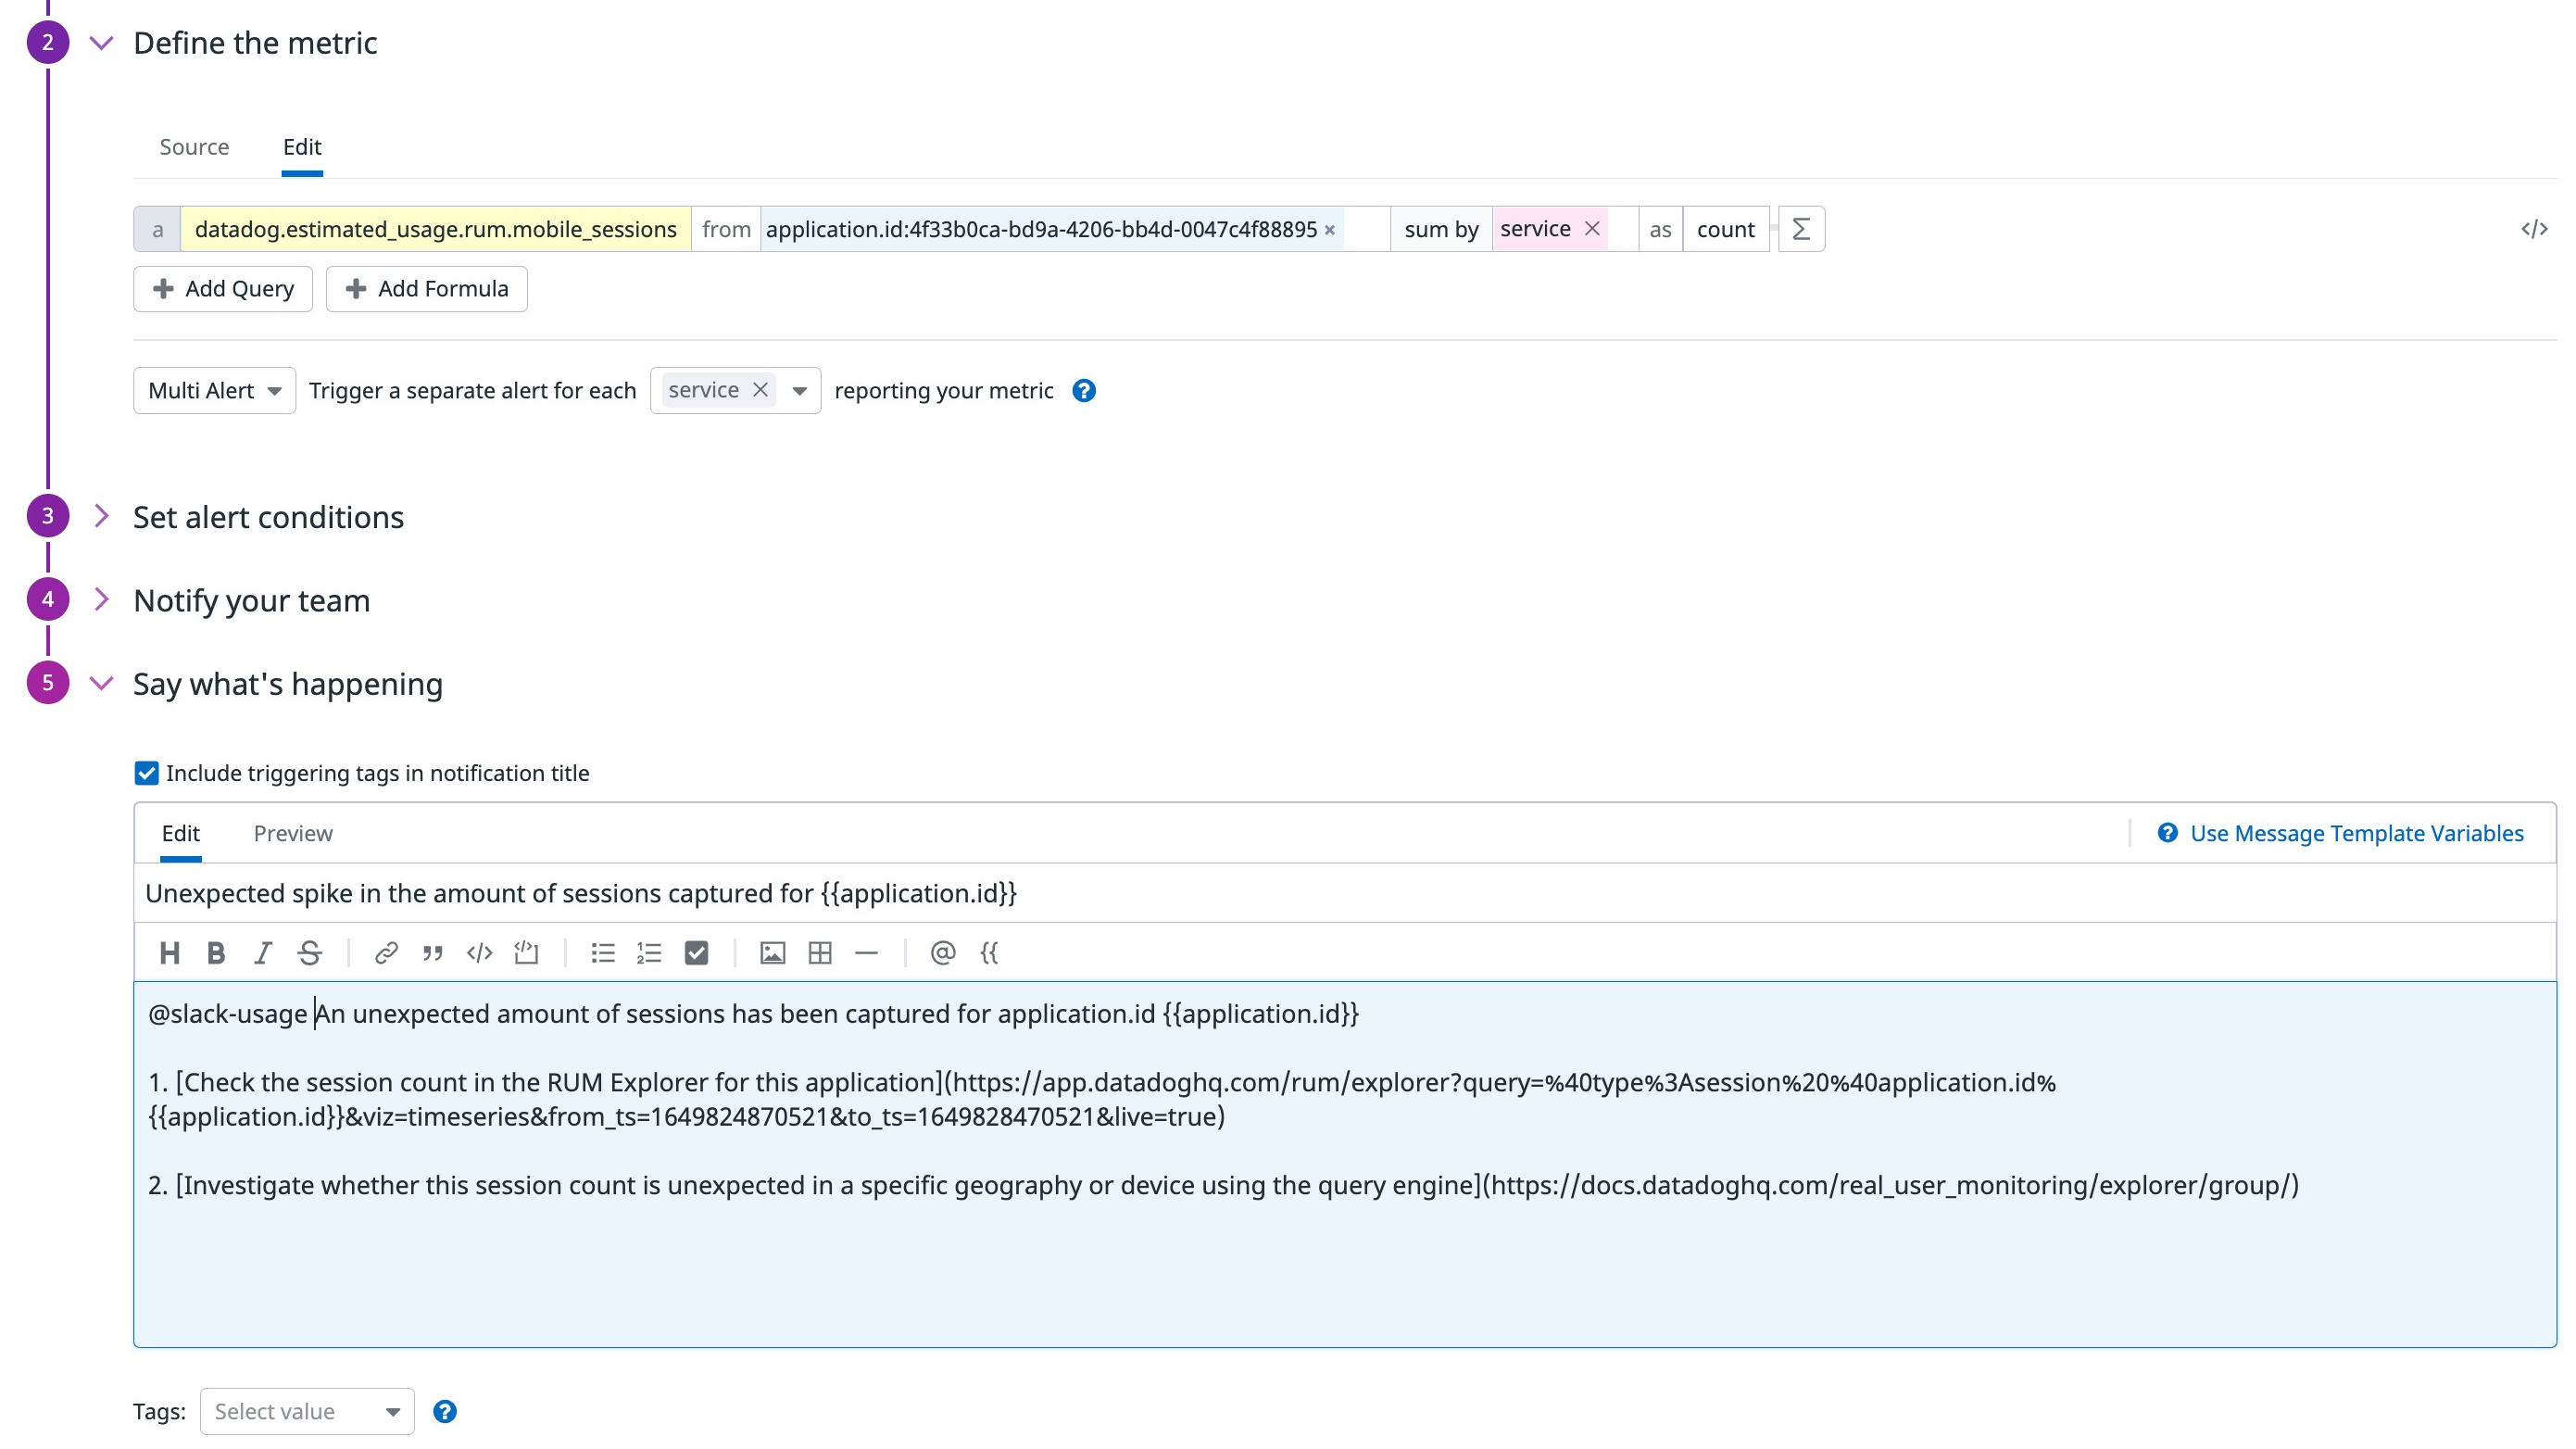
Go to your RUM application’s Application Overview page and copy the application ID.
Select the
datadog.estimated_usage.rum.sessionsmetric from the dropdown menu.In the
fromclause, enter theapplication.idto be notified if your RUM application has a traffic spike or stops sending events.Set the alert condition to match your use case, for example: an evaluation window or the number of times outside an expected range.
Set the notification message with actionable instructions.
This example notification message contains context links:
An unexpected amount of sessions has been captured for application.id {{application.id}}.

1. [Check the session count in the RUM Explorer for this application](https://app.datadoghq.com/rum/explorer?query=%40type%3Asession%20%40application.id%{{application.id}}&viz=timeseries&from_ts=1649824870521&to_ts=1649828470521&live=true).
2. [Investigate whether this session count is unexpected in a specific geography or device using the query engine](https://docs.datadoghq.com/real_user_monitoring/explorer/group/).
Set permissions and notification settings for this monitor.
Click Create.
Monitor RUM sessions with a fixed threshold
To create an anomaly detection monitor to be alerted when the number of sessions grows unexpectedly and is approaching a threshold:
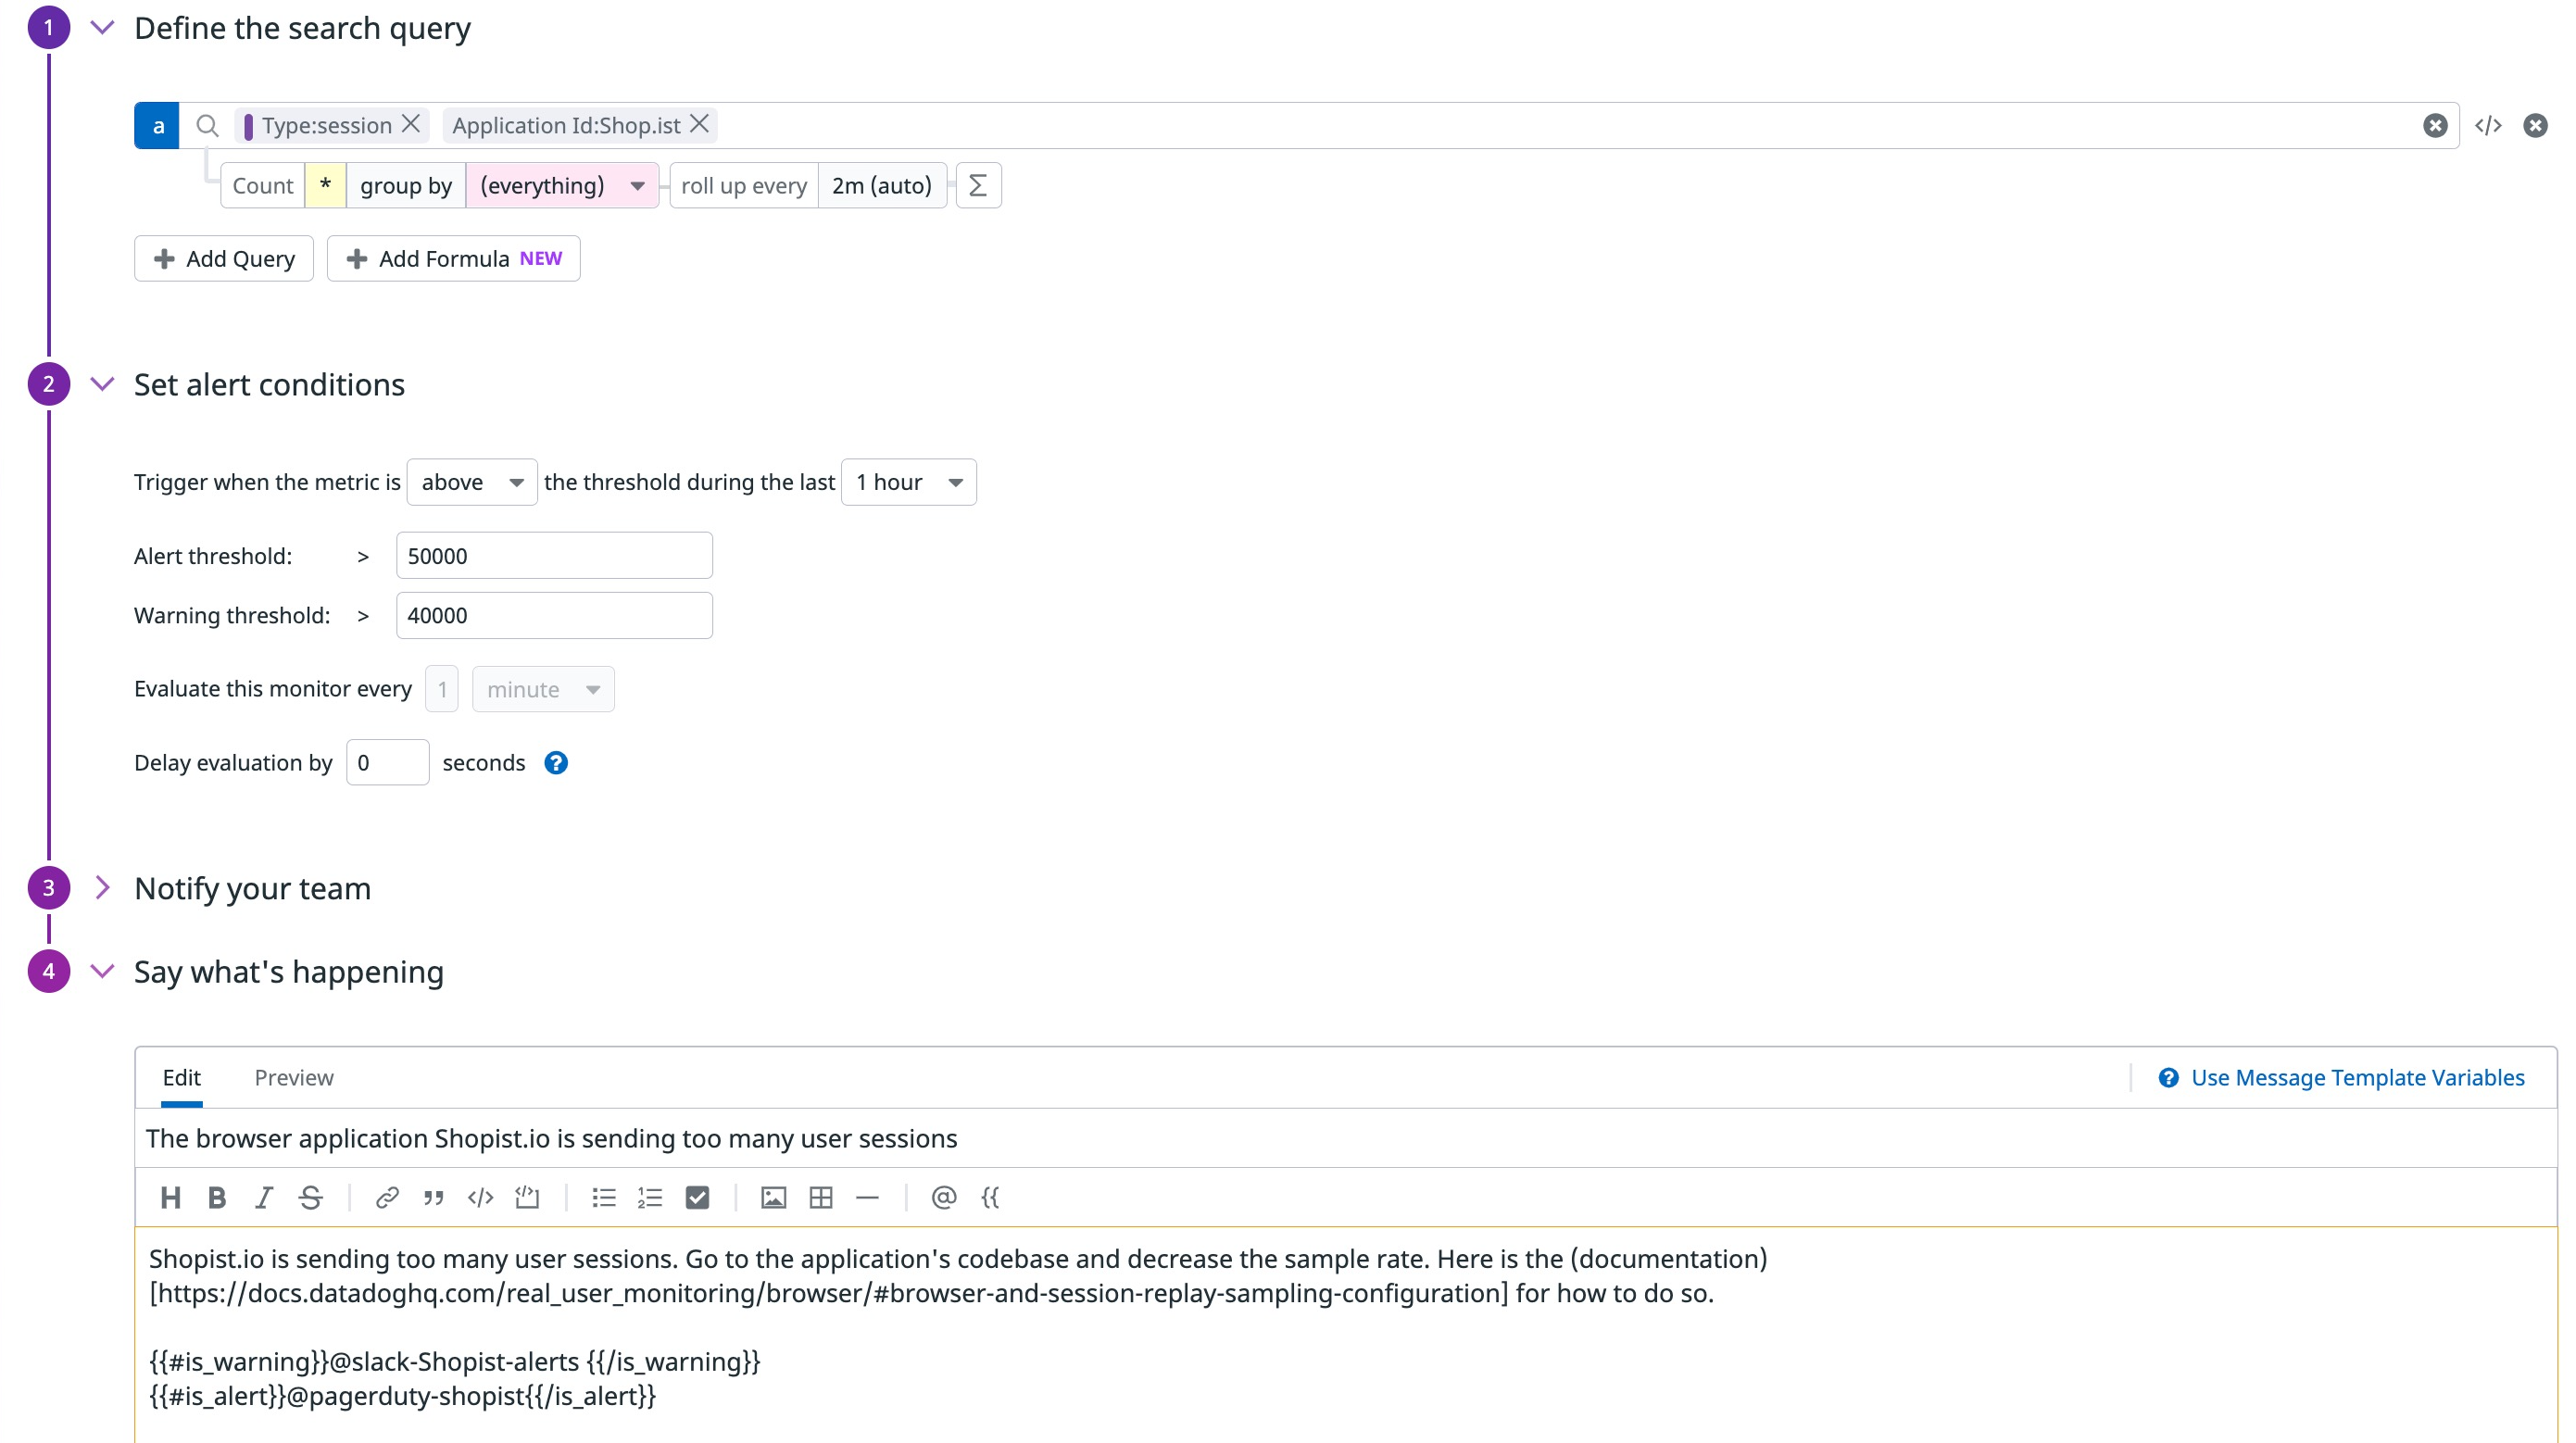
Go to the Datadog RUM Explorer view.
Build a search query that represents the volume to monitor. To monitor all user sessions, leave the query blank.
Click Export to monitor.
Define the rate you want to set as
warningorerror.Set a concrete notification message.
This example notification message contains actionable instructions:
Shopist.io is sending too many user sessions. Go to the application's codebase and decrease the sample rate. Here is the (documentation)[https://docs.datadoghq.com/real_user_monitoring/guide/sampling-browser-plans] for how to do so.

{{#is_warning}}@slack-Shopist-alerts {{/is_warning}}

{{#is_alert}}@pagerduty-shopist{{/is_alert}}
Set permissions and notification settings for this monitor.
Click Create.
You are notified about the amount of sessions captured in any scope (such as the application.id, geography, device, and more) for your application.
Further Reading
Additional helpful documentation, links, and articles:


