- Essentials
- Getting Started
- Datadog
- Datadog Site
- DevSecOps
- Serverless for AWS Lambda
- Agent
- Integrations
- Containers
- Dashboards
- Monitors
- Logs
- APM Tracing
- Profiler
- Tags
- API
- Service Catalog
- Session Replay
- Continuous Testing
- Synthetic Monitoring
- Incident Management
- Database Monitoring
- Cloud Security Management
- Cloud SIEM
- Application Security Management
- Workflow Automation
- CI Visibility
- Test Visibility
- Test Impact Analysis
- Code Analysis
- Learning Center
- Support
- Glossary
- Standard Attributes
- Guides
- Agent
- Integrations
- OpenTelemetry
- Developers
- Authorization
- DogStatsD
- Custom Checks
- Integrations
- Create an Agent-based Integration
- Create an API Integration
- Create a Log Pipeline
- Integration Assets Reference
- Build a Marketplace Offering
- Create a Tile
- Create an Integration Dashboard
- Create a Recommended Monitor
- Create a Cloud SIEM Detection Rule
- OAuth for Integrations
- Install Agent Integration Developer Tool
- Service Checks
- IDE Plugins
- Community
- Guides
- Administrator's Guide
- API
- Datadog Mobile App
- CoScreen
- Cloudcraft
- In The App
- Dashboards
- Notebooks
- DDSQL Editor
- Sheets
- Monitors and Alerting
- Infrastructure
- Metrics
- Watchdog
- Bits AI
- Service Catalog
- API Catalog
- Error Tracking
- Service Management
- Infrastructure
- Application Performance
- APM
- Continuous Profiler
- Database Monitoring
- Data Streams Monitoring
- Data Jobs Monitoring
- Digital Experience
- Real User Monitoring
- Product Analytics
- Synthetic Testing and Monitoring
- Continuous Testing
- Software Delivery
- CI Visibility
- CD Visibility
- Test Optimization
- Code Analysis
- Quality Gates
- DORA Metrics
- Security
- Security Overview
- Cloud SIEM
- Cloud Security Management
- Application Security Management
- AI Observability
- Log Management
- Observability Pipelines
- Log Management
- Administration
Error Tracking for Backend Services
Overview
It is critical for your system’s health to consistently monitor the errors collected by Datadog. When there are many individual error events, it becomes hard to prioritize errors for troubleshooting.
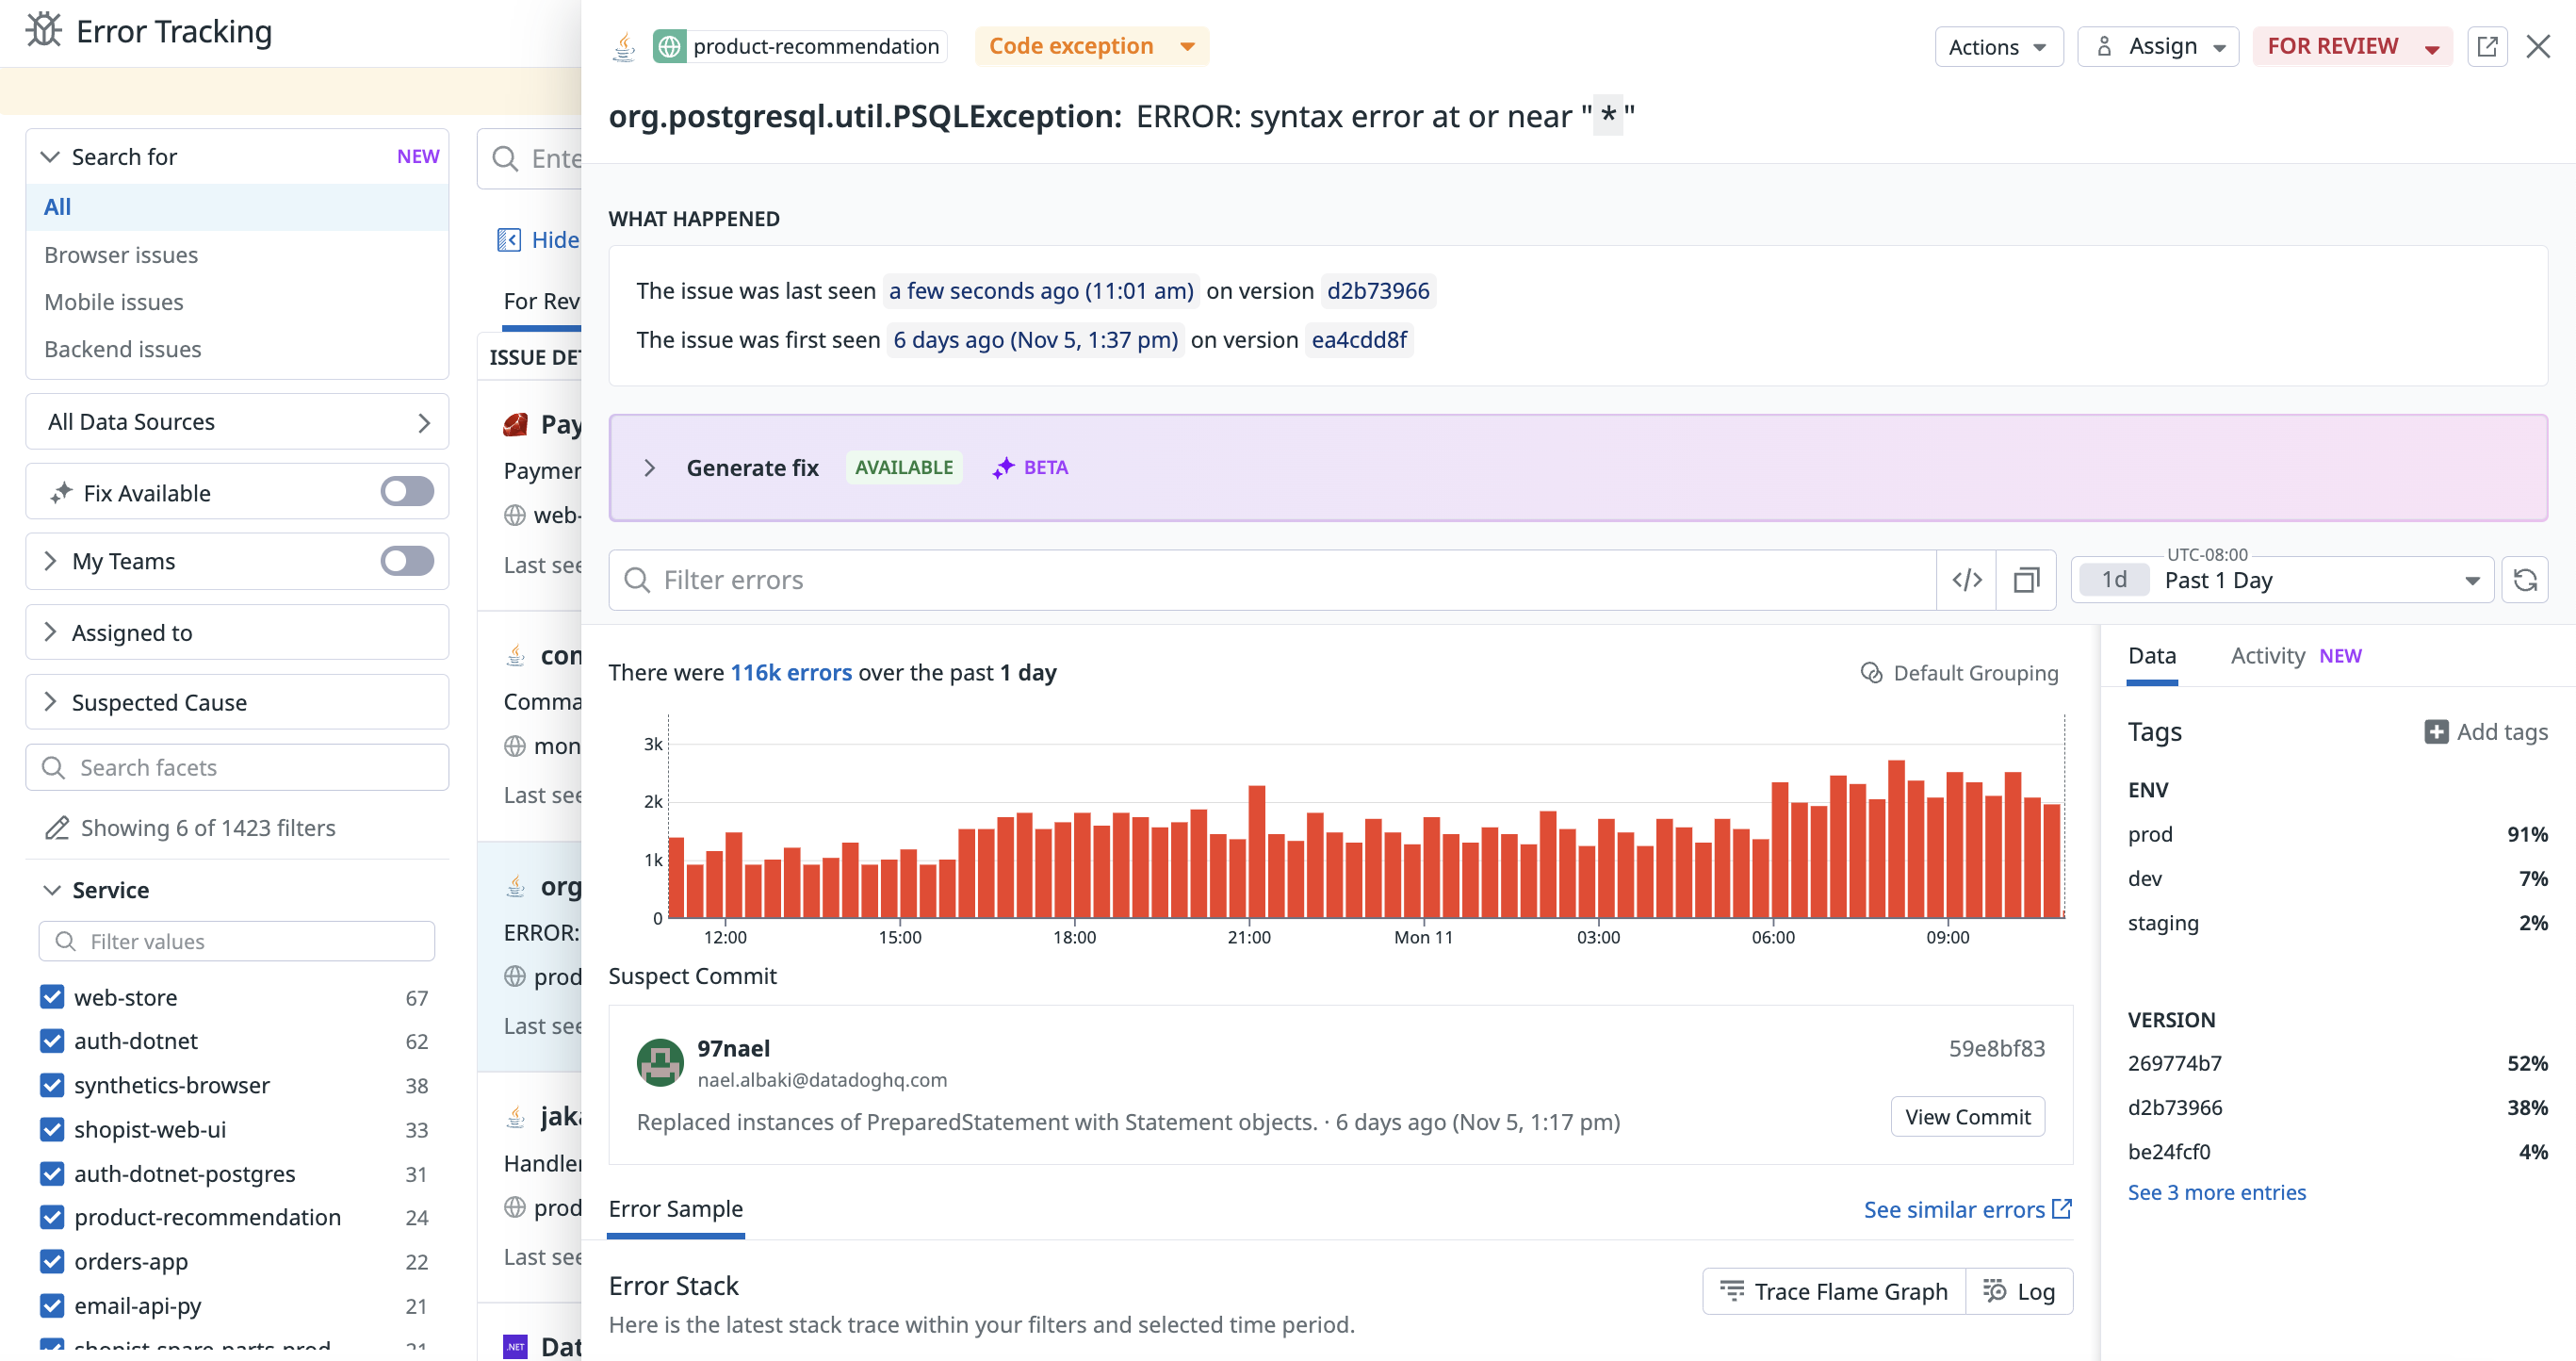
Error Tracking simplifies debugging by grouping thousands of similar errors into a single issue. An issue is an aggregation of error data that provides insights such as
- How many users have been impacted
- When the error first occurred
- Which commit probably caused the error
Error Tracking enables you to:
- Track, triage, and debug fatal errors
- Group similar errors into issues, so that you can more easily identify important errors and reduce noise
- Set monitors on error tracking events, such as high error volume or new issues
- Follow issues over time to know when they first started, if they are still ongoing, and how often they occur
Setup
Error Tracking is available for all the languages supported by APM and does not require using a different SDK.
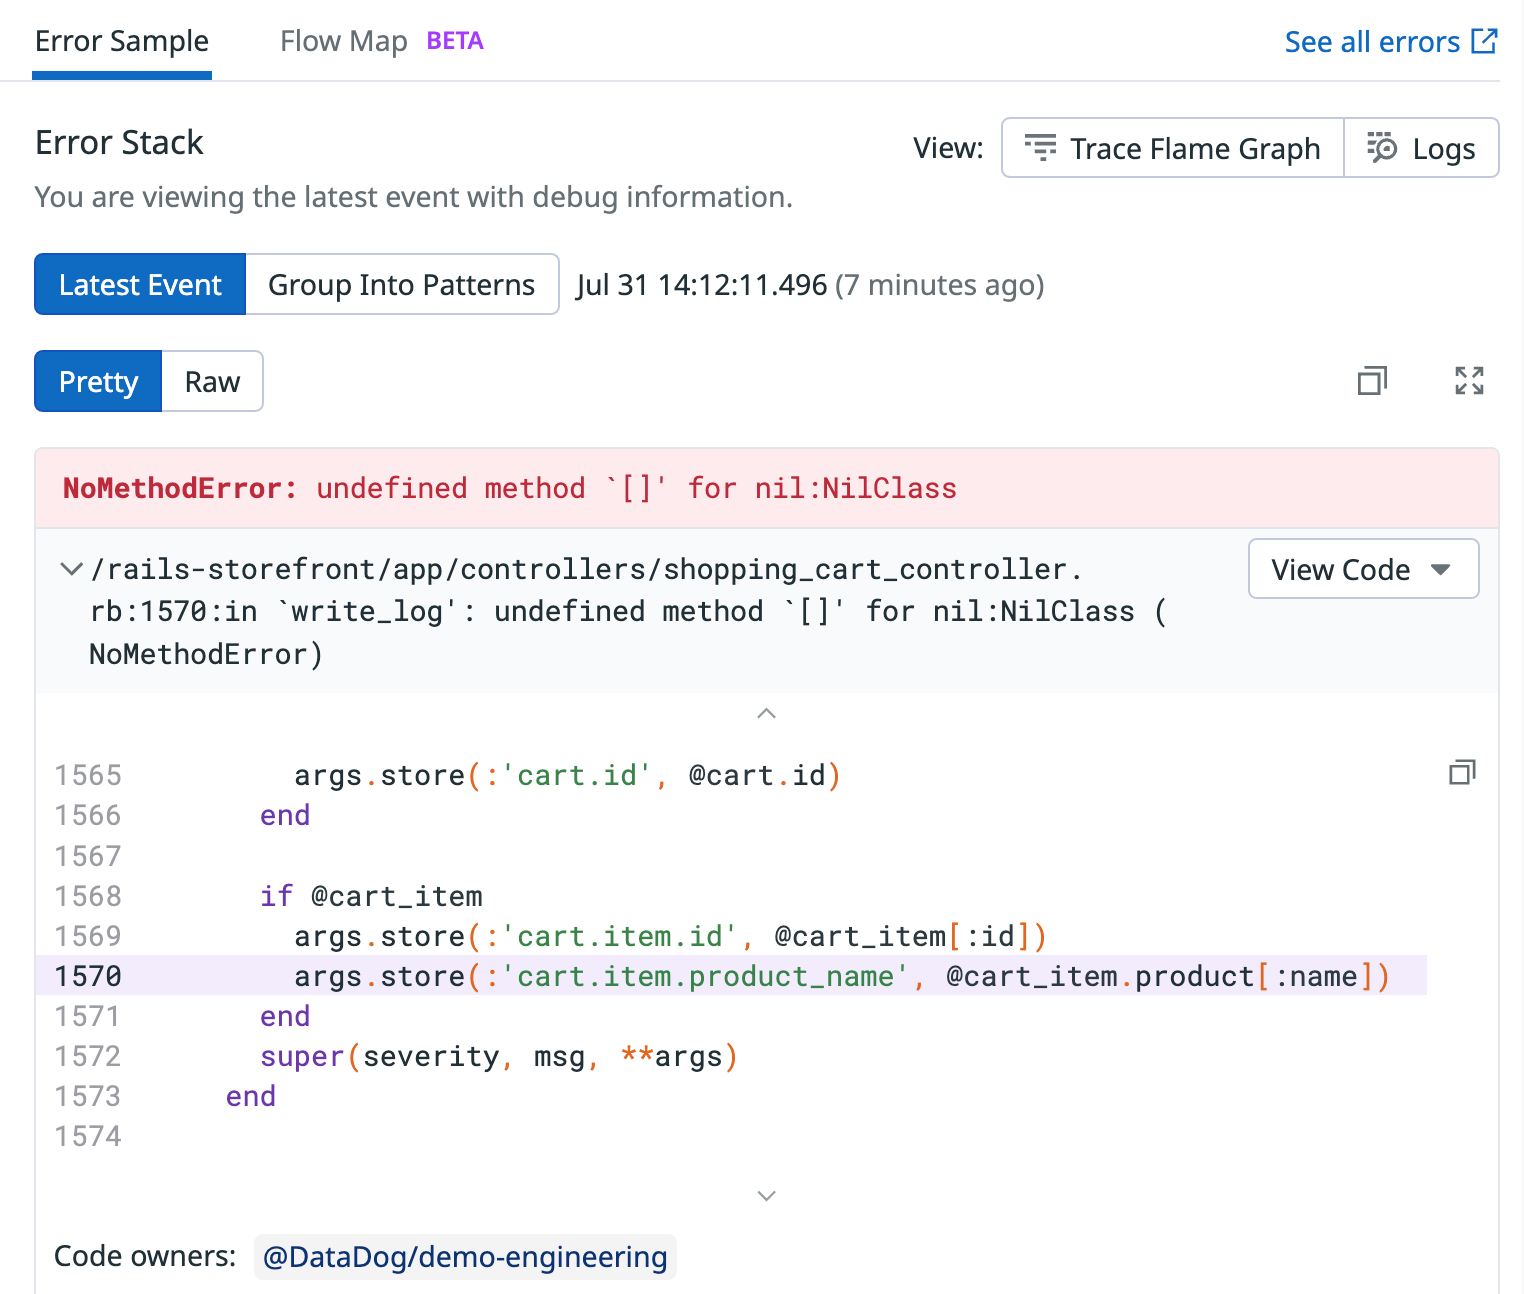
Optionally, to see code snippets in your stack traces, set up the GitHub integration.
To get started with configuring your repository, see the Source Code Integration documentation.
Use span attributes to track error spans
The Datadog tracers collect errors through integrations and the manual instrumentation of your backend services’ source code. Error spans within a trace are processed by Error Tracking if the error is located in a service entry span (the uppermost service span). This span must also contain the error.stack, error.message, and error.type span attributes to be tracked.
Error Tracking computes a fingerprint for each error span it processes using the error type, the error message, and the frames that form the stack trace. Errors with the same fingerprint are grouped together and belong to the same issue. For more information, see the Trace Explorer documentation.
Examine issues to start troubleshooting or debugging
Error Tracking automatically categorizes errors into issues collected from your backend services in the Error Tracking Explorer. See the Error Tracking Explorer documentation for a tour of key features.
Issues created from APM include the distribution of impacted spans, the latest most relevant stack trace, span attributes, host tags, container tags, and metrics.
Further Reading
Additional helpful documentation, links, and articles:


