- Principales informations
- Getting Started
- Datadog
- Site Datadog
- DevSecOps
- Serverless for AWS Lambda
- Agent
- Intégrations
- Conteneurs
- Dashboards
- Monitors
- Logs
- Tracing
- Profileur
- Tags
- API
- Service Catalog
- Session Replay
- Continuous Testing
- Surveillance Synthetic
- Incident Management
- Database Monitoring
- Cloud Security Management
- Cloud SIEM
- Application Security Management
- Workflow Automation
- CI Visibility
- Test Visibility
- Intelligent Test Runner
- Code Analysis
- Learning Center
- Support
- Glossary
- Standard Attributes
- Guides
- Agent
- Intégrations
- OpenTelemetry
- Développeurs
- Authorization
- DogStatsD
- Checks custom
- Intégrations
- Create an Agent-based Integration
- Create an API Integration
- Create a Log Pipeline
- Integration Assets Reference
- Build a Marketplace Offering
- Create a Tile
- Create an Integration Dashboard
- Create a Recommended Monitor
- Create a Cloud SIEM Detection Rule
- OAuth for Integrations
- Install Agent Integration Developer Tool
- Checks de service
- IDE Plugins
- Communauté
- Guides
- API
- Application mobile
- CoScreen
- Cloudcraft
- In The App
- Dashboards
- Notebooks
- DDSQL Editor
- Alertes
- Infrastructure
- Métriques
- Watchdog
- Bits AI
- Service Catalog
- API Catalog
- Error Tracking
- Service Management
- Infrastructure
- Universal Service Monitoring
- Conteneurs
- Sans serveur
- Surveillance réseau
- Cloud Cost
- Application Performance
- APM
- Profileur en continu
- Database Monitoring
- Agent Integration Overhead
- Setup Architectures
- Configuration de Postgres
- Configuration de MySQL
- Configuration de SQL Server
- Setting Up Oracle
- Setting Up MongoDB
- Connecting DBM and Traces
- Données collectées
- Exploring Database Hosts
- Explorer les métriques de requête
- Explorer des échantillons de requêtes
- Dépannage
- Guides
- Data Streams Monitoring
- Data Jobs Monitoring
- Digital Experience
- RUM et Session Replay
- Product Analytics
- Surveillance Synthetic
- Continuous Testing
- Software Delivery
- CI Visibility
- CD Visibility
- Test Visibility
- Exécuteur de tests intelligent
- Code Analysis
- Quality Gates
- DORA Metrics
- Securité
- Security Overview
- Cloud SIEM
- Cloud Security Management
- Application Security Management
- AI Observability
- Log Management
- Pipelines d'observabilité
- Log Management
- Administration
Best Practices for Log Management
Cette page n'est pas encore disponible en français, sa traduction est en cours.
Si vous avez des questions ou des retours sur notre projet de traduction actuel, n'hésitez pas à nous contacter.
Si vous avez des questions ou des retours sur notre projet de traduction actuel, n'hésitez pas à nous contacter.
Overview
Datadog Log Management collects, processes, archives, explores, and monitors your logs, so that you have visibility into your system’s issues. However, it can be hard to get the right level of visibility from your logs and log throughput can vary highly, creating unexpected resource usage.
Therefore, this guide walks you through various Log Management best practices and account configurations that provide you flexibility in governance, usage attribution, and budget control. More specifically, how to:
- Set up multiple indexes to segment your logs
- Set up multiple archives for long-term storage
- Set up RBAC for custom roles
This guide also goes through how to monitor your log usage by:
- Alerting on unexpected log traffic spikes
- Alerting on indexed logs when the volume passes a specified threshold
- Setting up exclusion filters on high-volume logs
If you want to transform your logs or redact sensitive data in your logs before they leave your environment, see how to aggregate, process, and transform your log data with Observability Pipelines.
Log account configuration
Set up multiple indexes for log segmentation
Set up multiple indexes if you want to segment your logs for different retention periods or daily quotas, usage monitoring, and billing.
For example, if you have logs that only need to be retained for 7 days, while other logs need to be retained for 30 days, use multiple indexes to separate out the logs by the two retention periods.
To set up multiple indexes:
- Navigate to Log Indexes.
- Click New Index or Add a new index.
- Enter a name for the Index.
- Enter the search query to filter to the logs you want in this index.
- Set the daily quota to limit the number of logs that are stored within an index per day.
- Set the retention period to how long you want to retain these logs.
- Click Save.
Setting daily quotas on your indexes can help prevent billing overages when new log sources are added or if a developer unintentionally changes the logging levels to debug mode. See Alert on indexes reaching their daily quota on how to set up a monitor to alert when a percentage of the daily quota is reached within the past 24 hours.
Set up storage for long-term retention
If you want to retain logs for an extended time while maintaining querying speeds similar to Standard Indexing, configure Flex Logs. This tier is best suited for logs that require longer retention and occasionally need to be queried urgently. Flex Logs decouples storage from compute costs so you can cost effectively retain more logs for longer without sacrificing visibility. Logs that need to be frequently queried should be stored in standard indexes.
Set up multiple archives for long-term storage
If you want to store your logs for longer periods of time, set up Log Archives to send your logs to a storage-optimized system, such as Amazon S3, Azure Storage, or Google Cloud Storage. When you want to use Datadog to analyze those logs, use Log Rehydration™ to capture those logs back in Datadog. With multiple archives, you can both segment logs for compliance reasons and keep rehydration costs under control.
Set up max scan size to manage expensive rehydrations
Set a limit on the volume of logs that can be rehydrated at one time. When setting up an archive, you can define the maximum volume of log data that can be scanned for Rehydration. See Define maximum scan size for more information.
Set up RBAC for custom roles
There are three default Datadog roles: Admin, Standard, and Read-only. You can also create custom roles with unique permission sets. For example, you can create a role that restricts users from modifying index retention policies to avoid unintended cost spikes. Similarly, you can restrict who can modify log parsing configurations to avoid unwanted changes to well-defined log structures and formats.
To set up custom roles with permissions:
- Log in to Datadog as an Admin.
- Navigate to Organization Settings > Roles.
- To enable custom roles, click the cog on the top left and then click Enable.
- Once enabled, click New Role.
- Enter a name for the new role.
- Select the permissions for the role. This allows you to restrict access to certain actions, such as rehydrating logs and creating log-based metrics. See Log Management Permissions for details.
- Click Save.
See How to Set Up RBAC for Logs for a step-by-step guide on how to set up and assign a role with specific permissions for an example use case.
Monitor log usage
You can monitor your log usage, by setting up the following:
- Alerts for unexpected log traffic spikes
- Alert when an indexed log volume passes a specified threshold
Alert on unexpected log traffic spikes
Log usage metrics
By default, log usage metrics are available to track the number of ingested logs, ingested bytes, and indexed logs. These metrics are free and kept for 15 months:
datadog.estimated_usage.logs.ingested_bytesdatadog.estimated_usage.logs.ingested_events
See Anomaly detection monitors for steps on how to create anomaly monitors with the usage metrics.
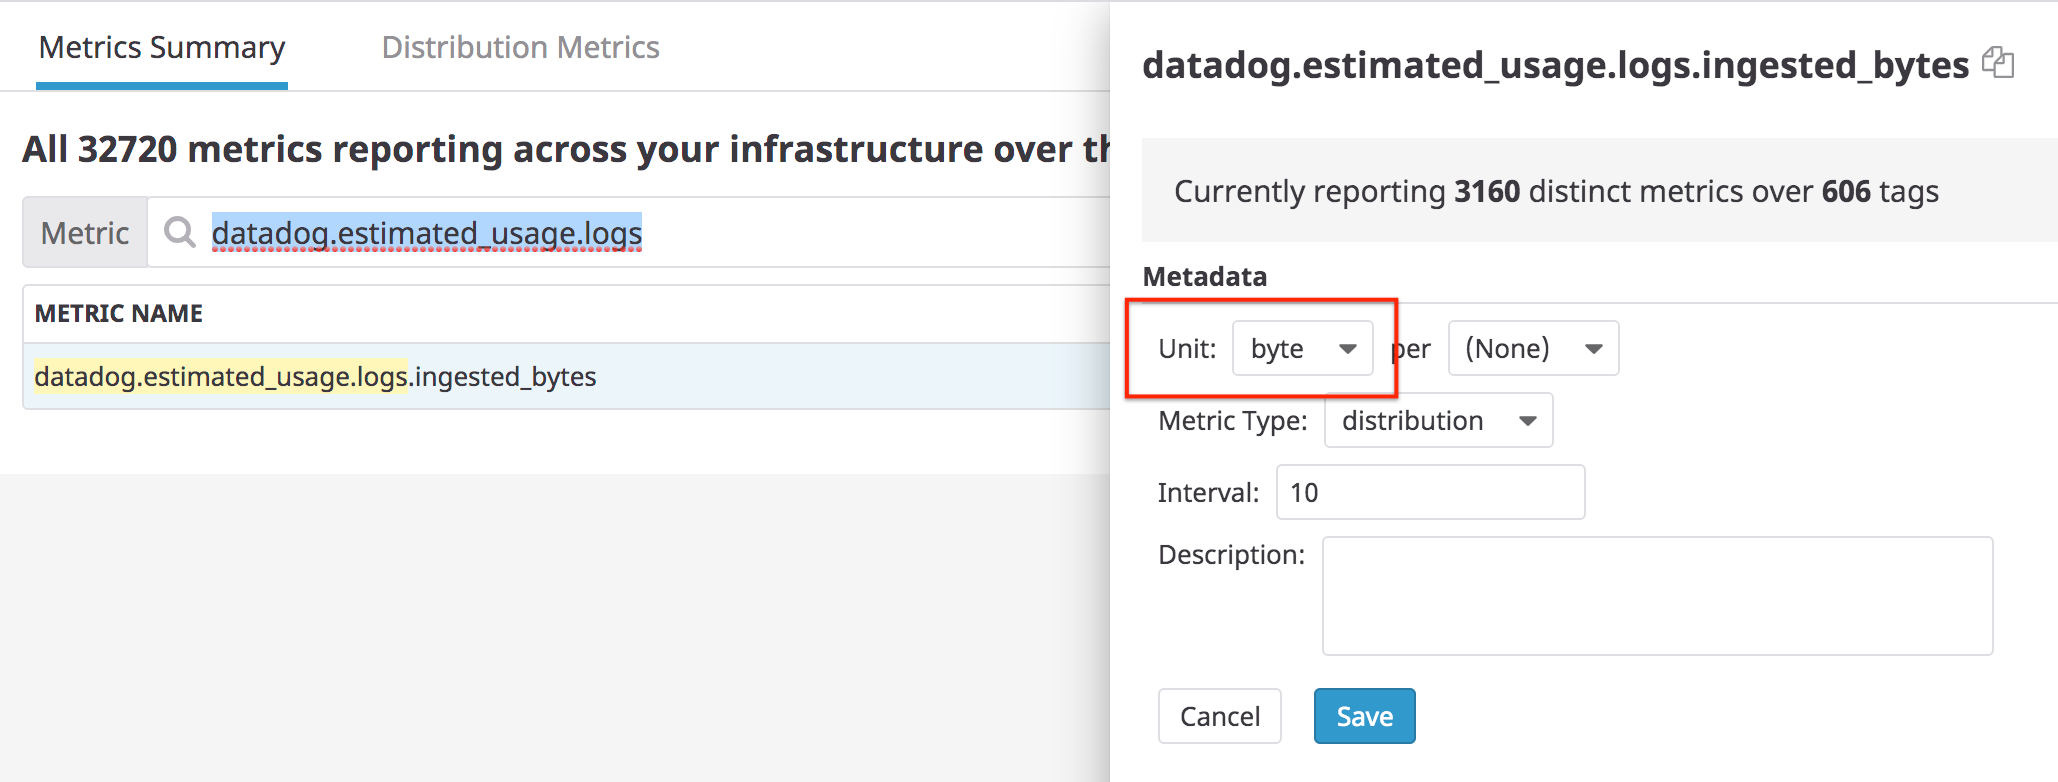
Note: Datadog recommends setting the unit to byte for the datadog.estimated_usage.logs.ingested_bytes in the metric summary page:
Anomaly detection monitors
Create an anomaly detection monitor to alert on any unexpected log indexing spikes:
- Navigate to Monitors > New Monitor and select Anomaly.
- In the Define the metric section, select the
datadog.estimated_usage.logs.ingested_eventsmetric. - In the from field, add the
datadog_is_excluded:falsetag to monitor indexed logs and not ingested ones. - In the sum by field, add the
serviceanddatadog_indextags, so that you are notified if a specific service spikes or stops sending logs in any index. - Set the alert conditions to match your use case. For example, set the monitor to alert if the evaluated values are outside of an expected range.
- Add a title for the notification and a message with actionable instructions. For example, this is a notification with contextual links:
An unexpected amount of logs has been indexed in the index: {{datadog_index.name}} 1. [Check Log patterns for this service](https://app.datadoghq.com/logs/patterns?from_ts=1582549794112&live=true&to_ts=1582550694112&query=service%3A{{service.name}}) 2. [Add an exclusion filter on the noisy pattern](https://app.datadoghq.com/logs/pipelines/indexes) - Click Create.
Alert when an indexed log volume passes a specified threshold
Set up a monitor to alert if an indexed log volume in any scope of your infrastructure (for example, service, availability-zone, and so forth) is growing unexpectedly.
- Navigate to the Log Explorer.
- Enter a search query that includes the index name (for example,
index:main) to capture the log volume you want to monitor. - Click More… and select Create monitor.
- Add tags (for example,
host,services, and so on) to the group by field. - Enter the Alert threshold for your use case. Optionally, enter a Warning threshold.
- Add a notification title, for example:
Unexpected spike on indexed logs for service {{service.name}} - Add a message, for example:
The volume on this service exceeded the threshold. Define an additional exclusion filter or increase the sampling rate to reduce the volume. - Click Create.
Alert on indexed logs volume since the beginning of the month
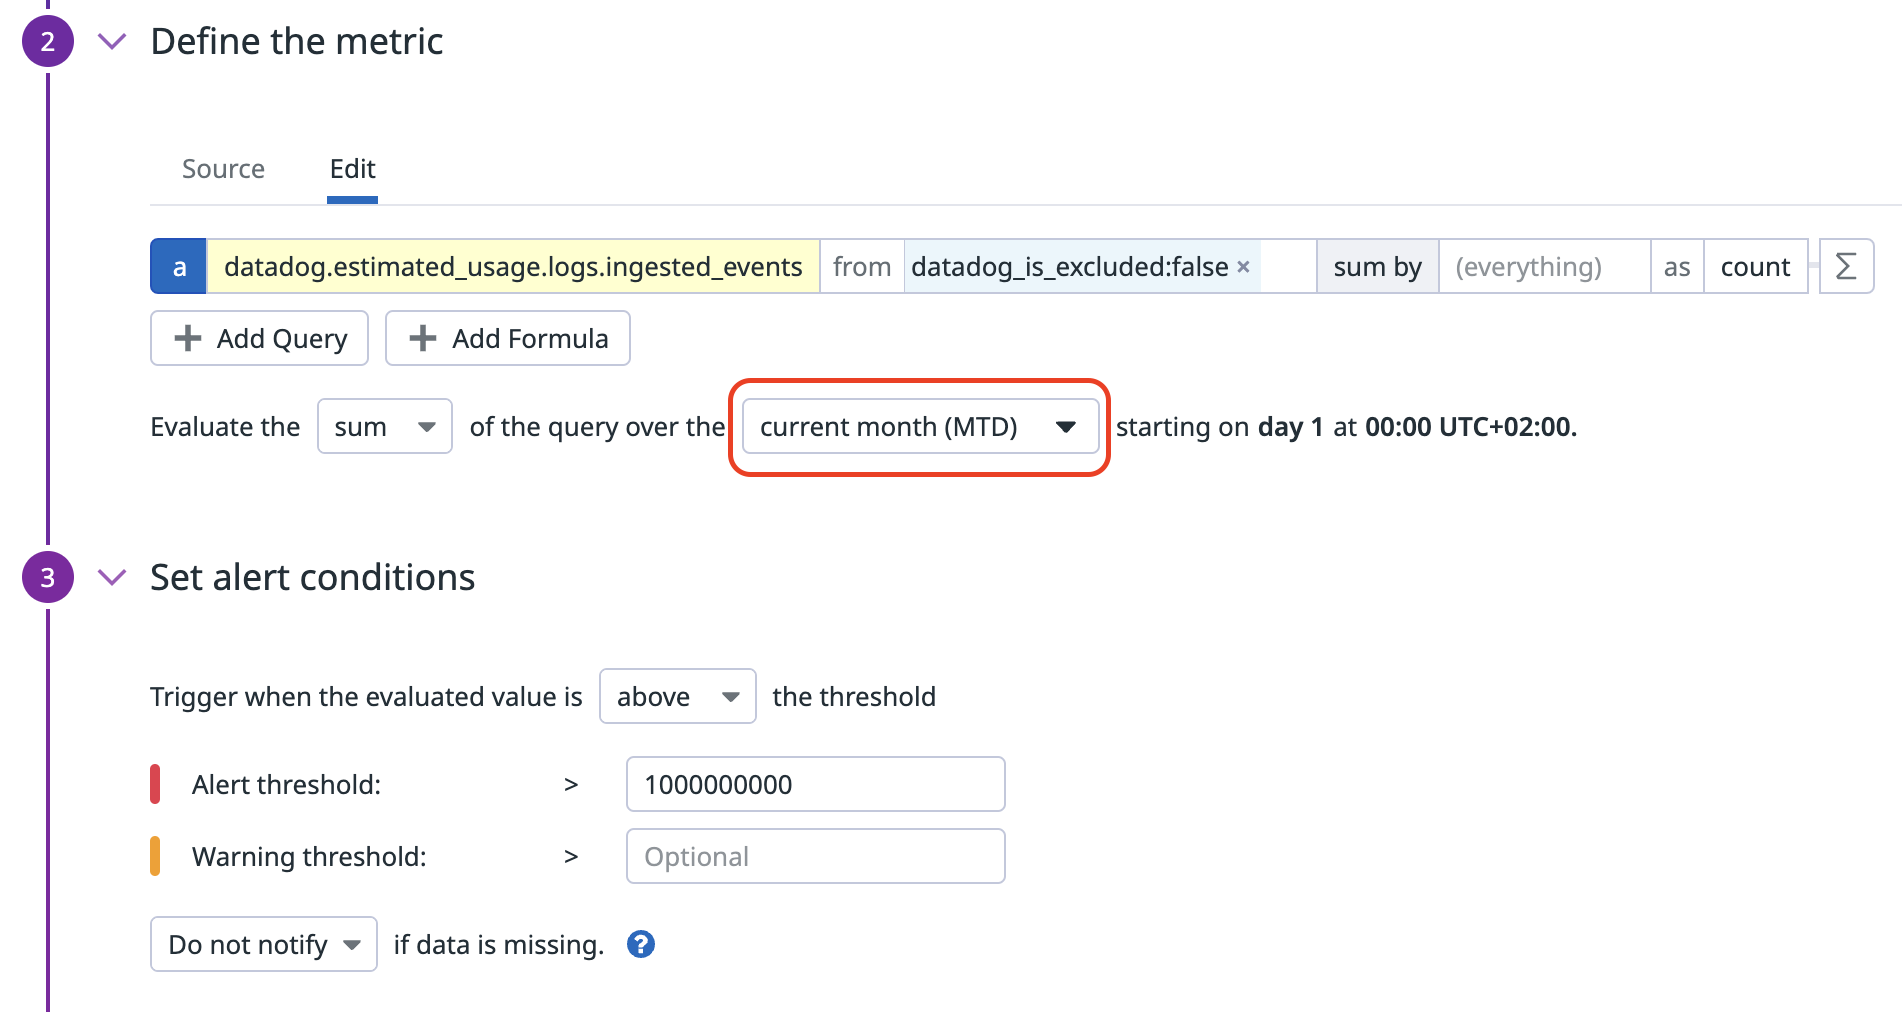
Leverage the datadog.estimated_usage.logs.ingested_events metric filtered on datadog_is_excluded:false to only count indexed logs and the metric monitor cumulative window to monitor the count since the beginning of the month.
Alert on indexes reaching their daily quota
Set up a daily quota on indexes to prevent indexing more than a given number of logs per day. If an index has a daily quota, Datadog recommends that you set the monitor that notifies on that index’s volume to alert when 80% of this quota is reached within the past 24 hours.
An event is generated when the daily quota is reached. By default, these events have the datadog_index tag with the index name. Therefore, when this event has been generated, you can create a facet on the datadog_index tag, so that you can use datadog_index in the group by step for setting up a multi-alert monitor.
To set up a monitor to alert when the daily quota is reached for an index:
- Navigate to Monitors > New Monitor and click Event.
- Enter:
source:datadog "daily quota reached"in the Define the search query section. - Add
datadog_indexto the group by field. It automatically updates todatadog_index(datadog_index). Thedatadog_index(datadog_index)tag is only available when an event has already been generated. - In the Set alert conditions section, select
above or equal toand enter1for the Alert threshold. - Add a notification title and message in the Configure notifications and automations section. The Multi Alert button is automatically selected because the monitor is grouped by
datadog_index(datadog_index). - Click Save.
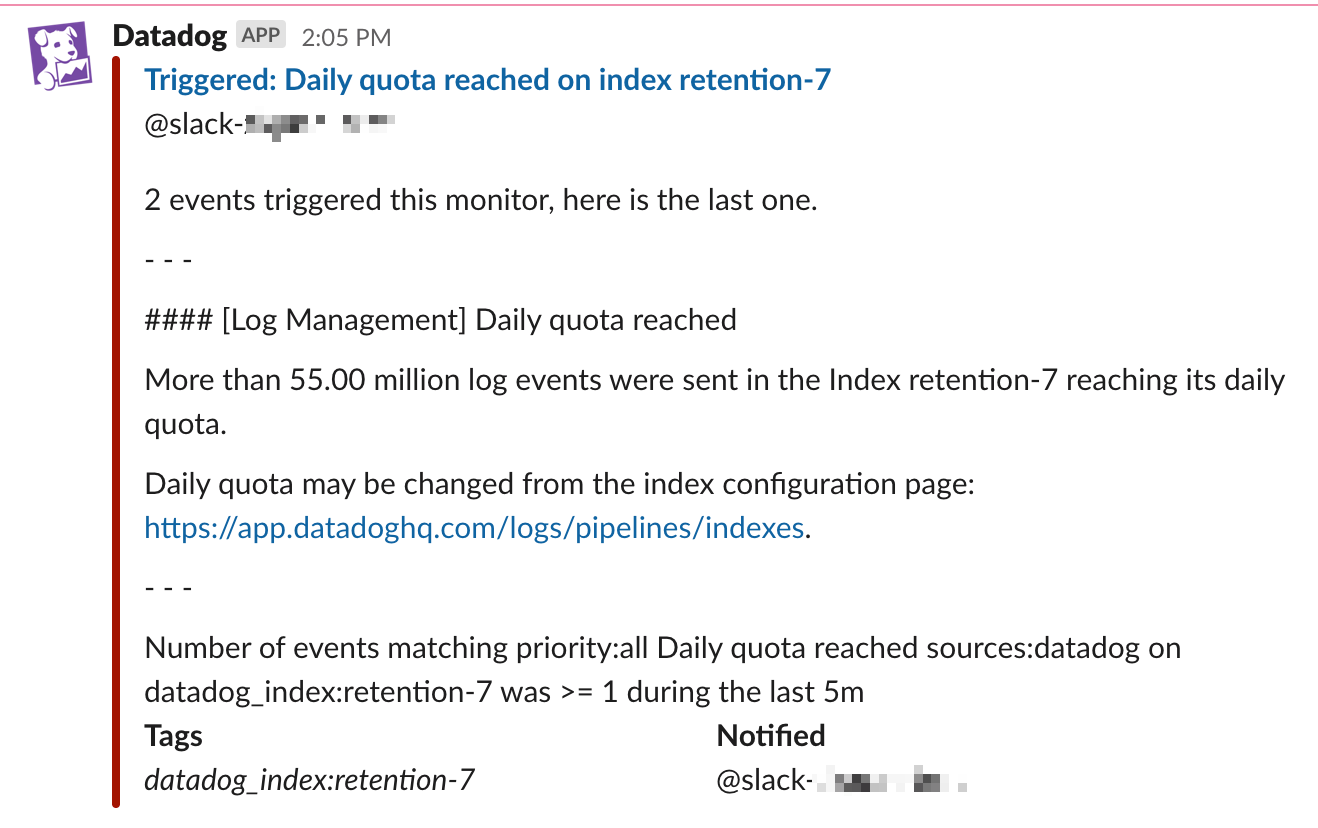
This is an example of what the notification looks like in Slack:
Review the estimated usage dashboard
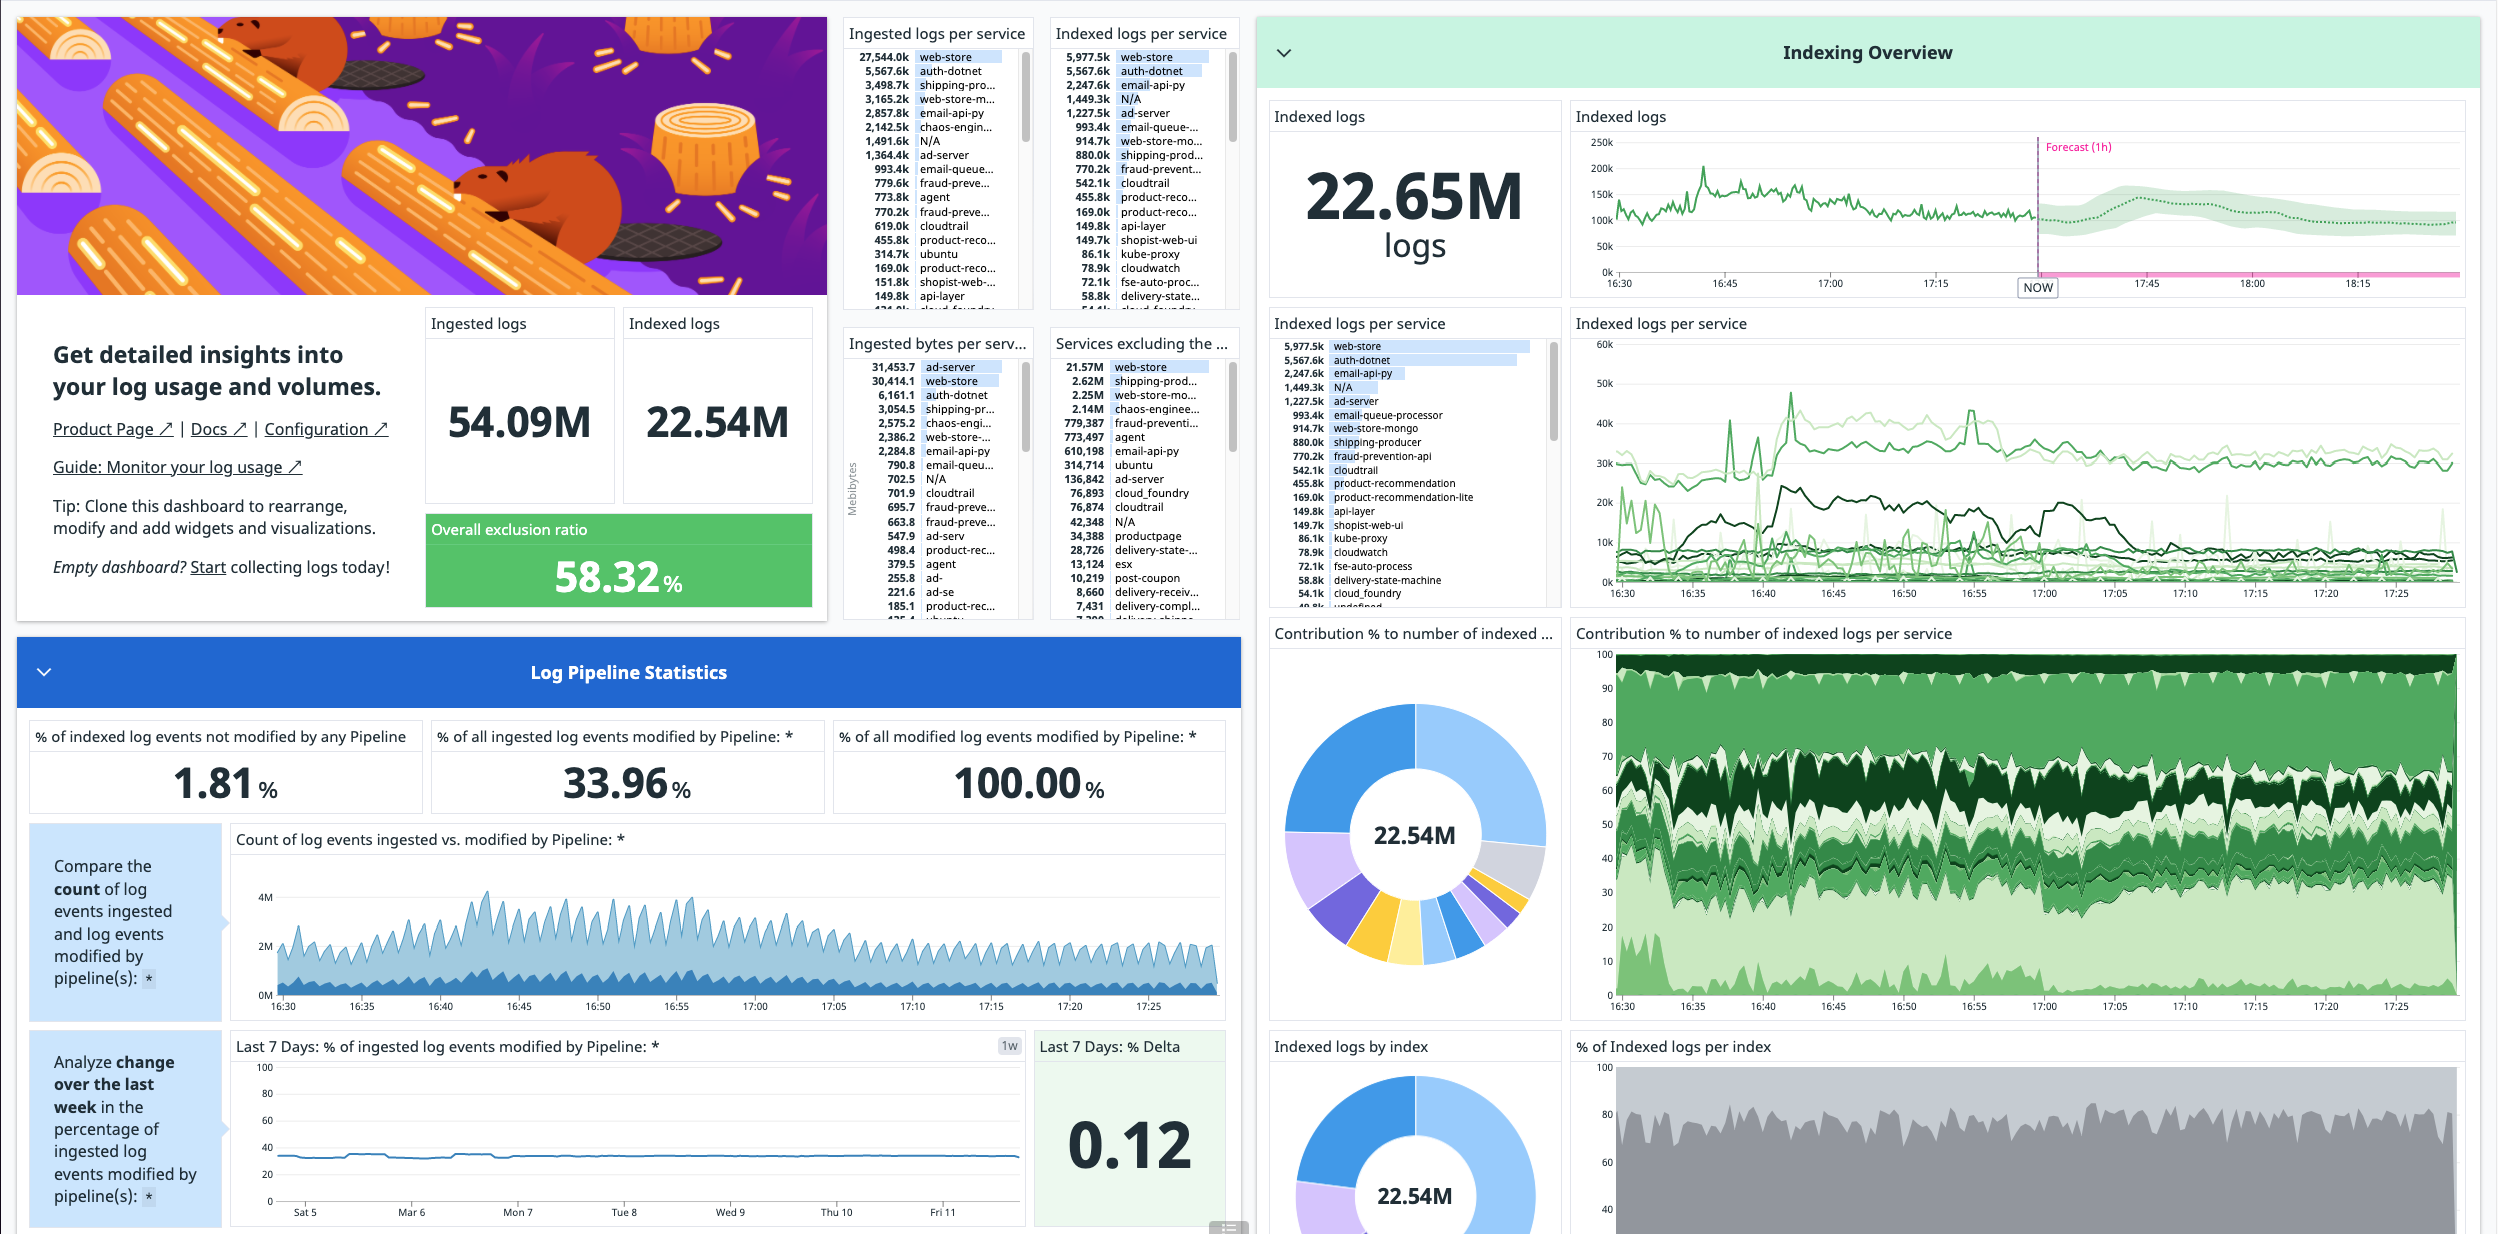
Once you begin ingesting logs, an out-of-the-box dashboard summarizing your log usage metrics is automatically installed in your account.
Note: The metrics used in this dashboard are estimates and may differ from official billing numbers.
To find this dashboard, go to Dashboards > Dashboards List and search for Log Management - Estimated Usage.
Set up exclusion filters on high-volume logs
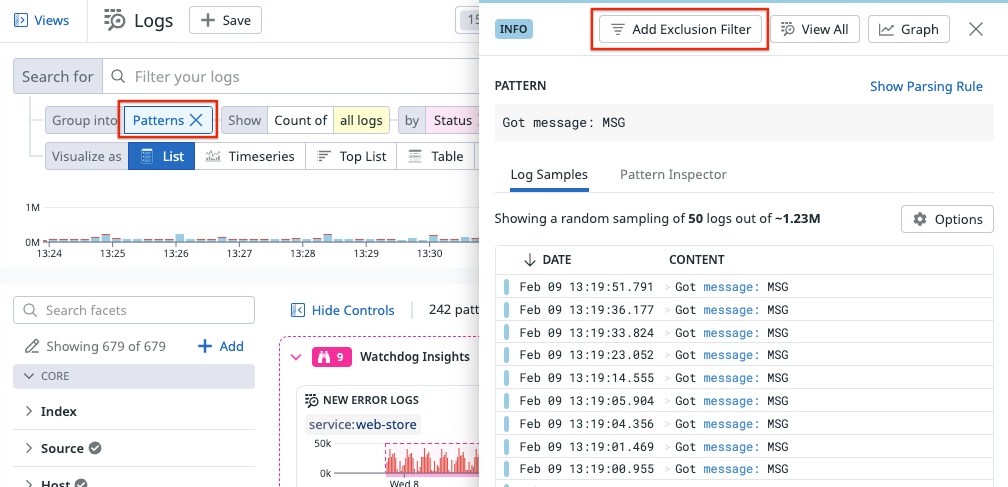
When your usage monitors alert, you can set up exclusion filters and increase the sampling rate to reduce the volume. See Exclusion Filters on how to set them up. You can also use Log Patterns to group and identify high-volume logs. Then, in the log pattern’s side panel, click Add Exclusion Filter to add a filter to stop indexing those logs.
Even if you use exclusion filters, you can still visualize trends and anomalies over all of your log data using log-based metrics. See Generate Metrics from Ingested Logs for more information.
Enable Sensitive Data Scanner for Personally Identifiable Information (PII) detection
If you want to prevent data leaks and limit non-compliance risks, use Sensitive Data Scanner to identify, tag, and optionally redact or hash sensitive data. For example, you can scan for credit card numbers, bank routing numbers, and API keys in your logs, APM spans, and RUM events, See Sensitive Data Scanner on how to set up scanning rules to determine what data to scan.
Note: Sensitive Data Scanner is a separate billable product.
Enable Audit Trail to see user activities
If you want to see user activities, such as who changed the retention of an index or who modified an exclusion filter, enable Audit Trail to see these events. See Audit Trail Events for a list of platform and product-specific events that are available. To enable and configure Audit Trail, follow the steps in the Audit Trail documentation.
Note: Audit Trail is a separate billable product.
Further Reading
Documentation, liens et articles supplémentaires utiles:
