- 重要な情報
- はじめに
- Datadog
- Datadog サイト
- DevSecOps
- AWS Lambda のサーバーレス
- エージェント
- インテグレーション
- コンテナ
- ダッシュボード
- アラート設定
- ログ管理
- トレーシング
- プロファイラー
- タグ
- API
- Service Catalog
- Session Replay
- Continuous Testing
- Synthetic モニタリング
- Incident Management
- Database Monitoring
- Cloud Security Management
- Cloud SIEM
- Application Security Management
- Workflow Automation
- CI Visibility
- Test Visibility
- Intelligent Test Runner
- Code Analysis
- Learning Center
- Support
- 用語集
- Standard Attributes
- ガイド
- インテグレーション
- エージェント
- OpenTelemetry
- 開発者
- 認可
- DogStatsD
- カスタムチェック
- インテグレーション
- Create an Agent-based Integration
- Create an API Integration
- Create a Log Pipeline
- Integration Assets Reference
- Build a Marketplace Offering
- Create a Tile
- Create an Integration Dashboard
- Create a Recommended Monitor
- Create a Cloud SIEM Detection Rule
- OAuth for Integrations
- Install Agent Integration Developer Tool
- サービスのチェック
- IDE インテグレーション
- コミュニティ
- ガイド
- API
- モバイルアプリケーション
- CoScreen
- Cloudcraft
- アプリ内
- Service Management
- インフラストラクチャー
- アプリケーションパフォーマンス
- APM
- Continuous Profiler
- データベース モニタリング
- Data Streams Monitoring
- Data Jobs Monitoring
- Digital Experience
- Software Delivery
- CI Visibility (CI/CDの可視化)
- CD Visibility
- Test Visibility
- Intelligent Test Runner
- Code Analysis
- Quality Gates
- DORA Metrics
- セキュリティ
- セキュリティの概要
- Cloud SIEM
- クラウド セキュリティ マネジメント
- Application Security Management
- AI Observability
- ログ管理
- Observability Pipelines(観測データの制御)
- ログ管理
- 管理
Product Analytics
このページは日本語には対応しておりません。随時翻訳に取り組んでいます。翻訳に関してご質問やご意見ございましたら、お気軽にご連絡ください。
Product Analytics is in limited availability. To request access, complete the form.
Request AccessOverview
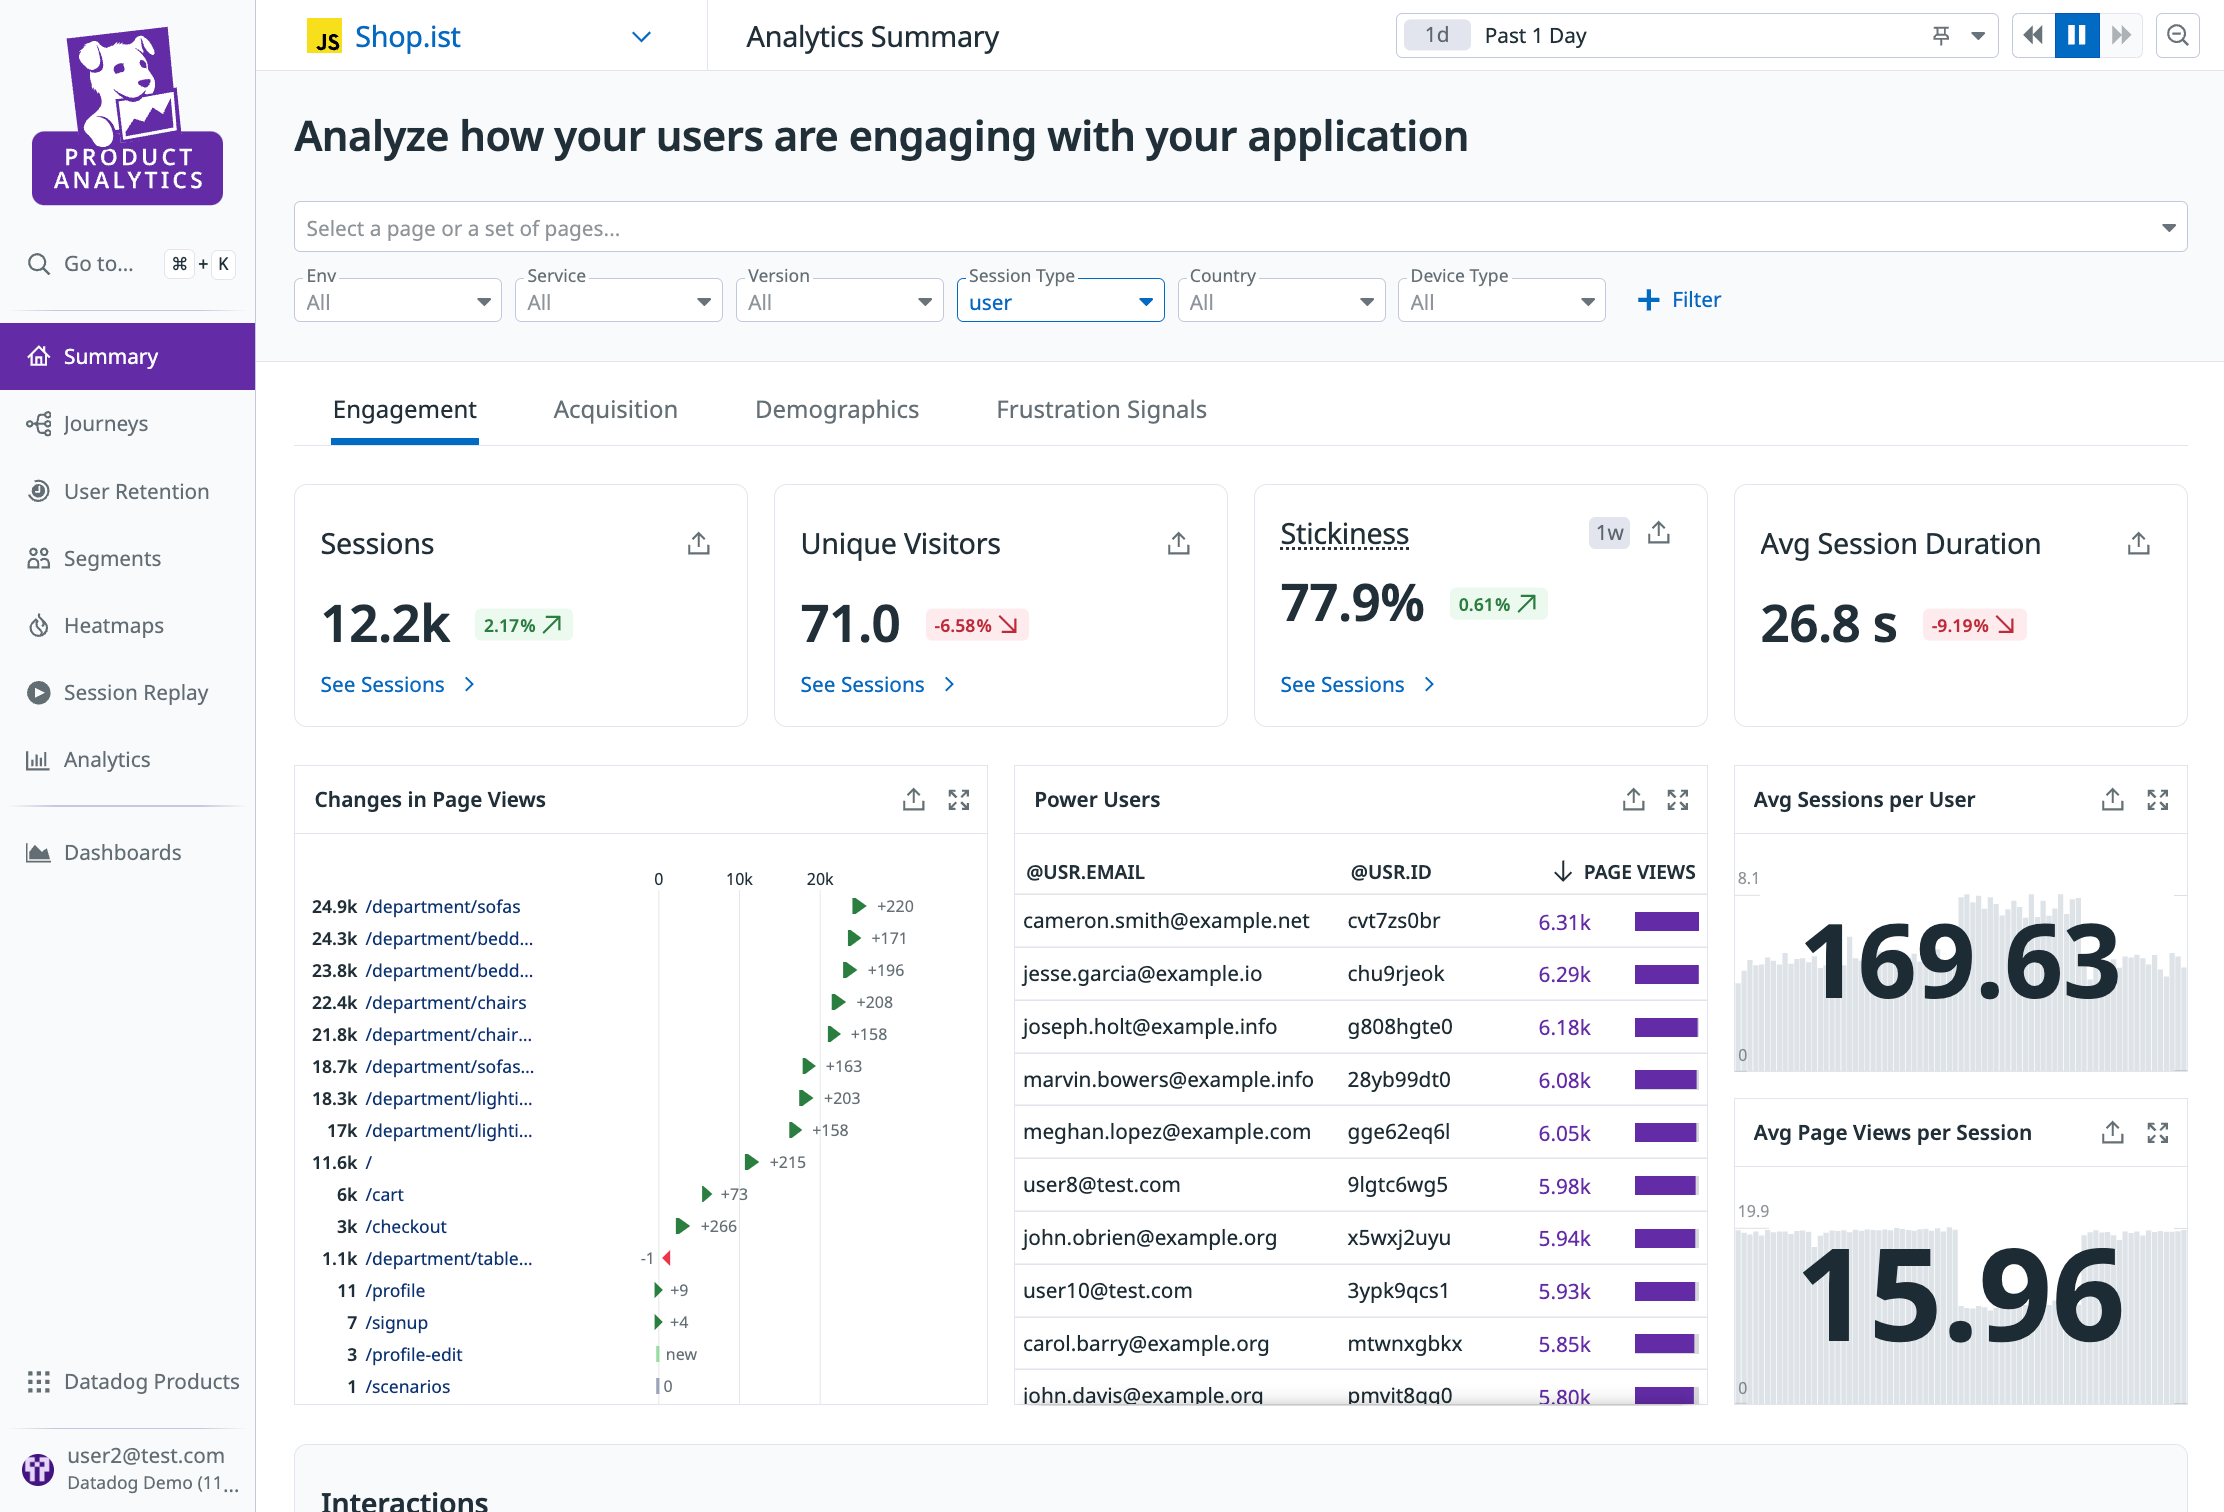
Product Analytics helps you gain insight into user behavior and make data-driven decisions. It can help solve the following types of use cases in your application:
- Understand product adoption
- Track conversion rates and their evolution over time
- Track key user behavior patterns
- Visualize the most and least interacted with buttons on a given page
By default, Product Analytics data is retained for 15 months. Learn more about Privacy at Datadog.
Measure user retention
User retention is a metric for measuring the percentage of active users who continue to use your product, app, or service over a set period of time. Use Retention Analysis to measure how a group of users engage with specific features over time to understand where drop-offs occur.
Map user journeys
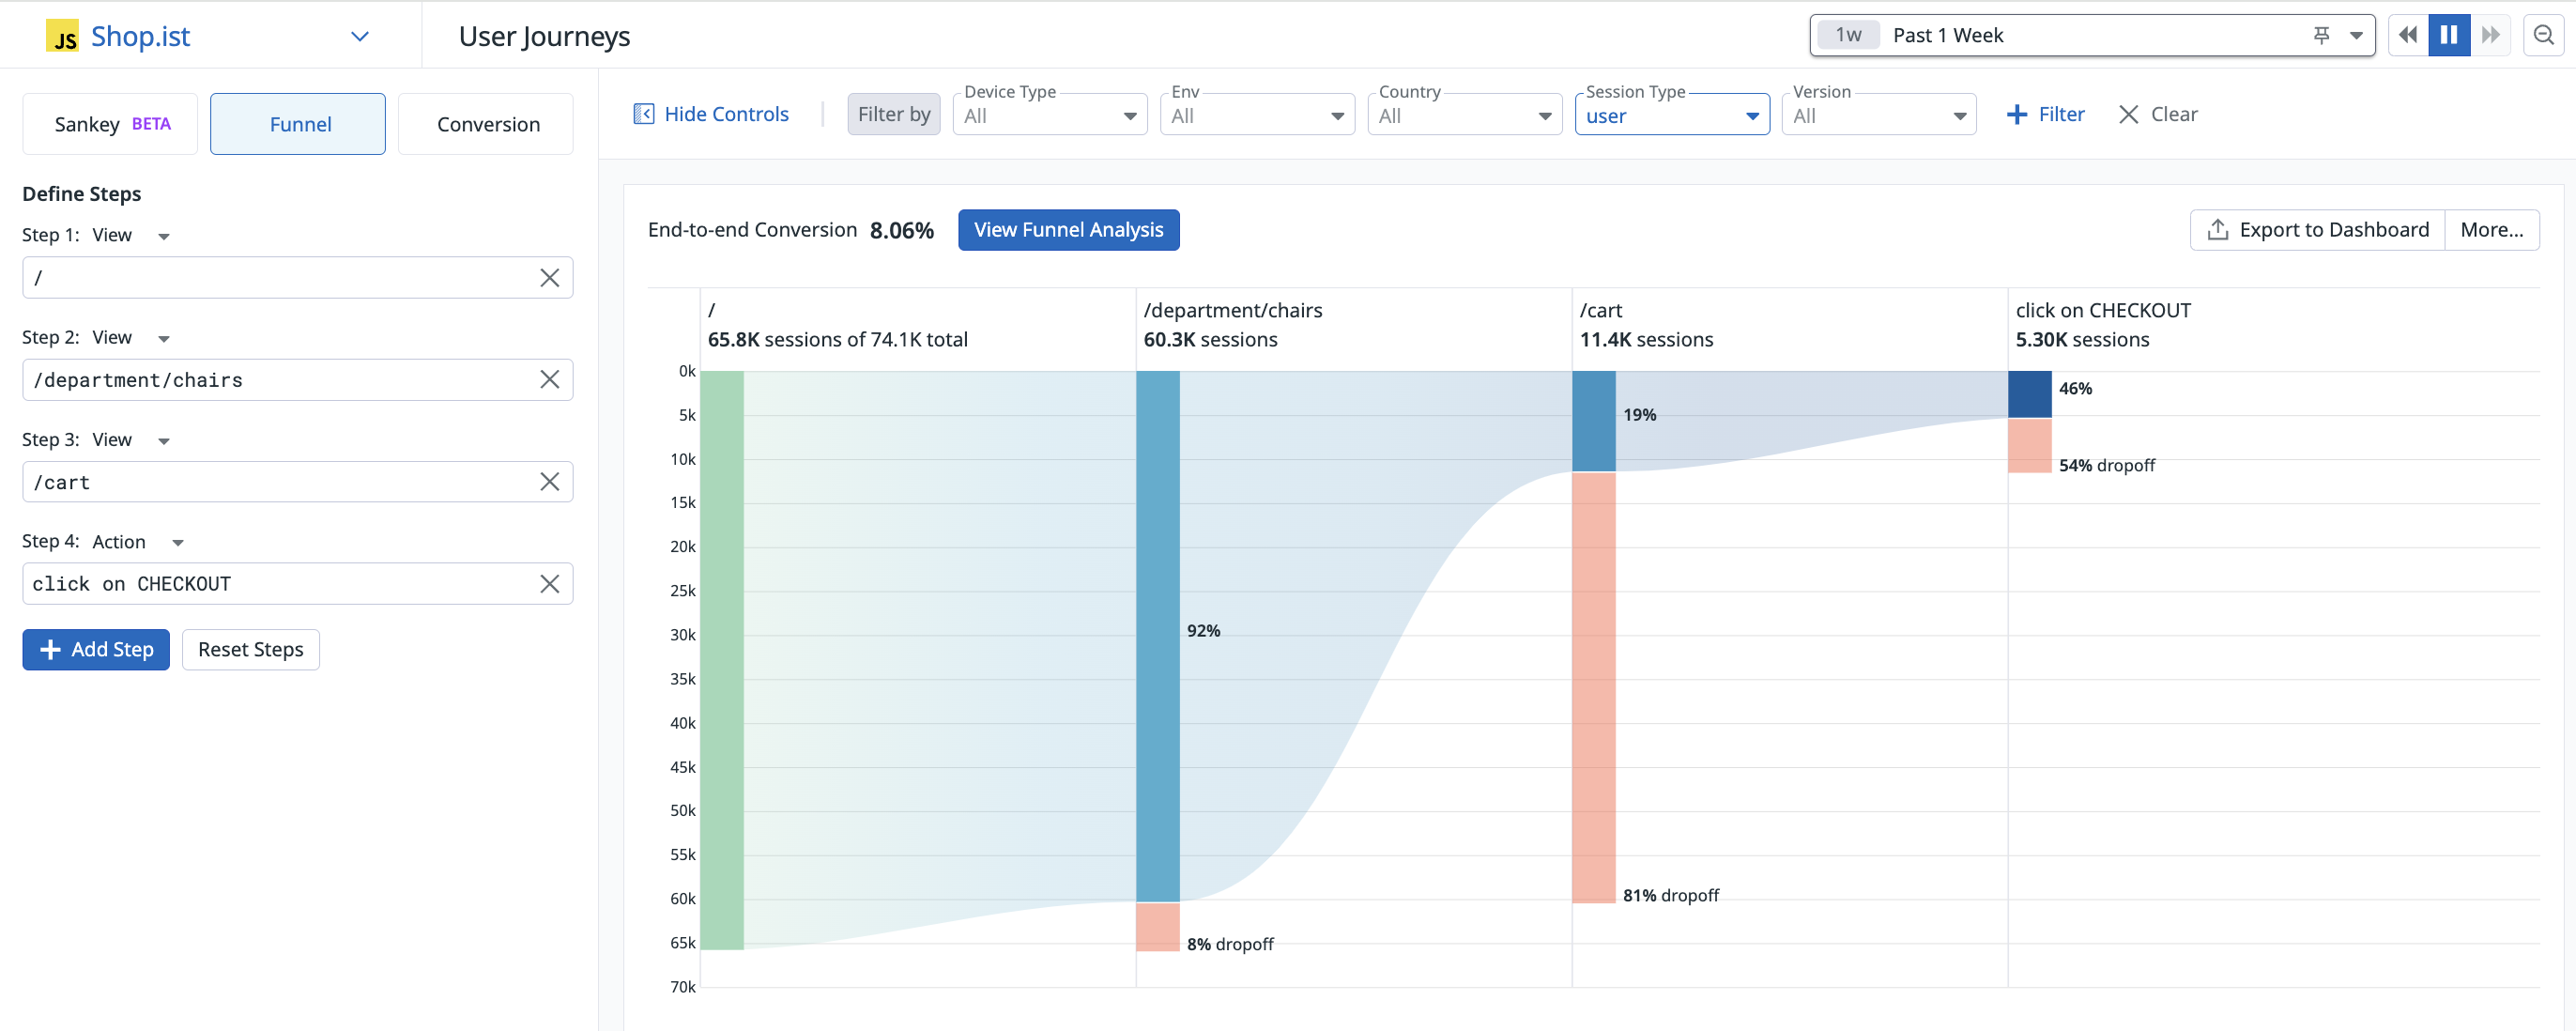
User journeys allow you to measure and report on the impact of every feature change - from backend bottlenecks to user frustrations - so that they can be appropriately optimized. Identify the ideal path for feature adoption and user conversion.
See different visualizations of the user experience when interacting with your application:
- Funnel: Measure the conversion rate end-to-end of a given workflow.
- Sankey: Explore aggregated workflows in a single visualization to aid in answering questions about user journeys.
- Conversion: Track conversion rates over time and compare it against specific attributes that may have affected conversion rates, such as browser type or geography.
Create user segments
Segments are users grouped by specific characteristics or behaviors. Segmentation in Datadog allows you to analyze and understand specific groups or segments of your user base.
Visualize user interactions with heatmaps
Heatmaps visualize the most interacted with elements on a page to see where hot spots of activity are, along with analyzing scroll depth to see how far users scrolled down a given page. You can view every swipe, scroll, and click with a pixel-perfect reproduction of exactly what users went through on both browser and mobile applications to identify high-or low-performing content.


