- 重要な情報
- はじめに
- Datadog
- Datadog サイト
- DevSecOps
- AWS Lambda のサーバーレス
- エージェント
- インテグレーション
- コンテナ
- ダッシュボード
- アラート設定
- ログ管理
- トレーシング
- プロファイラー
- タグ
- API
- Service Catalog
- Session Replay
- Continuous Testing
- Synthetic モニタリング
- Incident Management
- Database Monitoring
- Cloud Security Management
- Cloud SIEM
- Application Security Management
- Workflow Automation
- CI Visibility
- Test Visibility
- Intelligent Test Runner
- Code Analysis
- Learning Center
- Support
- 用語集
- Standard Attributes
- ガイド
- インテグレーション
- エージェント
- OpenTelemetry
- 開発者
- 認可
- DogStatsD
- カスタムチェック
- インテグレーション
- Create an Agent-based Integration
- Create an API Integration
- Create a Log Pipeline
- Integration Assets Reference
- Build a Marketplace Offering
- Create a Tile
- Create an Integration Dashboard
- Create a Recommended Monitor
- Create a Cloud SIEM Detection Rule
- OAuth for Integrations
- Install Agent Integration Developer Tool
- サービスのチェック
- IDE インテグレーション
- コミュニティ
- ガイド
- API
- モバイルアプリケーション
- CoScreen
- Cloudcraft
- アプリ内
- Service Management
- インフラストラクチャー
- アプリケーションパフォーマンス
- APM
- Continuous Profiler
- データベース モニタリング
- Data Streams Monitoring
- Data Jobs Monitoring
- Digital Experience
- Software Delivery
- CI Visibility (CI/CDの可視化)
- CD Visibility
- Test Visibility
- Intelligent Test Runner
- Code Analysis
- Quality Gates
- DORA Metrics
- セキュリティ
- セキュリティの概要
- Cloud SIEM
- クラウド セキュリティ マネジメント
- Application Security Management
- AI Observability
- ログ管理
- Observability Pipelines(観測データの制御)
- ログ管理
- 管理
Enhancing Developer Workflows with Datadog
このページは日本語には対応しておりません。随時翻訳に取り組んでいます。翻訳に関してご質問やご意見ございましたら、お気軽にご連絡ください。
Overview
Test Optimization is not available in the selected site () at this time.
Test Optimization integrates with other developer-oriented Datadog products as well as external partners such as GitHub to streamline developer workflows with features including being able to:
- Enable test summaries in GitHub pull request comments
- Create and open GitHub issues
- Create Jira issues through Case Management
- Open tests in GitHub and your IDE
These features are available for all Test Optimization customers, and they do not require usage of the Datadog GitHub integration.
Test summaries in GitHub pull requests
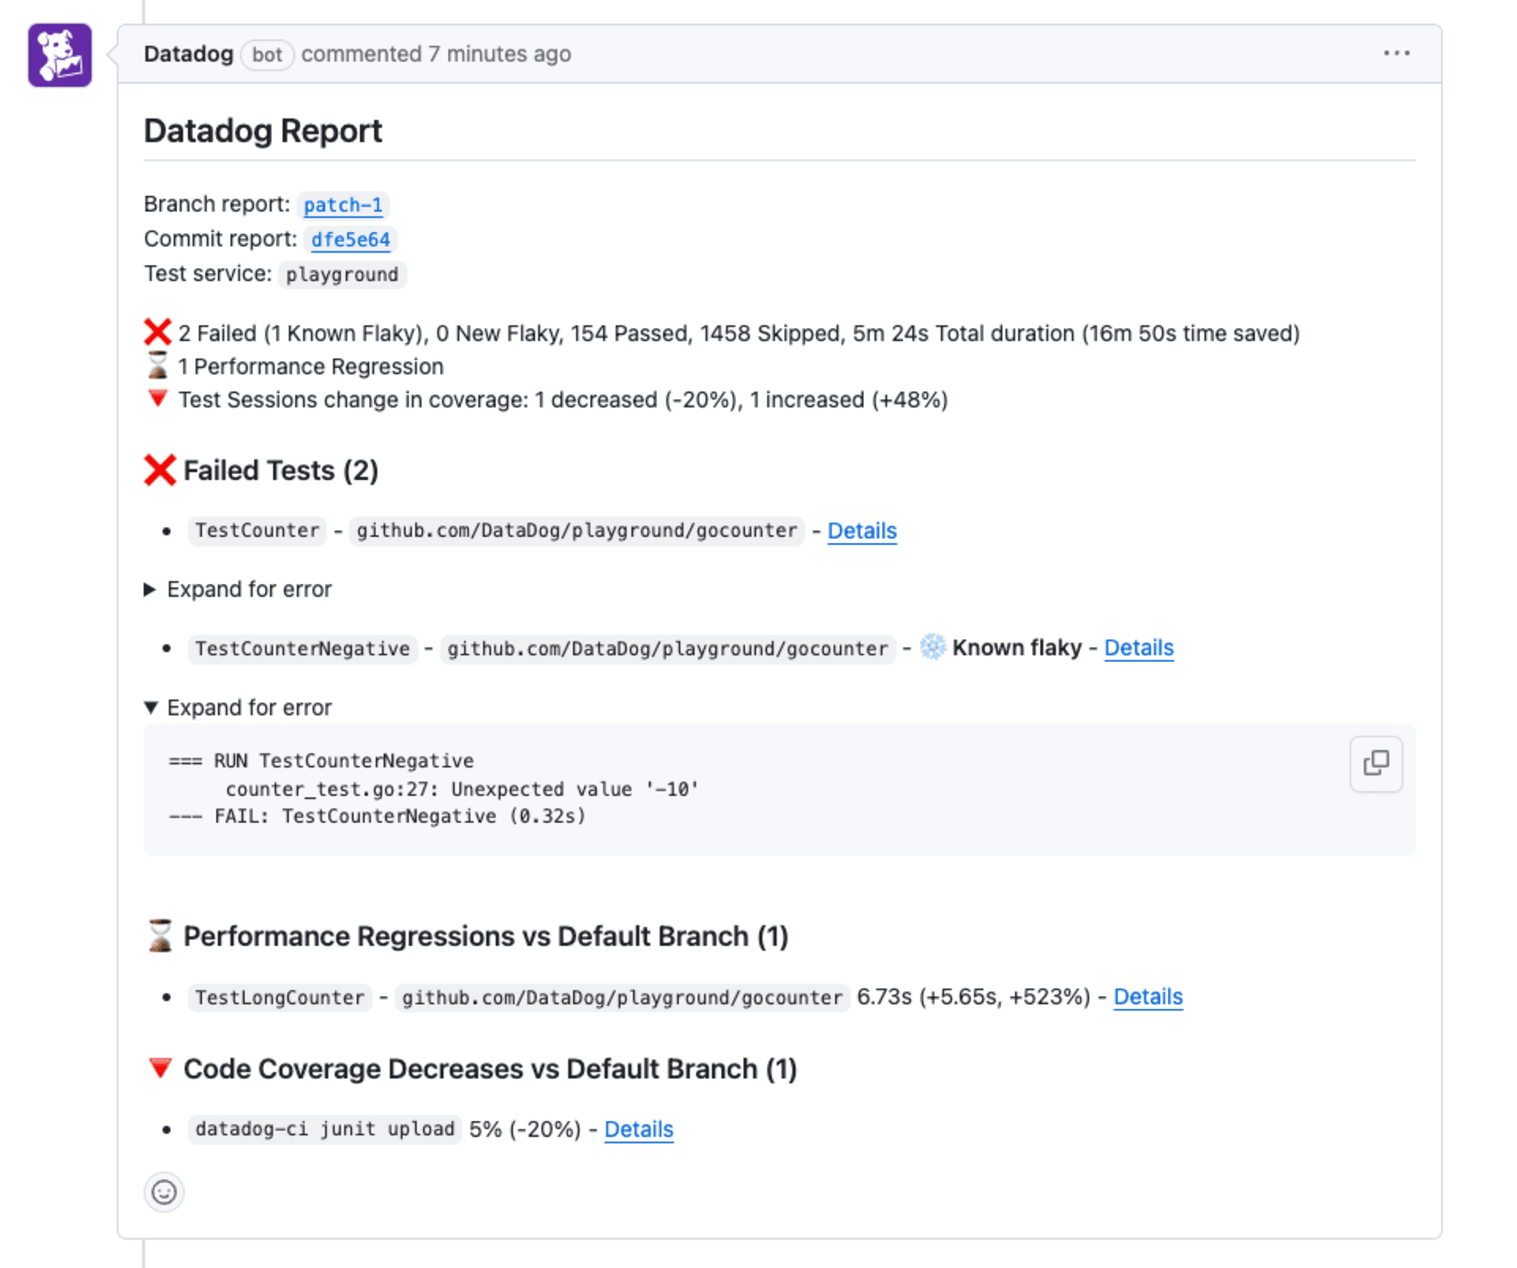
Datadog integrates with GitHub to show summaries of test results directly in your pull request comments. Each summary contains an overview of the tests executions, flakiness information, error messages for failed tests, performance regressions, and code coverage changes.
With this information, developers get instant feedback about their tests results, and they can debug any failed or flaky tests without leaving the pull request view.
This integration is only available for test services hosted on `github.com`.
Enable test summaries
You can enable test summaries in pull requests with the following steps:
- Install the GitHub integration:
- Navigate to the Configuration tab on the GitHub integration tile and click + Create GitHub App.
- Give the application read and write permissions for pull requests.
- Enable test summaries for one or more test services. You can do this from the Test Service Settings page or from the commit/branch page.
Test service settings page
- Navigate to the Test Service Settings page and search for the test service you want to enable. You can also search by repository.
- For the desired service, enable the toggle under the GitHub Comments column.
Commit or branch page
- Go to the test service commit or branch page where you want to enable GitHub comments.
- Click on the Settings icon and click View Test Service Settings.
- Select Enable GitHub Comments so that comments display on new pull requests. This change may take a few minutes.
Comments only appear on pull requests that were opened before the test run and that have run at least one test for an enabled test service.
Create and open GitHub issues
With Test Optimization, you can create and open pre-filled GitHub issues with relevant context into your tests as well as deep links back to Datadog for more streamlined debugging workflows. Creating issues directly from Test Optimization can help you track and maintain accountability for test failures and flaky tests.
In-app entry points
You can create pre-filled GitHub issues from three areas within Test Optimization:
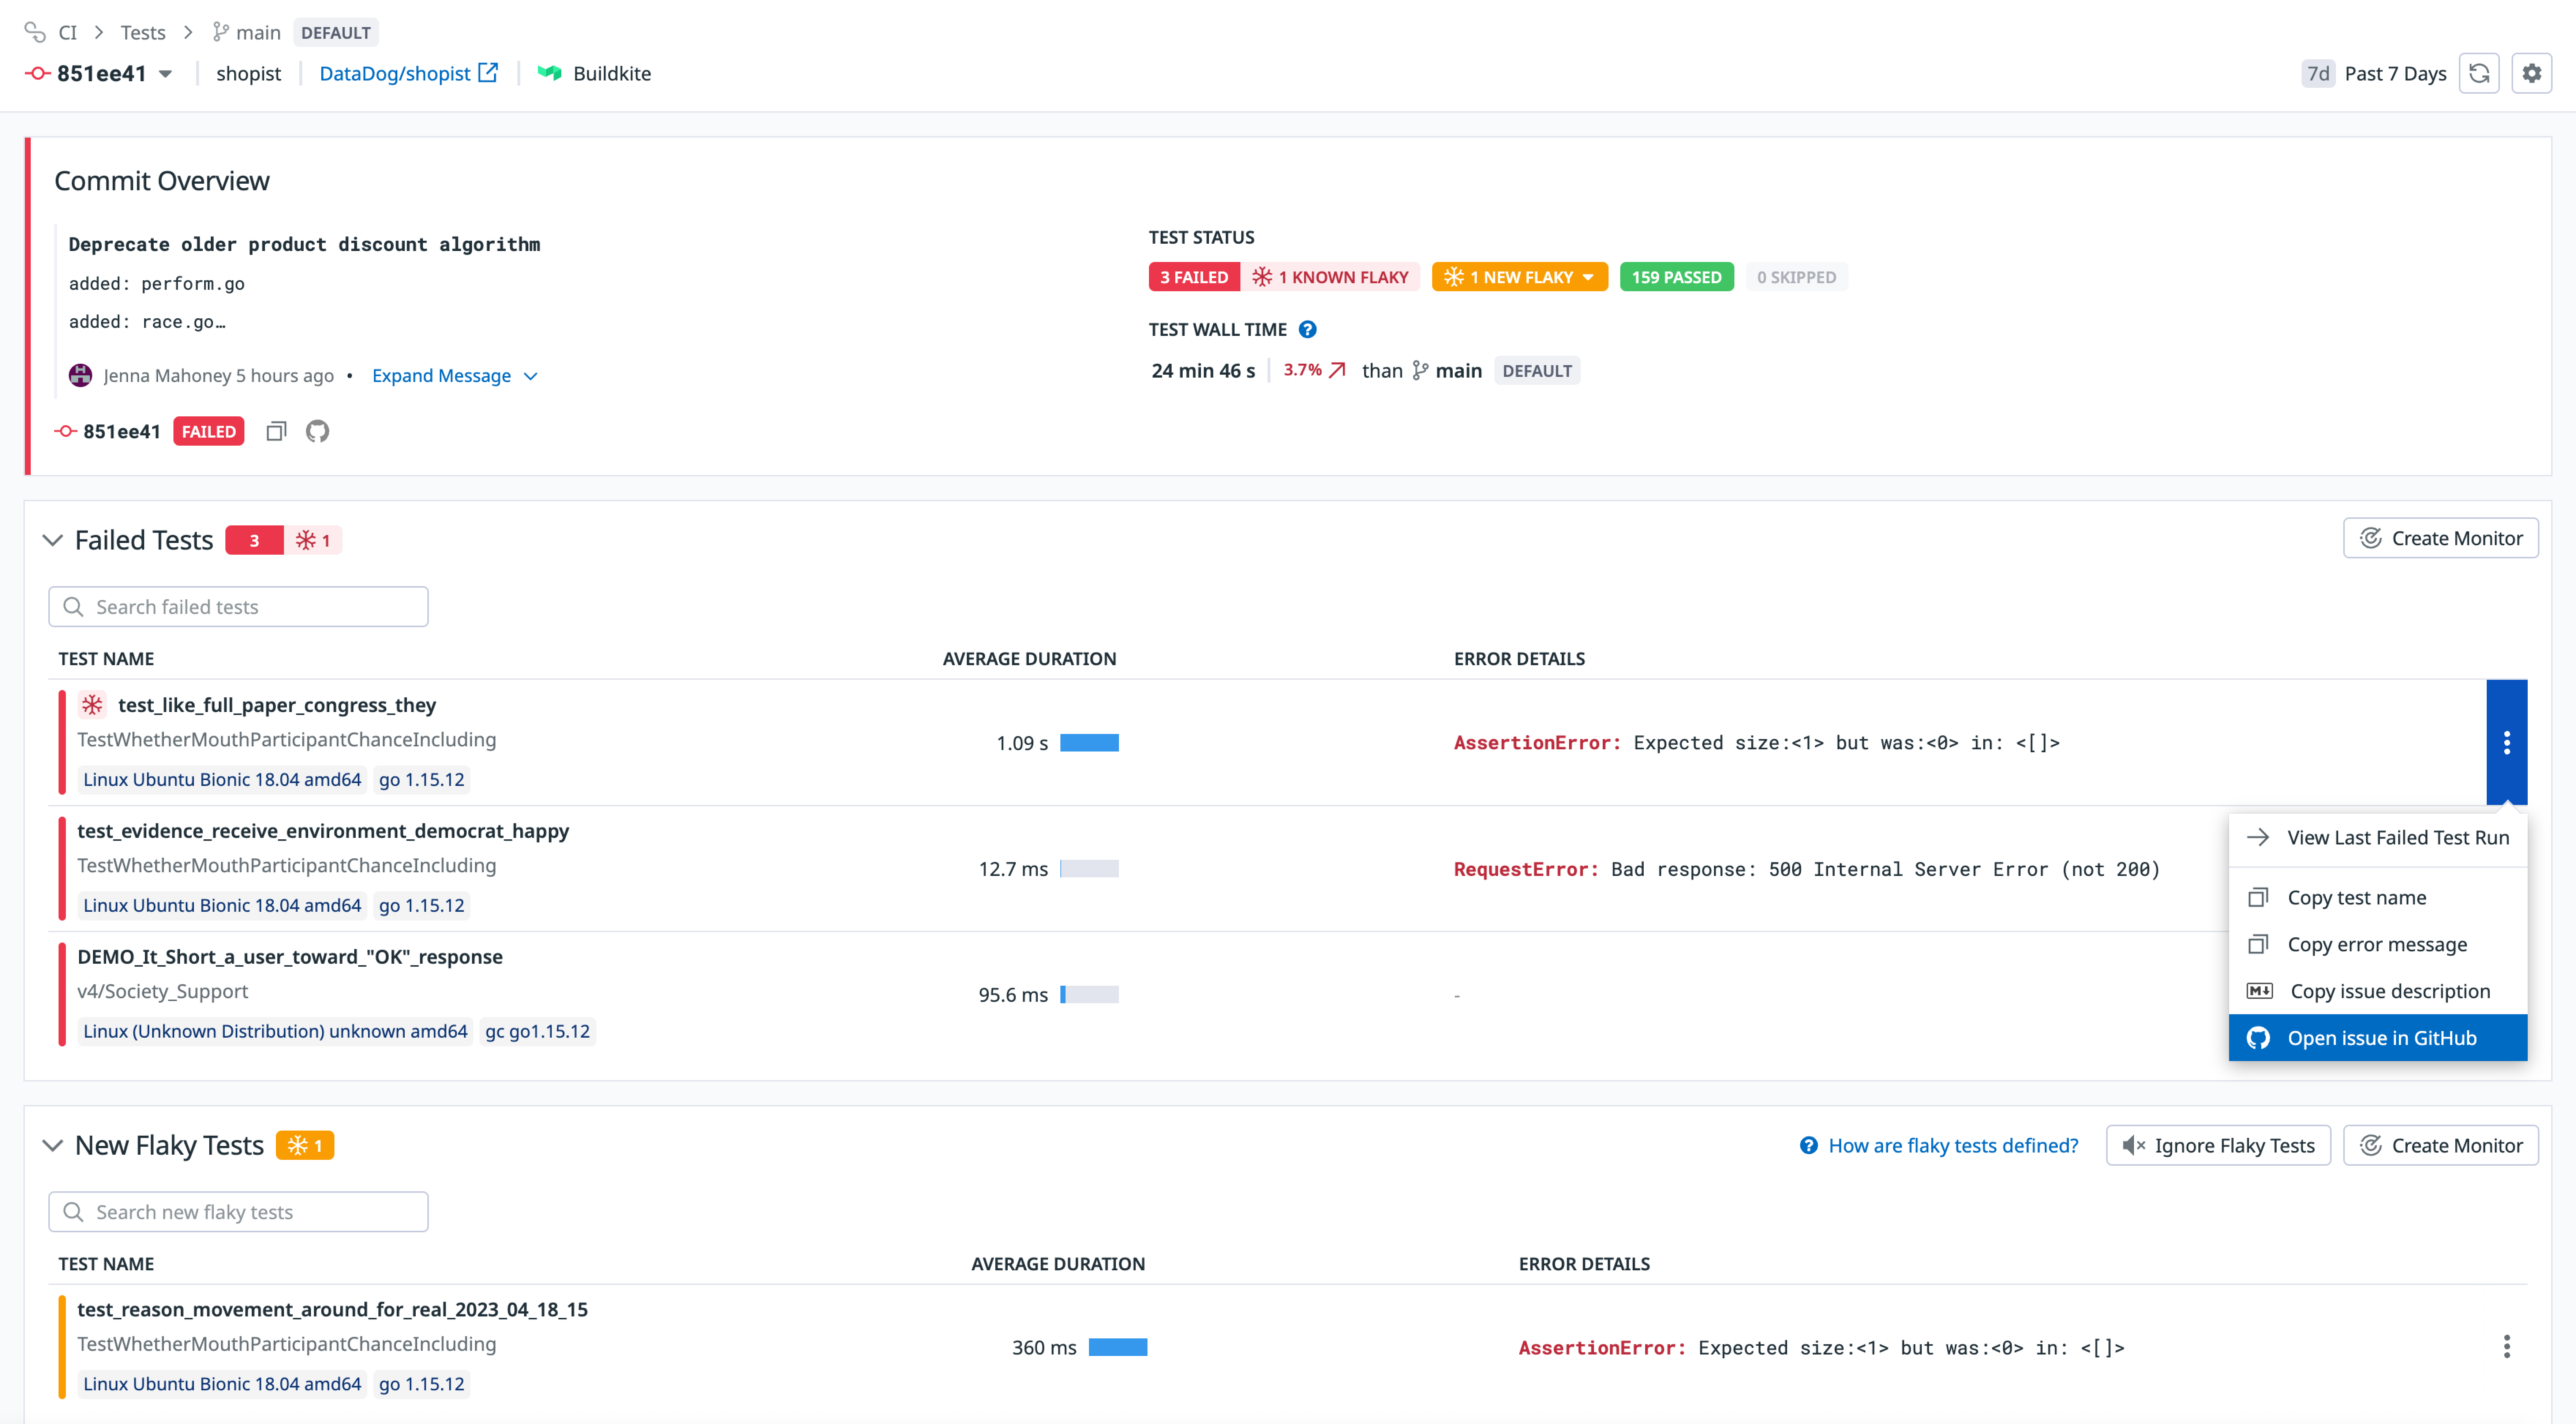
Commit Overview
The overview page for any commit can be discovered through a particular branch or from within any particular test.
From the Commit Overview page, click on any row in the Failed Tests or New Flaky Tests tables and select Open issue in GitHub.
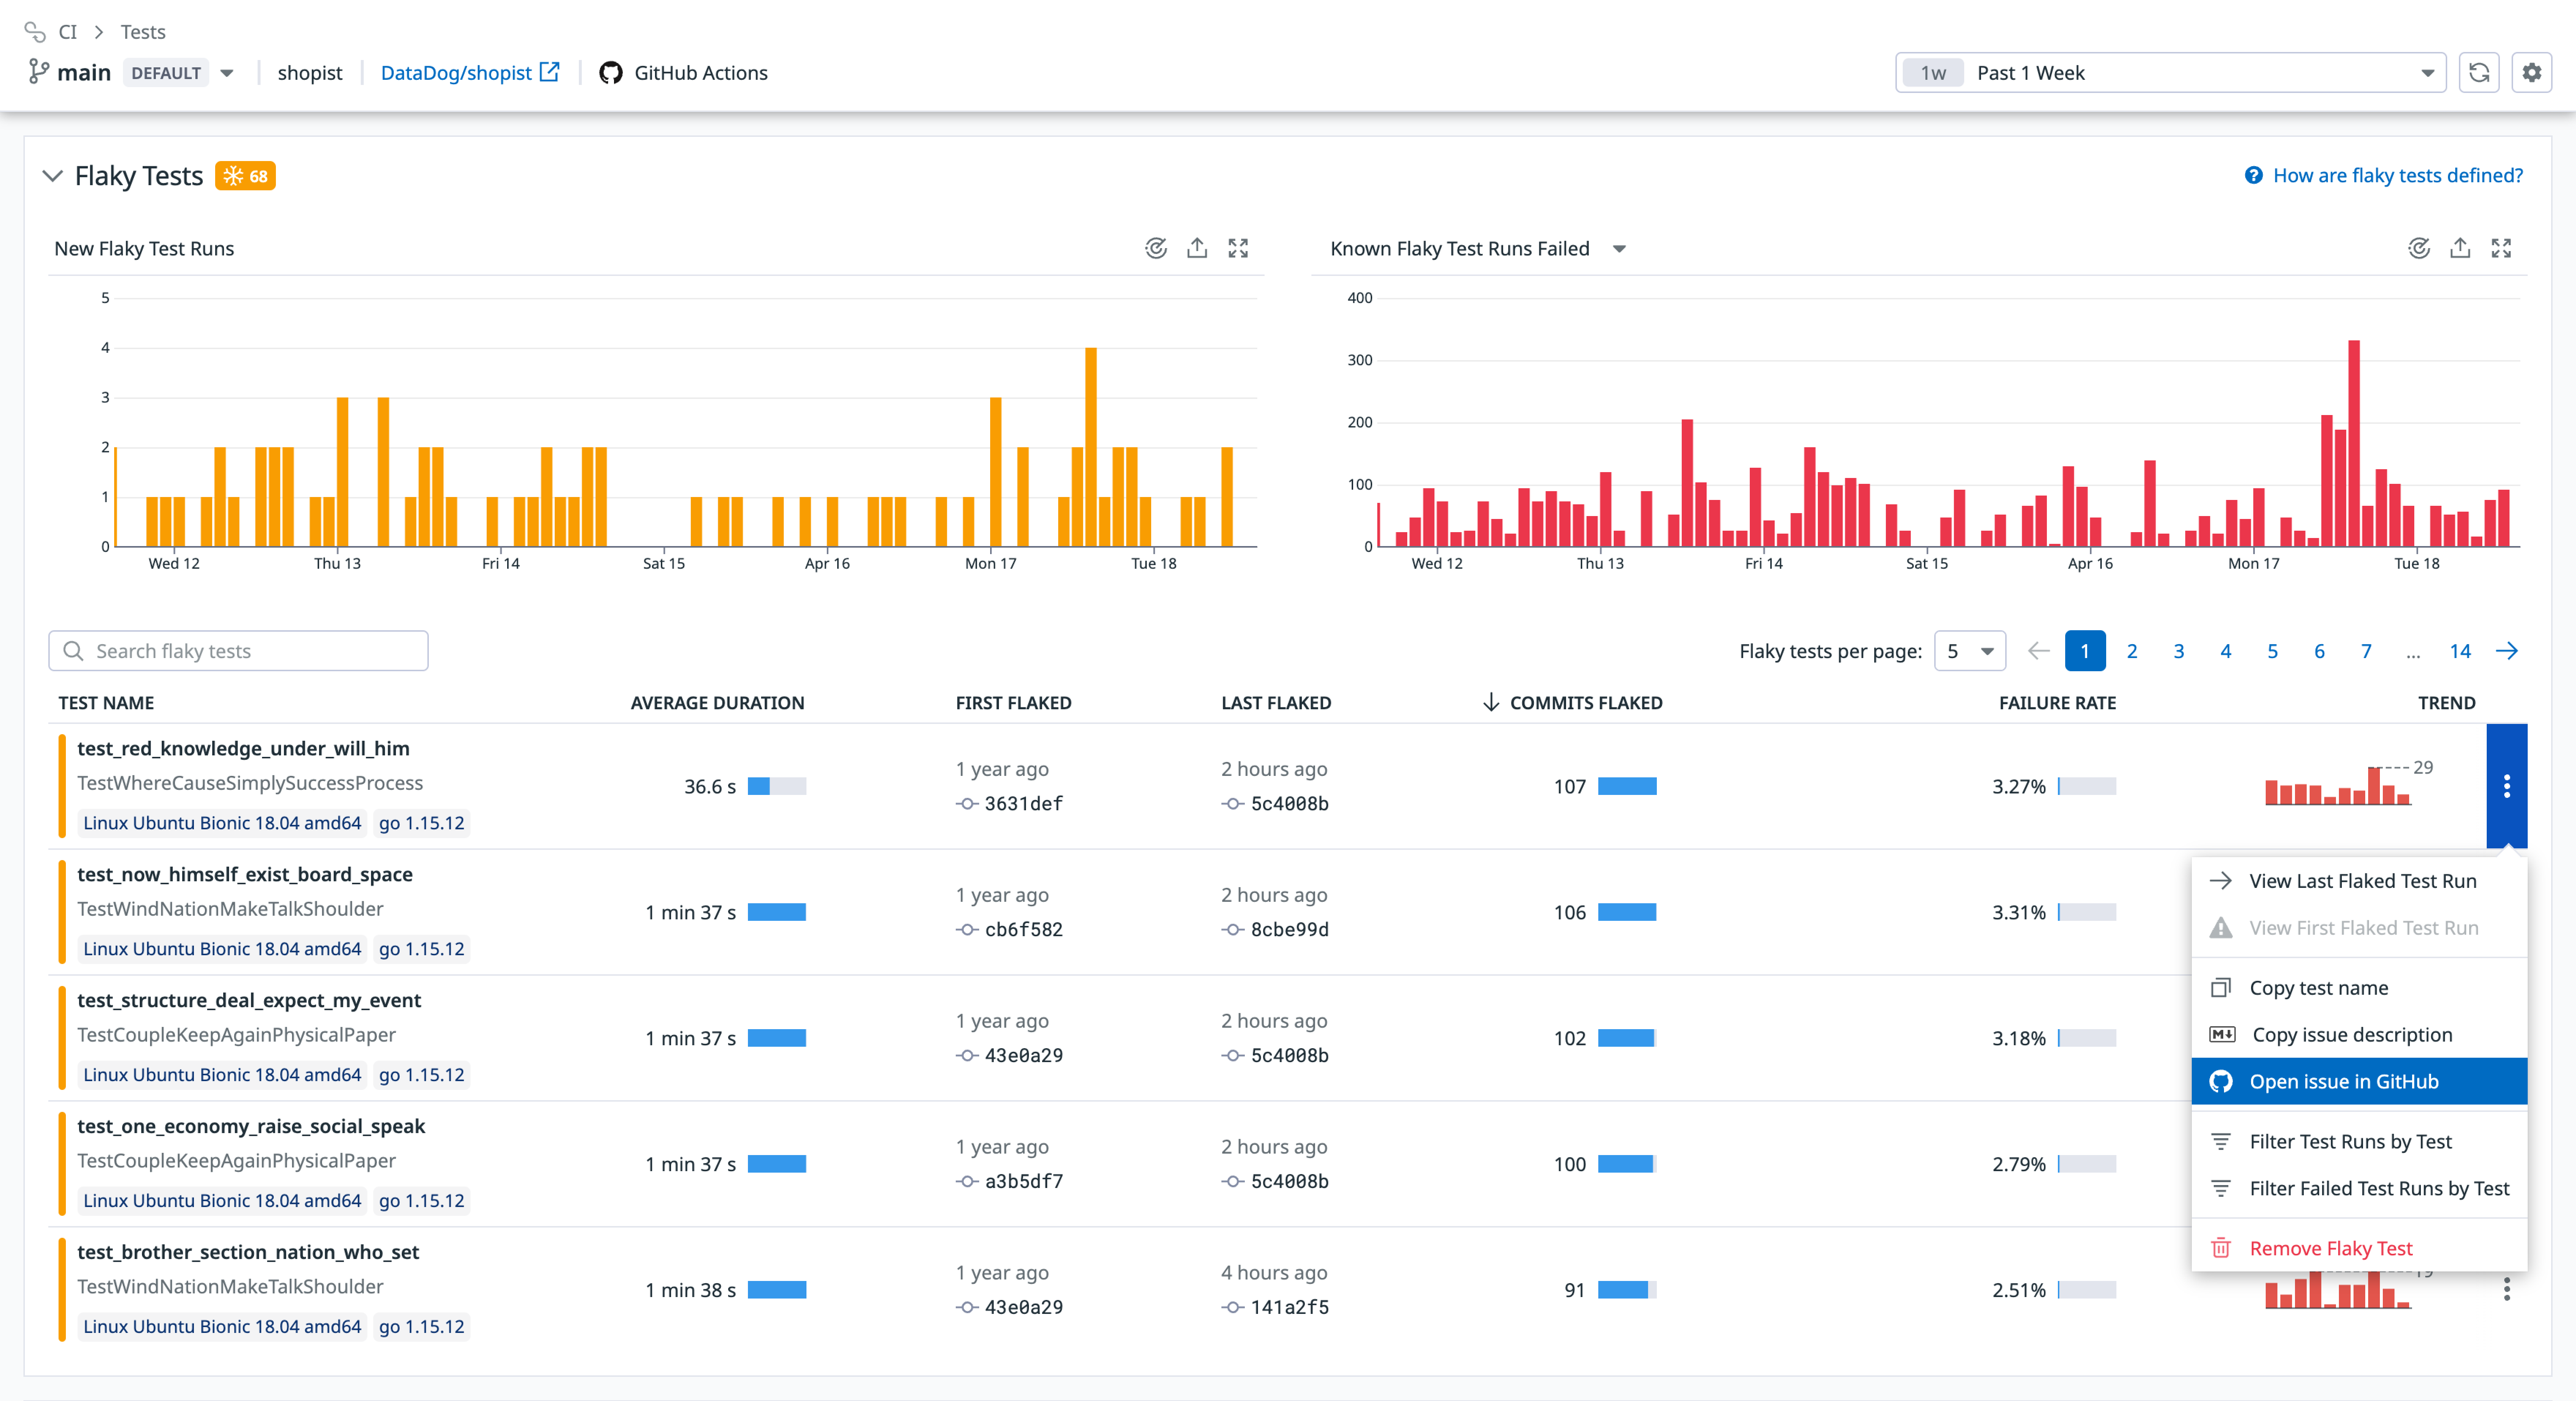
Branch Overview
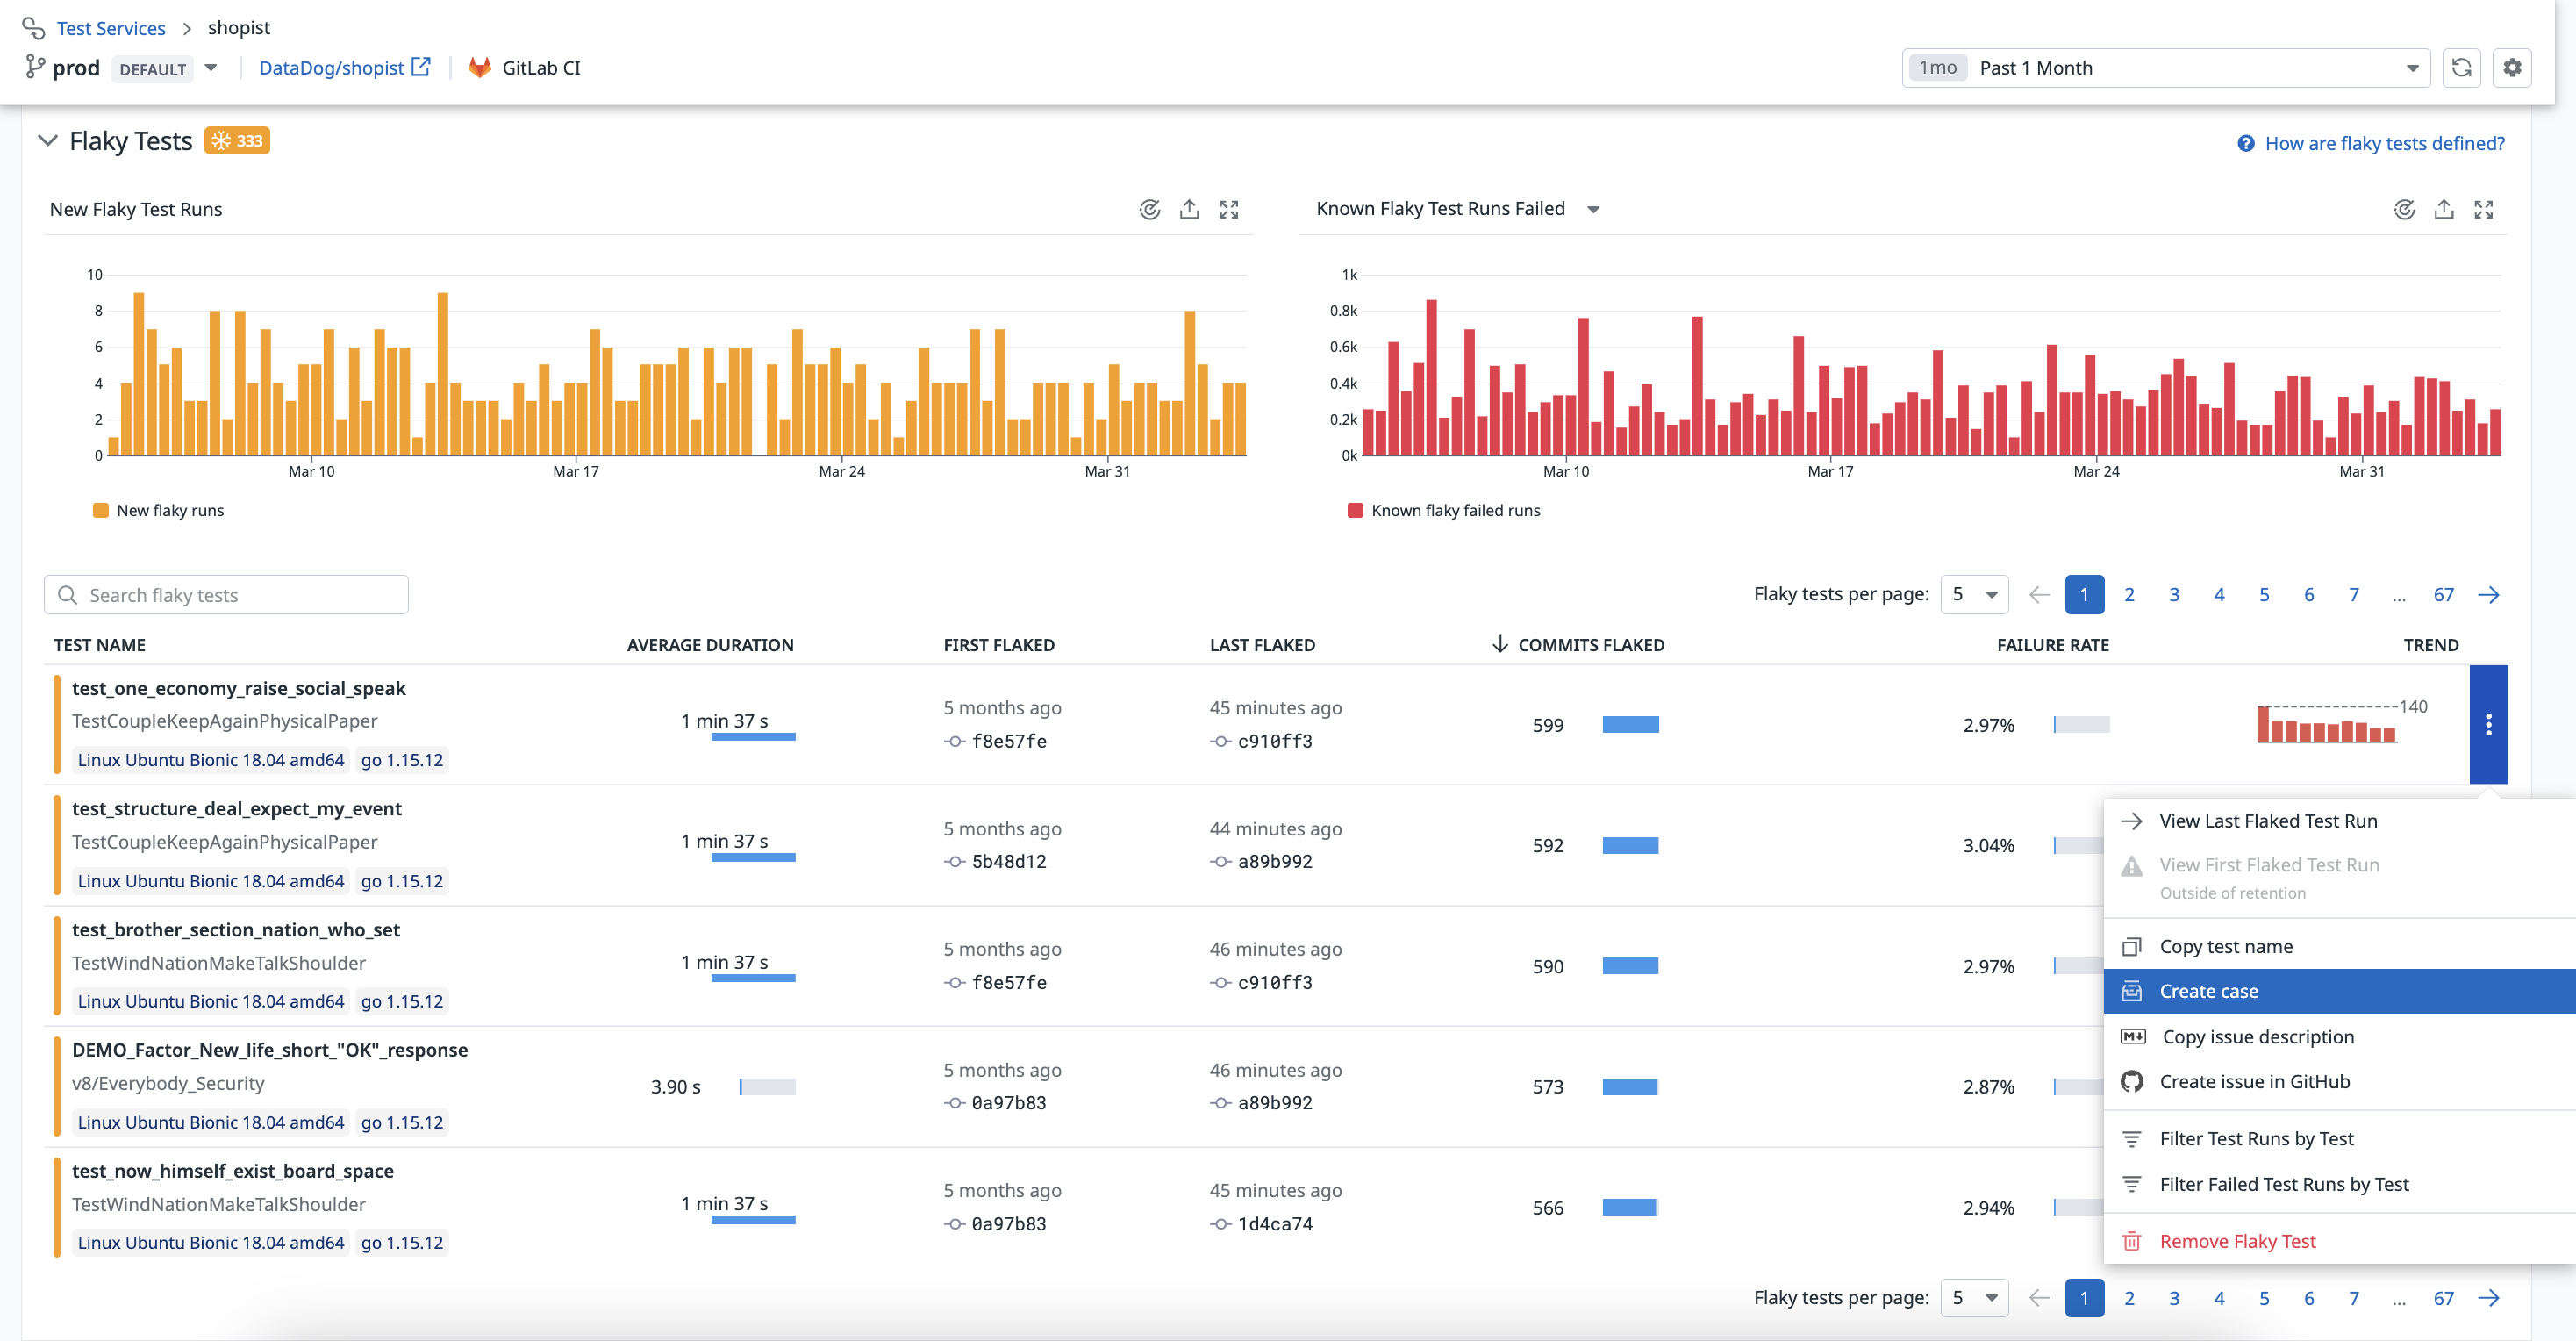
From this page, click on any row in the Flaky Tests table and select Open issue in GitHub.
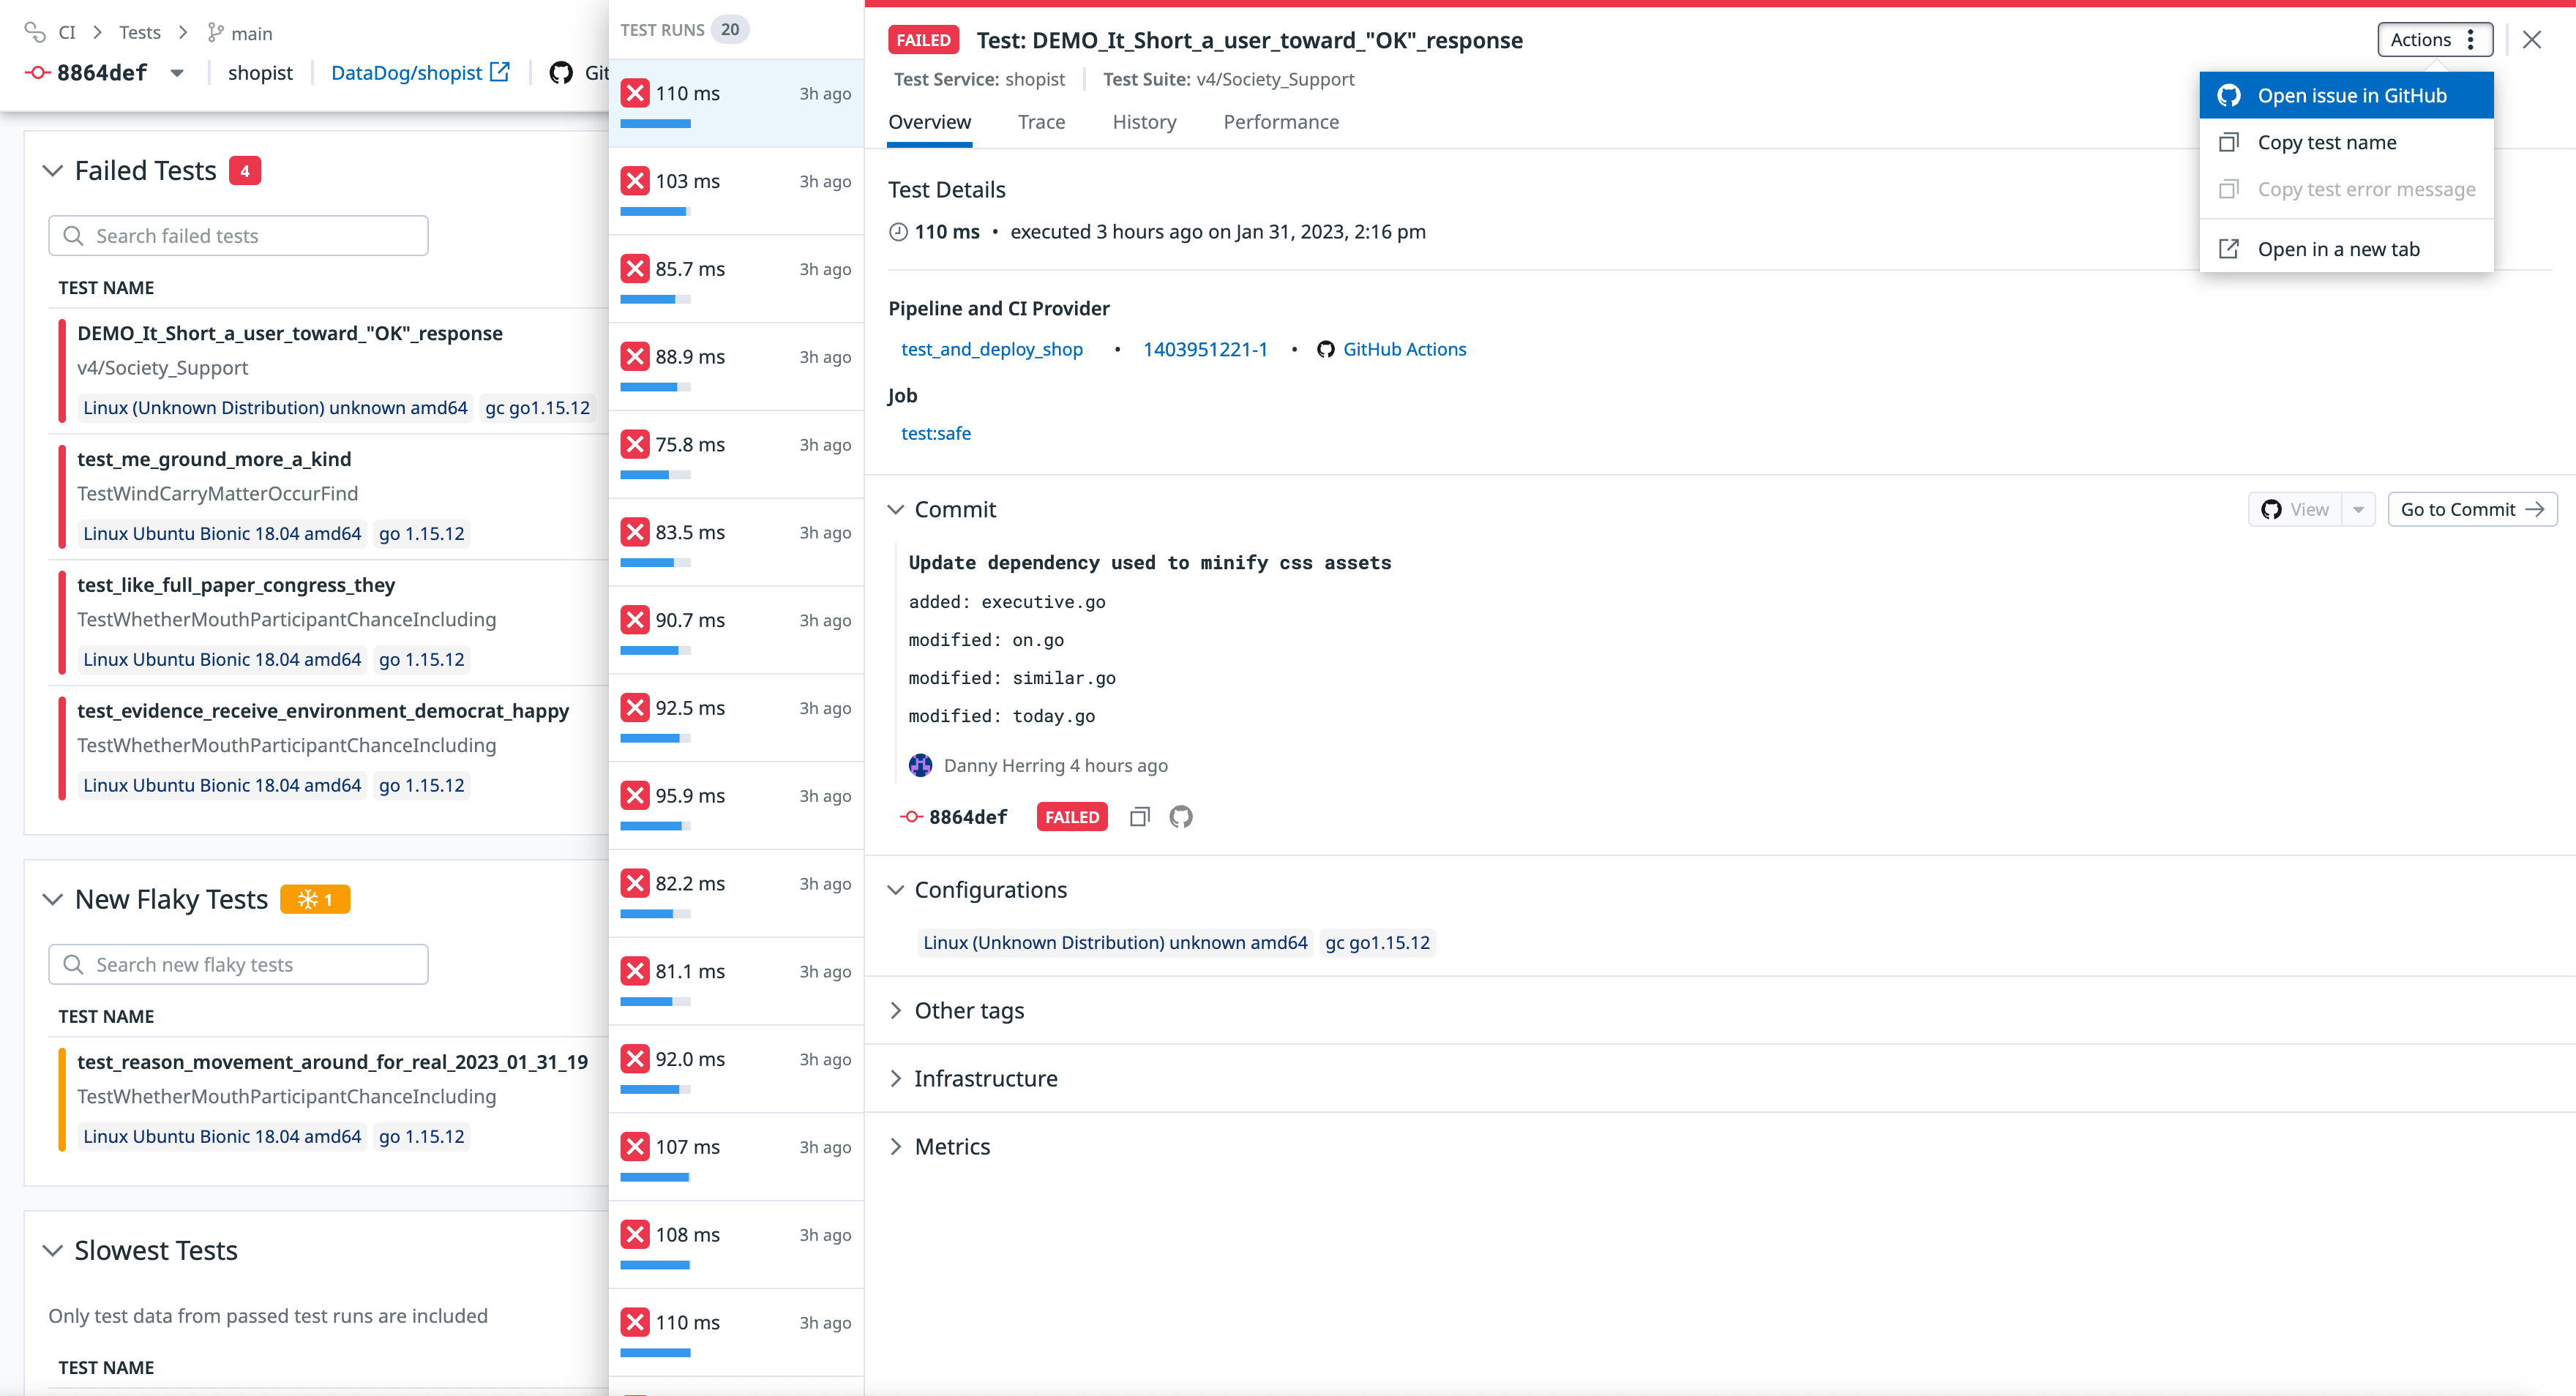
Test Details View
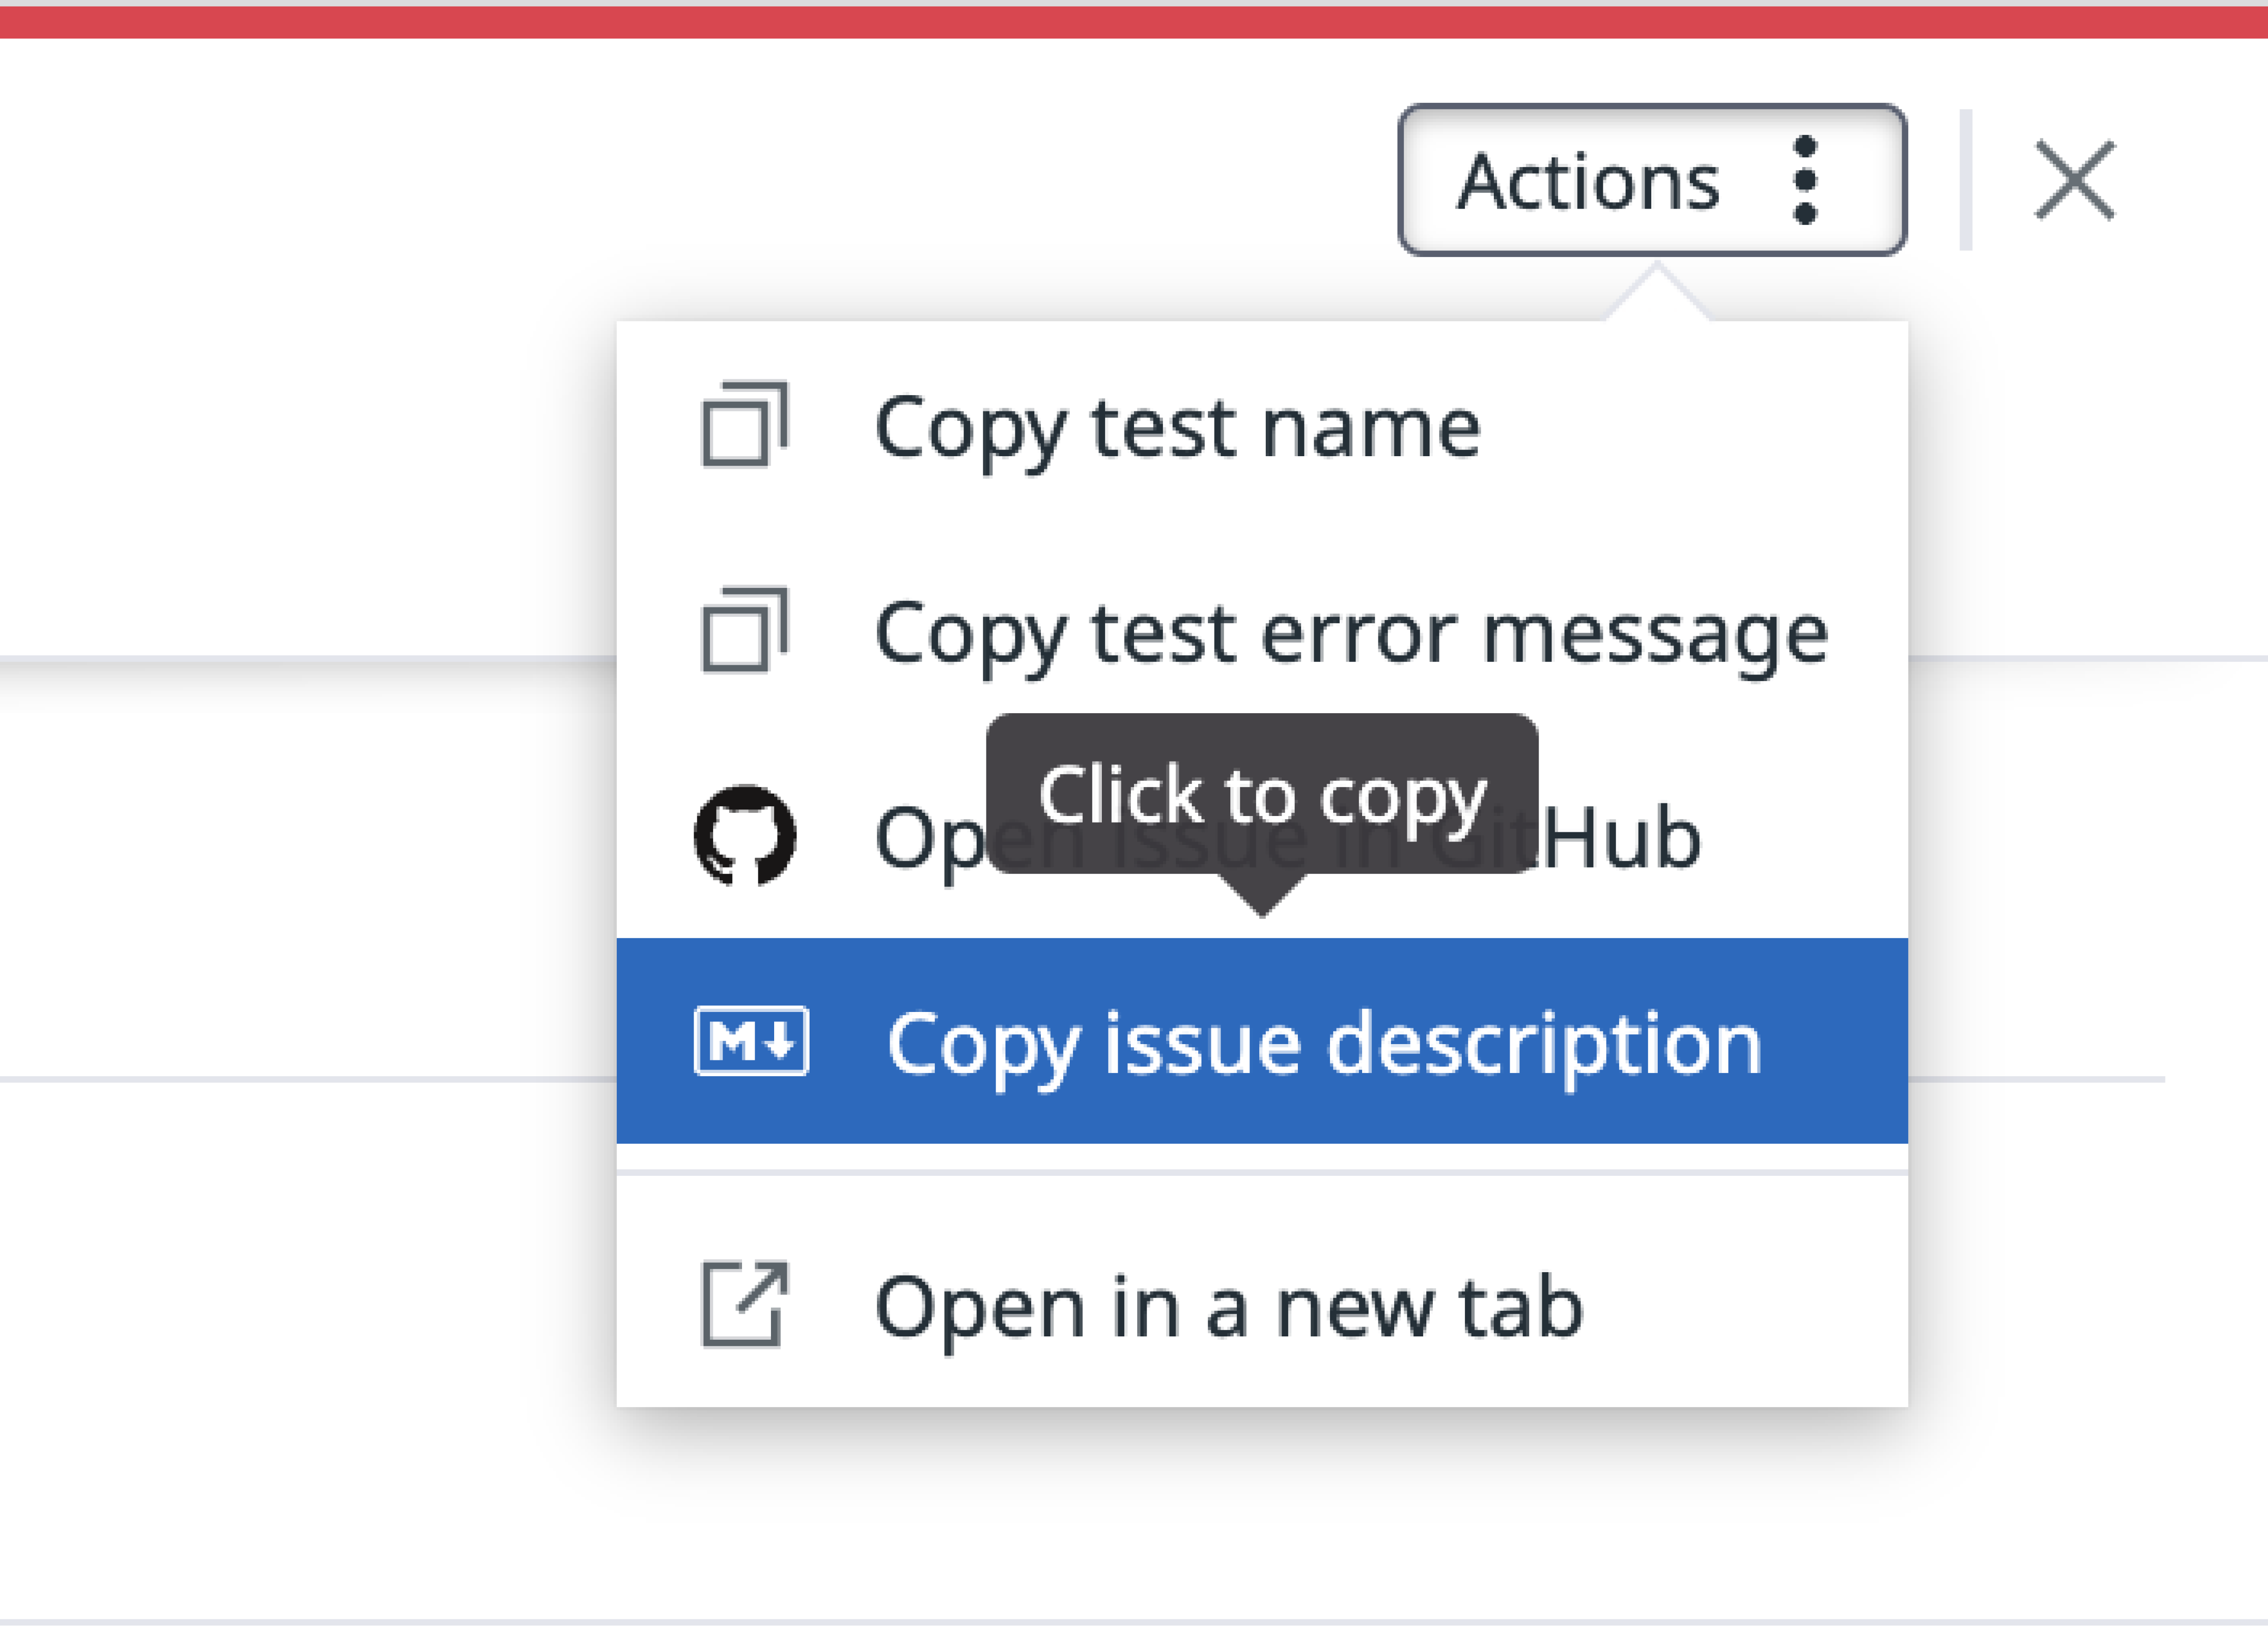
From within a specific test run, click the Actions button and select Open issue in GitHub.
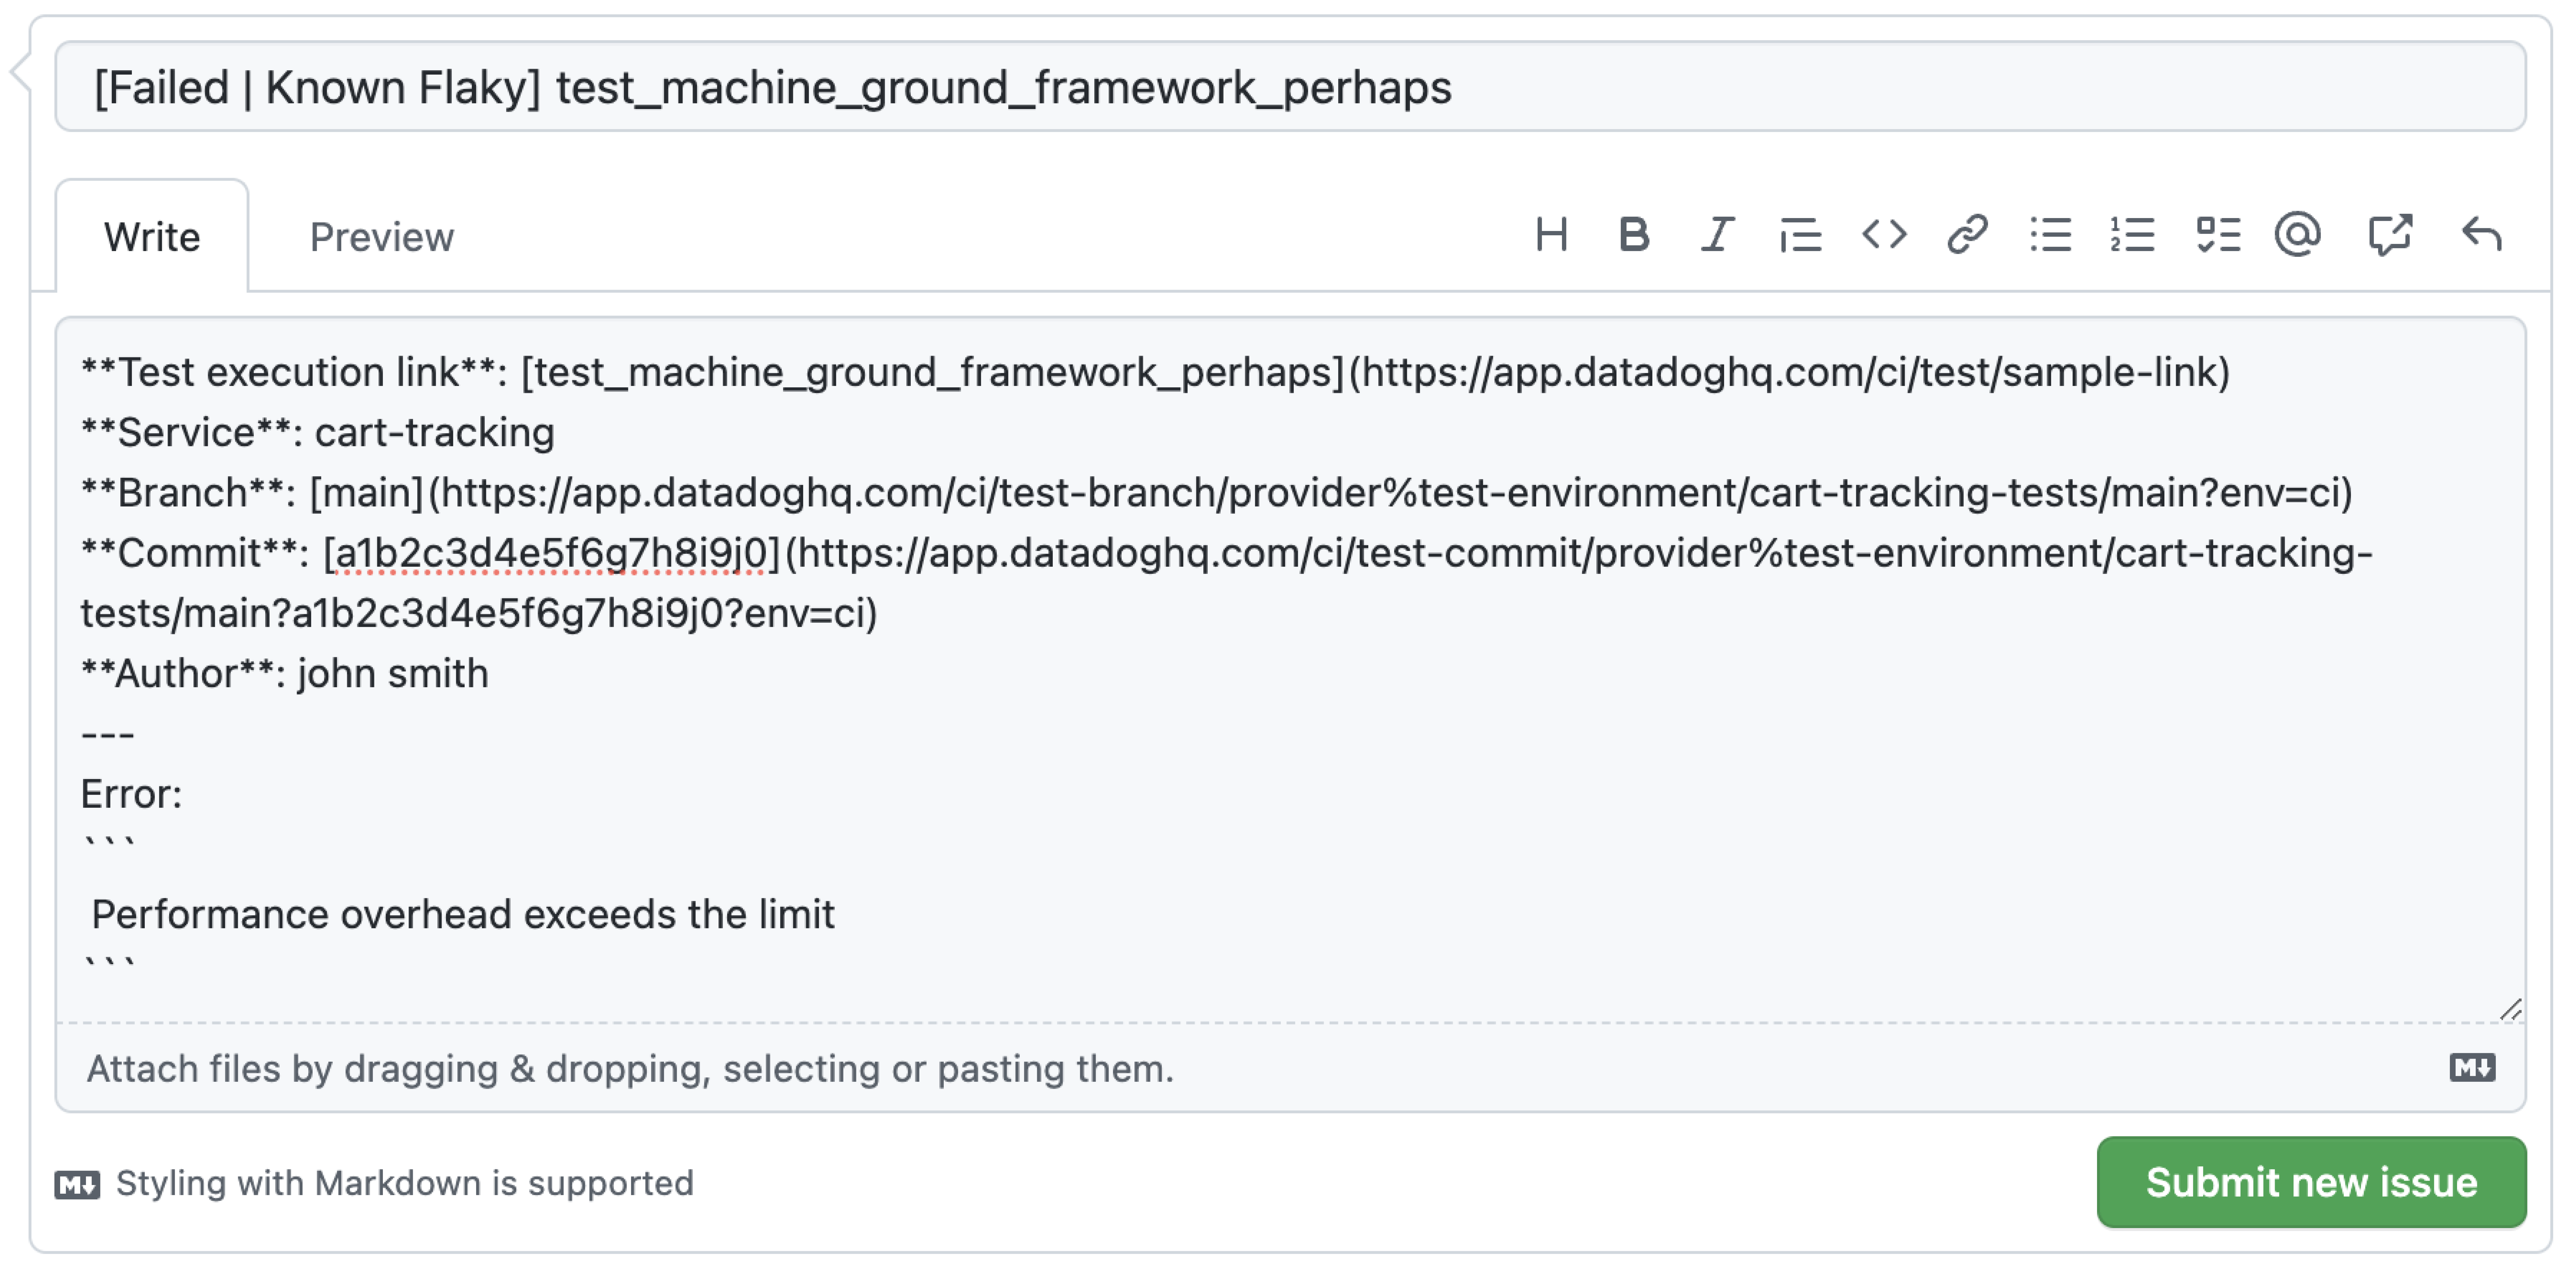
You also have the option to copy an issue description in Markdown for pasting test details elsewhere. The Markdown description contains information such as the test execution link, service, branch, commit, author, and error.
Sample GitHub issue
Below is what a pre-filled GitHub issue might look like:
Create Jira issues
With Case Management, you can create and open pre-filled Jira issues that contain relevant context related to your tests, as well as deep links back to Datadog for more streamlined debugging workflows. Creating issues directly from Test Optimization can help you track and maintain accountability for test failures and flaky tests.
When you update the status of a Jira issue, the status in Case Management updates and reflects the latest case status.
In-app entry points
After you have set up the Jira integration, you can create cases from three areas within Test Optimization:
You can manually create a Jira issue from a case in Case Management by clicking Shift + J.
Commit Overview
The overview page for any commit can be discovered through a particular branch or from within any particular test.
From the Commit Overview page, click on any row in the Failed Tests or New Flaky Tests tables and select Create case.
Branch Overview
From this page, click on any row in the Flaky Tests table and select Create case.
Test Runs View
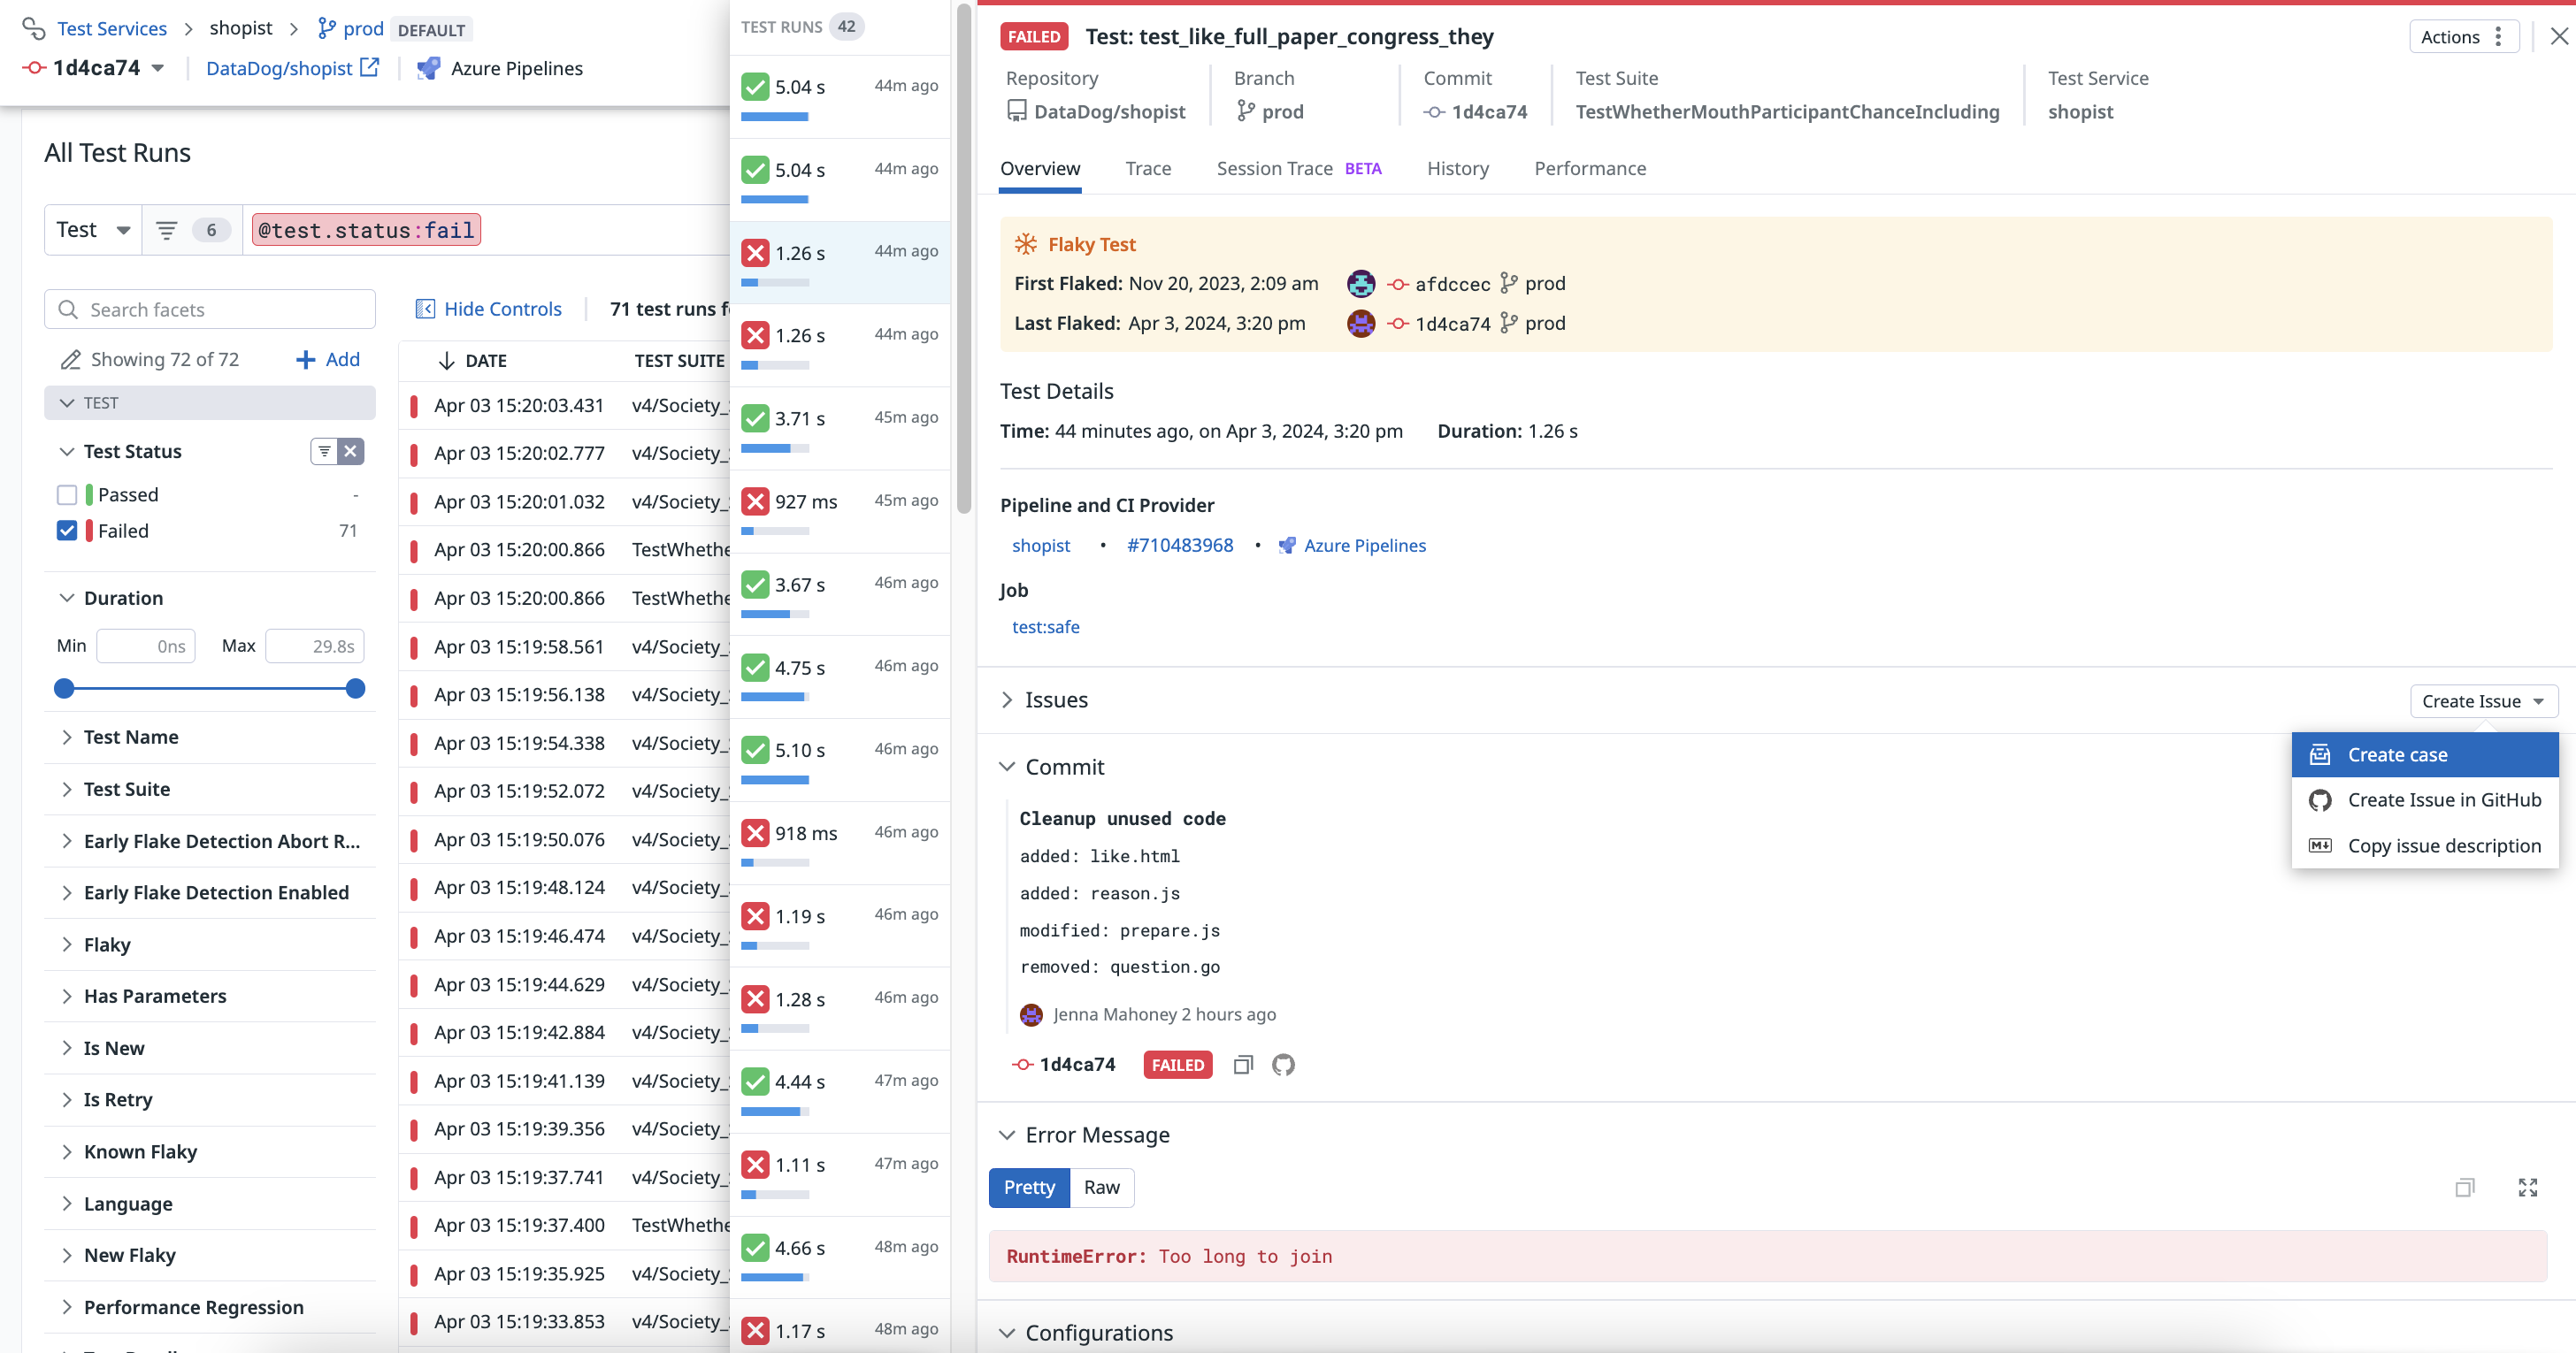
From within a specific test run, click the Actions button and select Create case.
For more information about configuring the Jira integration, see the Case Management documentation.
Open tests in GitHub and your IDE
In-app entry points
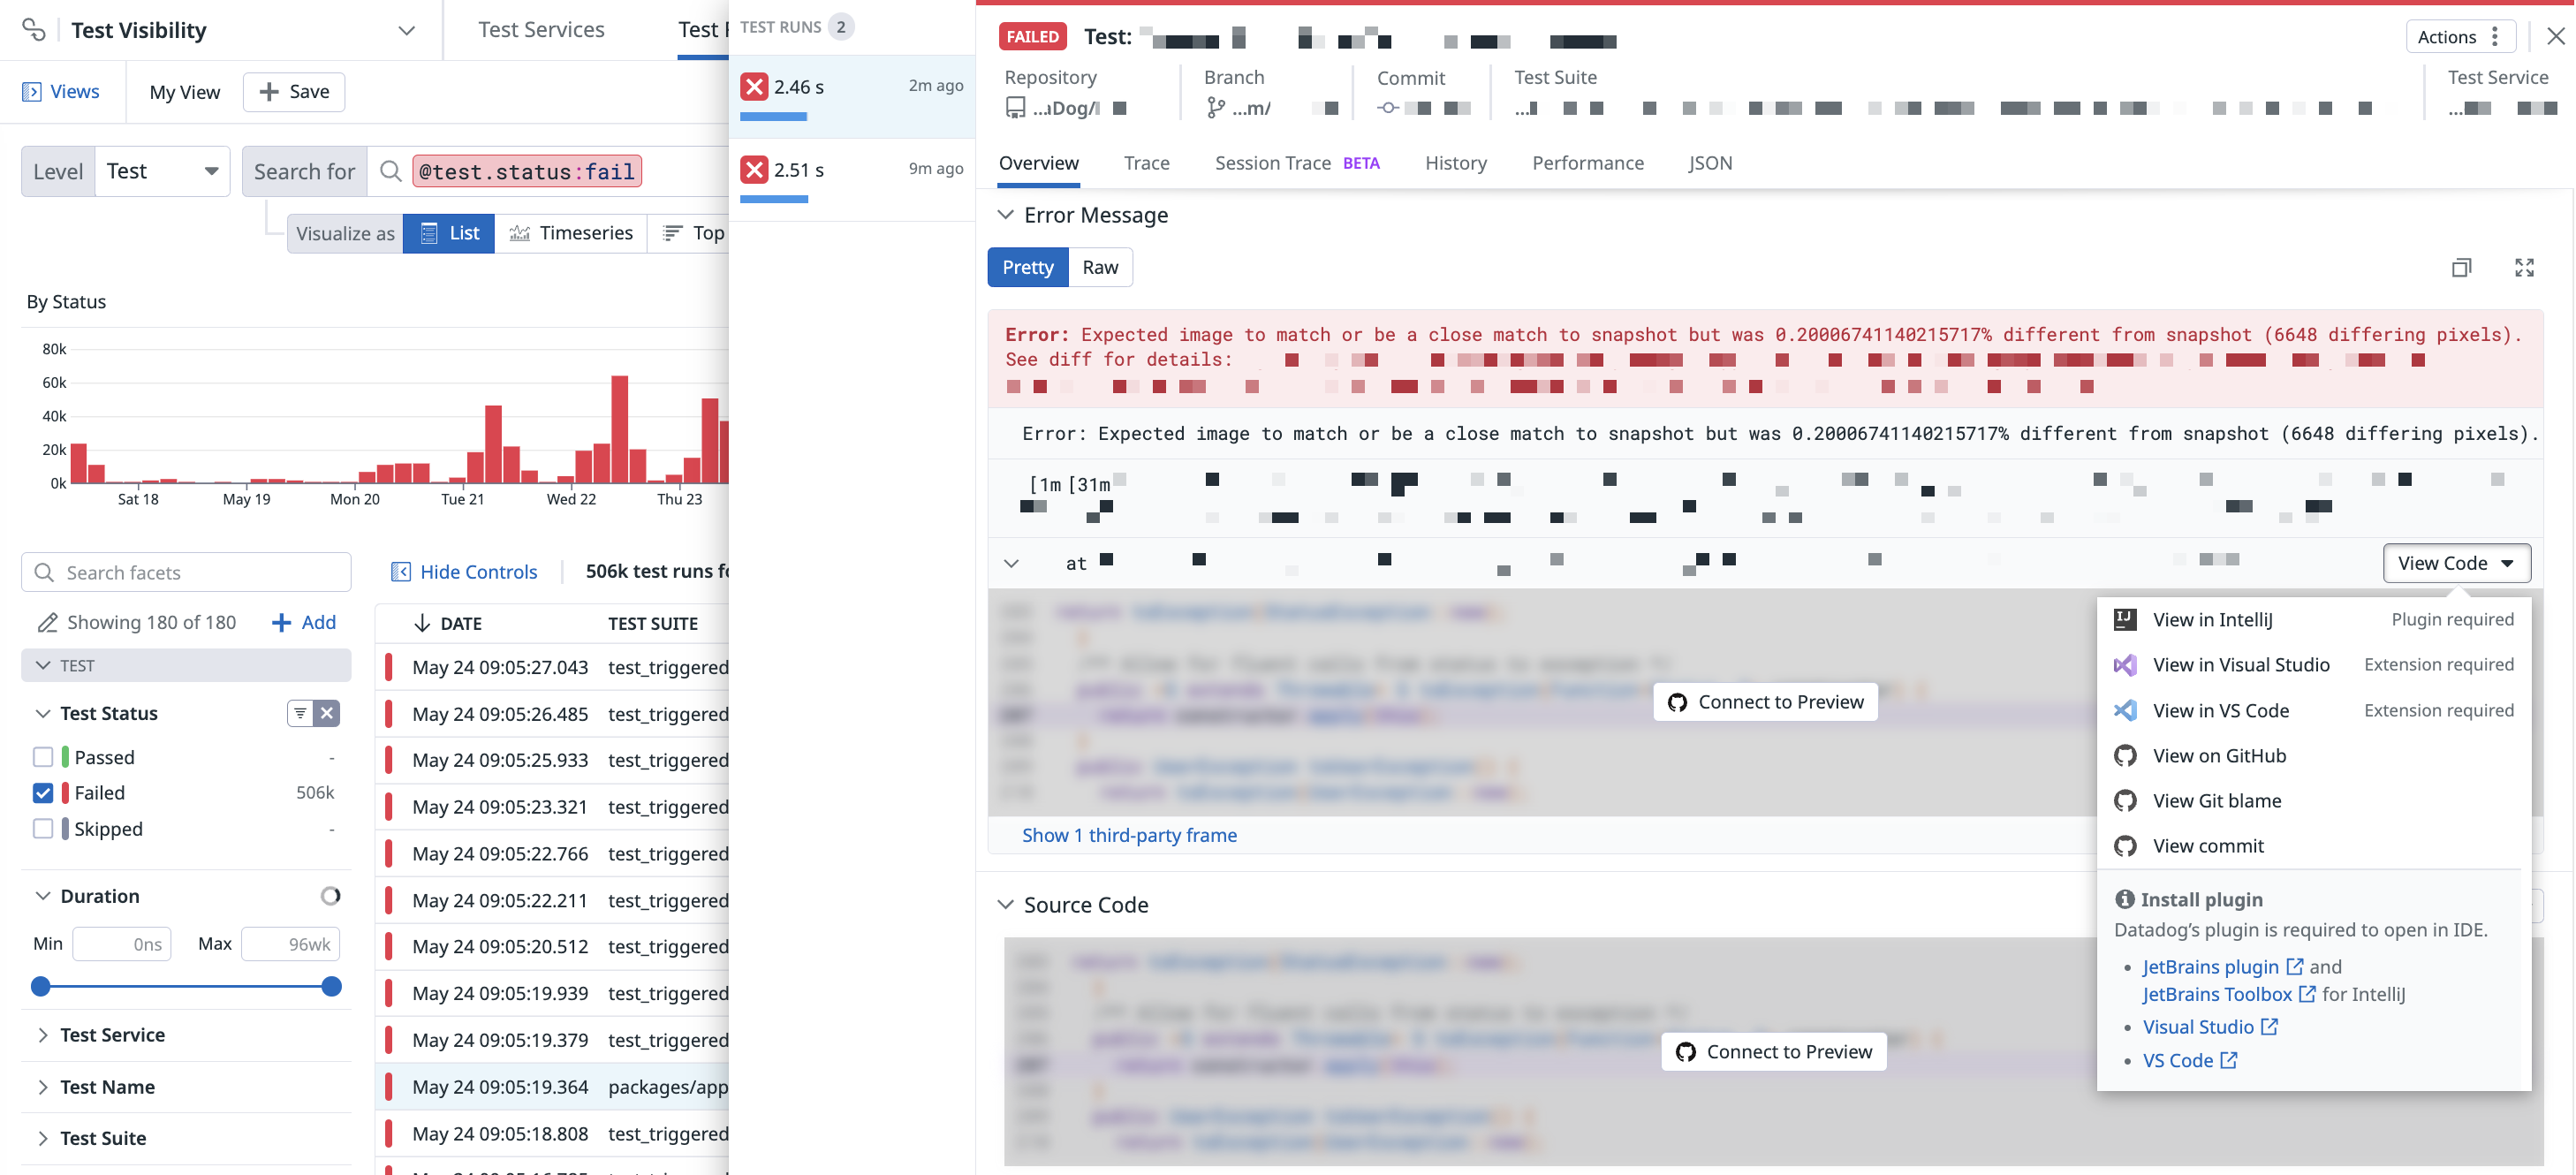
After detecting a failed and/or flaky test within Datadog, you have the option to open that test in GitHub or your IDE to fix it immediately.
Under the Error Message section in the Overview tab of a test run, click the View Code button to view the relevant lines of code for that test within Visual Studio Code, IntelliJ, or GitHub.
The order of options in this dropdown changes depending on the language your test was written in:
- IntelliJ is prioritized for Java-based tests
- Visual Studio Code is prioritized for JavaScript and Python-based tests
Viewing source code in GitHub
Optionally, you can set up the GitHub integration to open the source code for a failed or flaky test in GitHub.
Under the Source Code section in the Overview tab of a test run, click the View on GitHub button to view the relevant lines of code for that test within GitHub.
Installing IDE plugins
IDE plugins and extensions are required to view your test in your IDE.
- If you do not have the VS Code extension installed, click View in VS Code to open the extension directly in VS Code for installation.
- If you do not have the IntelliJ plugin installed, click View in IntelliJ to get the extension installation. Compatible Datadog versions can be found on the Plugin Versions page.
