- Essentials
- Getting Started
- Datadog
- Datadog Site
- DevSecOps
- Serverless for AWS Lambda
- Agent
- Integrations
- Containers
- Dashboards
- Monitors
- Logs
- APM Tracing
- Profiler
- Tags
- API
- Service Catalog
- Session Replay
- Continuous Testing
- Synthetic Monitoring
- Incident Management
- Database Monitoring
- Cloud Security Management
- Cloud SIEM
- Application Security Management
- Workflow Automation
- CI Visibility
- Test Visibility
- Test Impact Analysis
- Code Analysis
- Learning Center
- Support
- Glossary
- Standard Attributes
- Guides
- Agent
- Integrations
- OpenTelemetry
- Developers
- Authorization
- DogStatsD
- Custom Checks
- Integrations
- Create an Agent-based Integration
- Create an API Integration
- Create a Log Pipeline
- Integration Assets Reference
- Build a Marketplace Offering
- Create a Tile
- Create an Integration Dashboard
- Create a Recommended Monitor
- Create a Cloud SIEM Detection Rule
- OAuth for Integrations
- Install Agent Integration Developer Tool
- Service Checks
- IDE Plugins
- Community
- Guides
- Administrator's Guide
- API
- Datadog Mobile App
- CoScreen
- Cloudcraft
- In The App
- Dashboards
- Notebooks
- DDSQL Editor
- Sheets
- Monitors and Alerting
- Infrastructure
- Metrics
- Watchdog
- Bits AI
- Service Catalog
- API Catalog
- Error Tracking
- Service Management
- Infrastructure
- Application Performance
- APM
- Continuous Profiler
- Database Monitoring
- Data Streams Monitoring
- Data Jobs Monitoring
- Digital Experience
- Real User Monitoring
- Product Analytics
- Synthetic Testing and Monitoring
- Continuous Testing
- Software Delivery
- CI Visibility
- CD Visibility
- Test Optimization
- Code Analysis
- Quality Gates
- DORA Metrics
- Security
- Security Overview
- Cloud SIEM
- Cloud Security Management
- Application Security Management
- AI Observability
- Log Management
- Observability Pipelines
- Log Management
- Administration
Synthetic Monitoring & Testing Results Explorer
Overview
The Results Explorer provides visibility into all test runs and CI batches for Synthetic Monitoring and Continuous Testing.
You can accomplish the following actions:
- Compare test runs executed against various devices and browsers to pinpoint cross-browser and device issues
- Examine performance issues with result timing facets and filter runs by failing status codes
- Try onboarding search queries to get started with searching in the Explorer
Create a search query
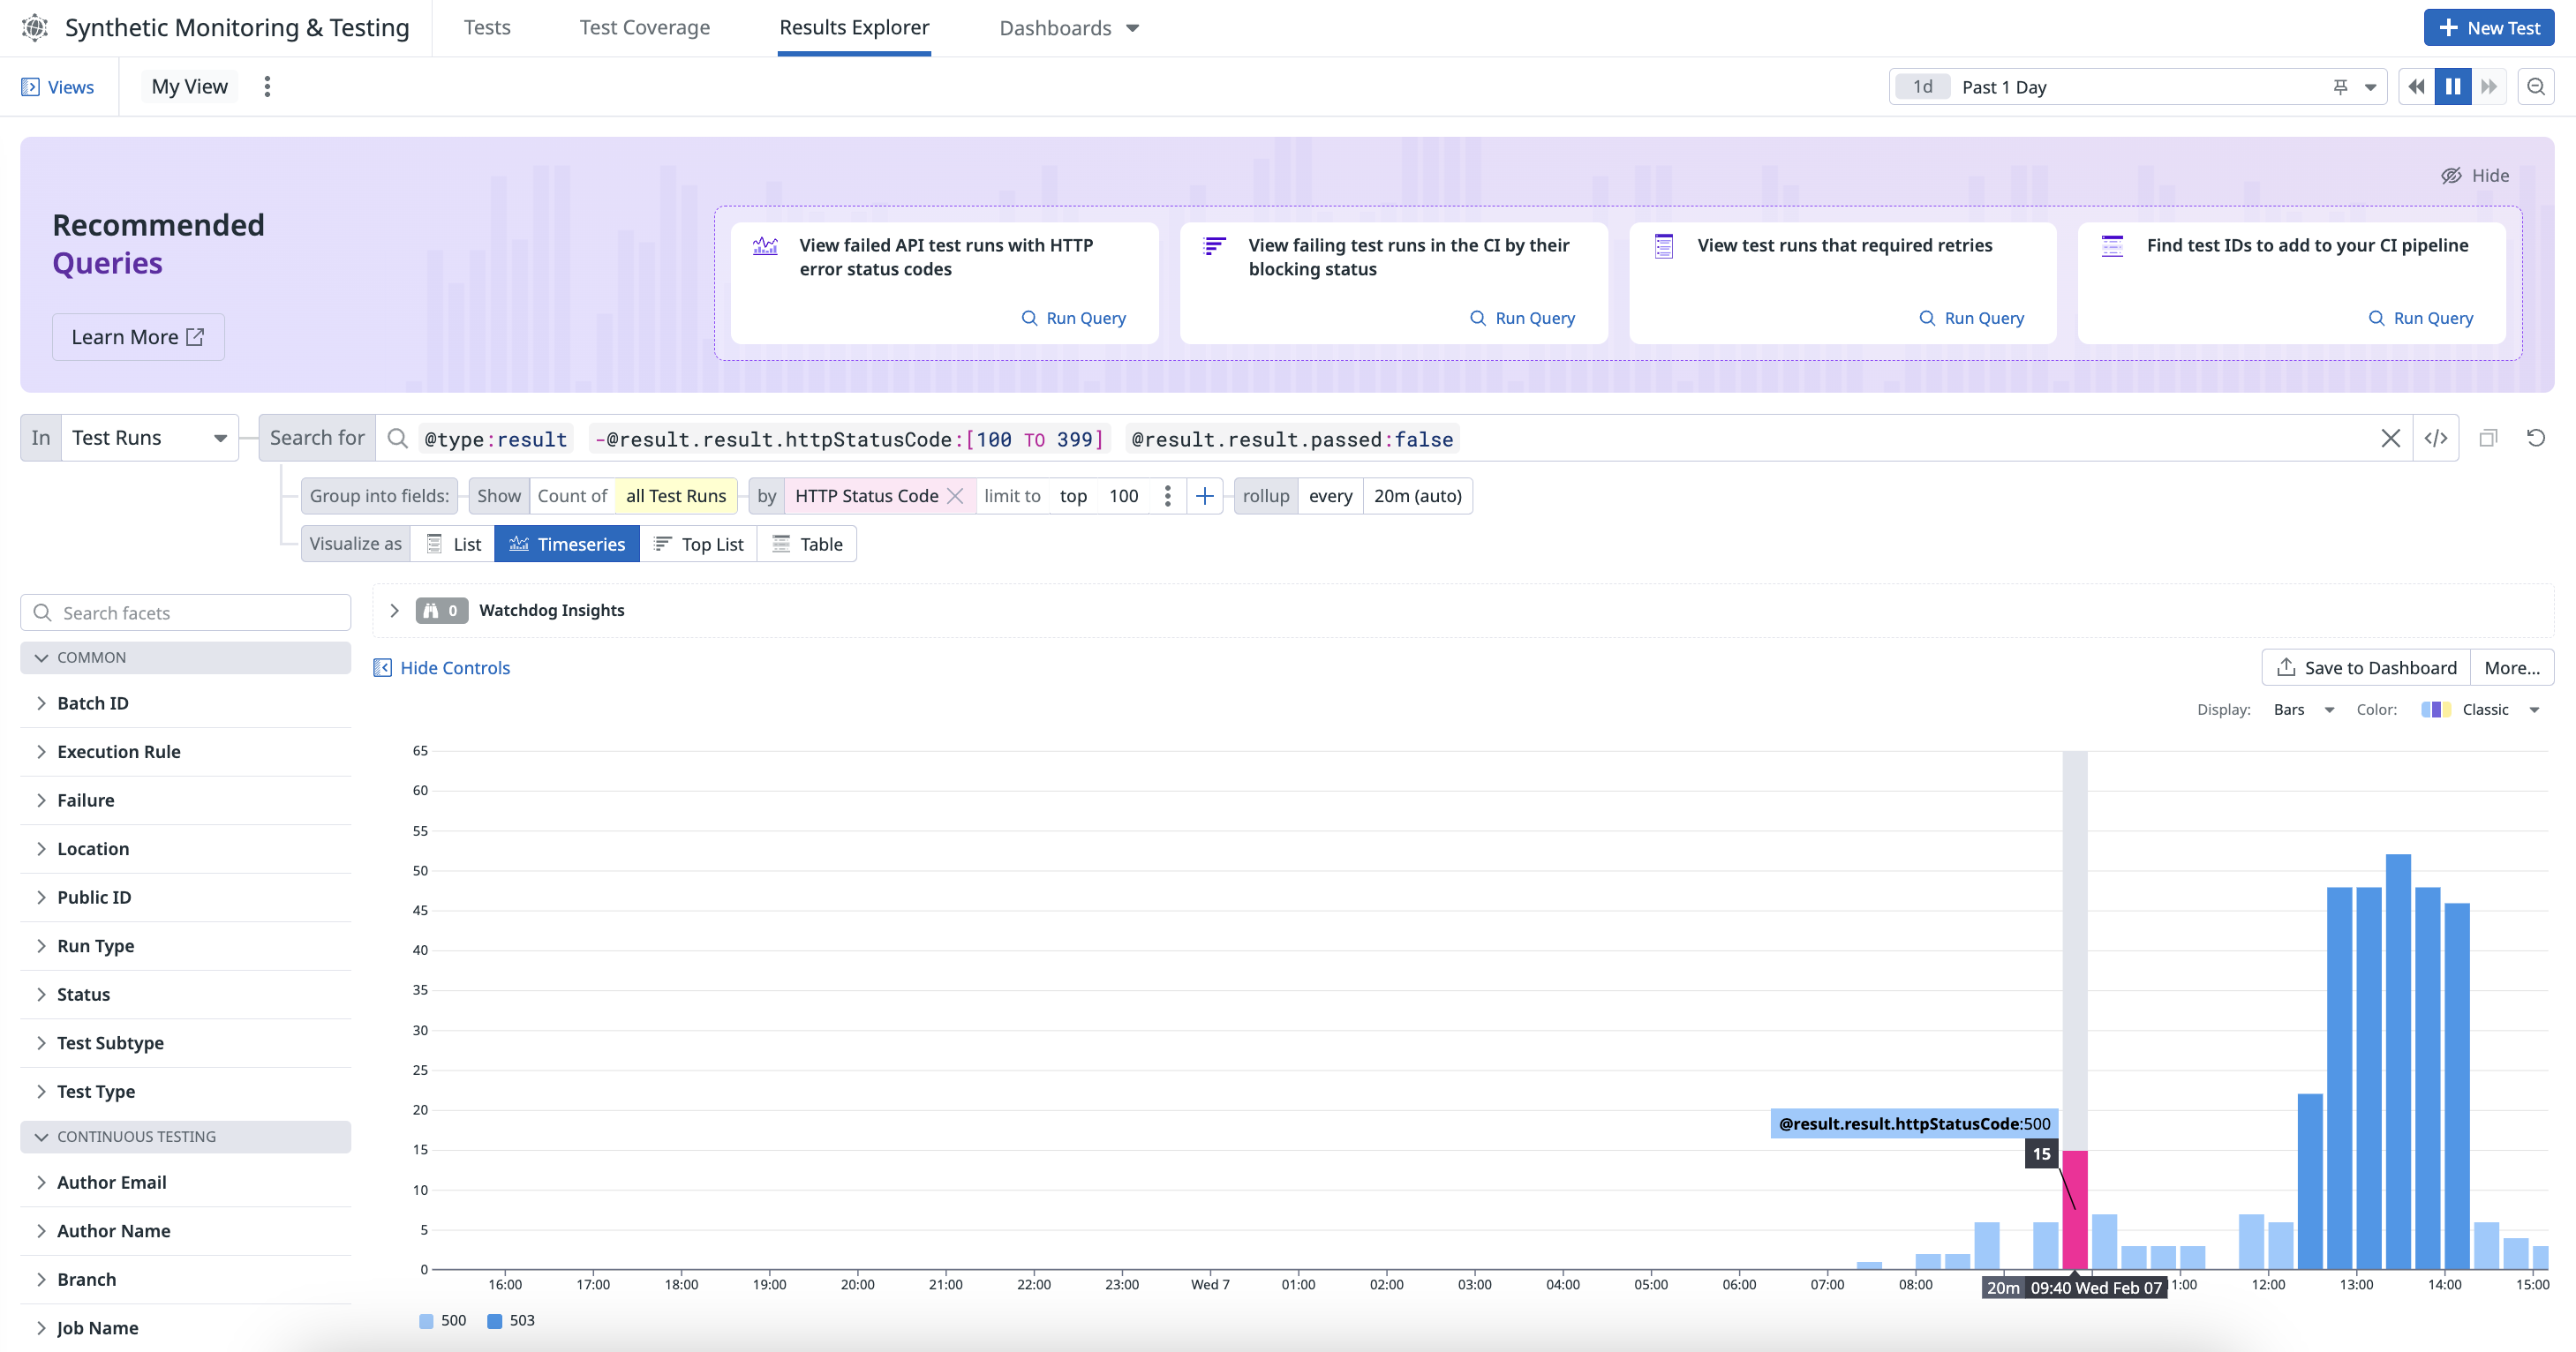
Navigate to Digital Experience > Synthetic Monitoring & Testing > Continuous Testing and click on an out-of-the-box search query to start viewing your test batches or runs and create visualizations.
- View failed tests running in a CI pipeline by filtering on their blocking status and confirming if they are blocking your new releases.
- Analyze failing test runs with HTTP error status codes to identify API tests with unexpected status codes.
- Examine test runs that initially failed and passed after a retry.
- Access test IDs to include in your CI pipeline.
For more information, see Search Syntax.
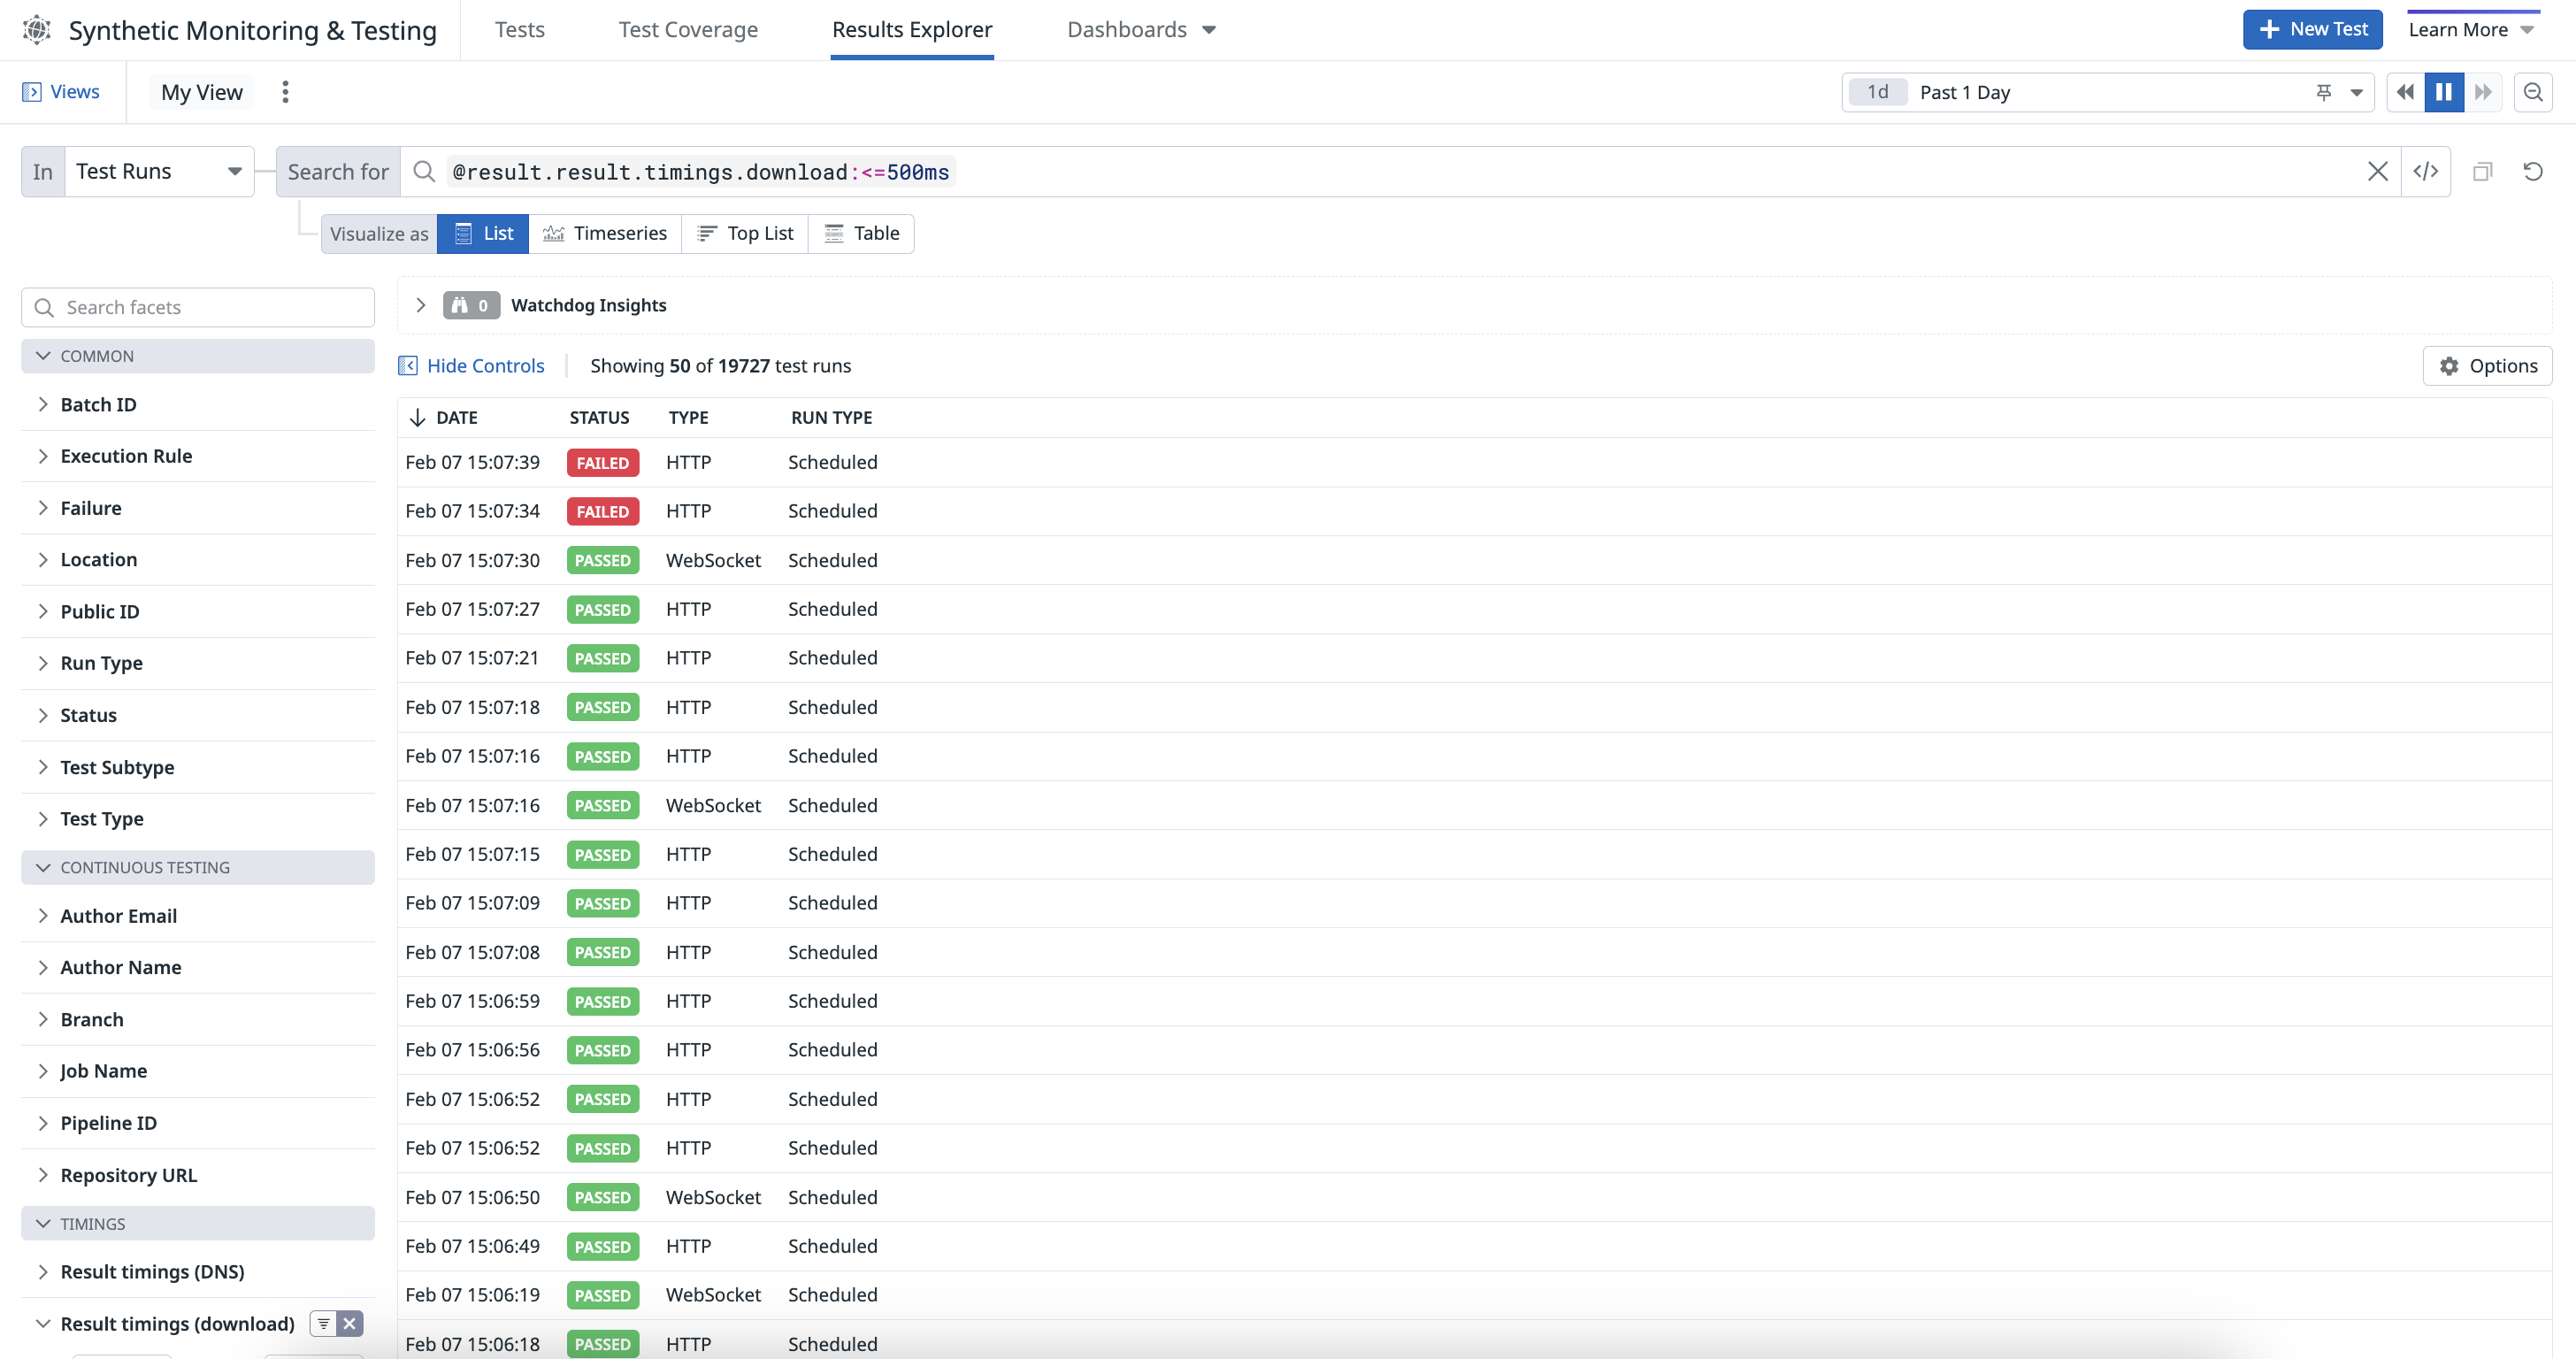
Explore test runs
The Results Explorer displays all of your test runs from Synthetic Monitoring and Continuous Testing. Every test corresponds to a test run for a particular test subtype, including fast retries. Click on a test in the Results Explorer to access the test run page.
- Click on a test run to navigate to the test results or details page.
- Analyze your test run performance, or API and multistep API test performance.
- Create a visualization such as a timeseries graph, top list, or table.
For more information about test runs, see Search Test Runs.
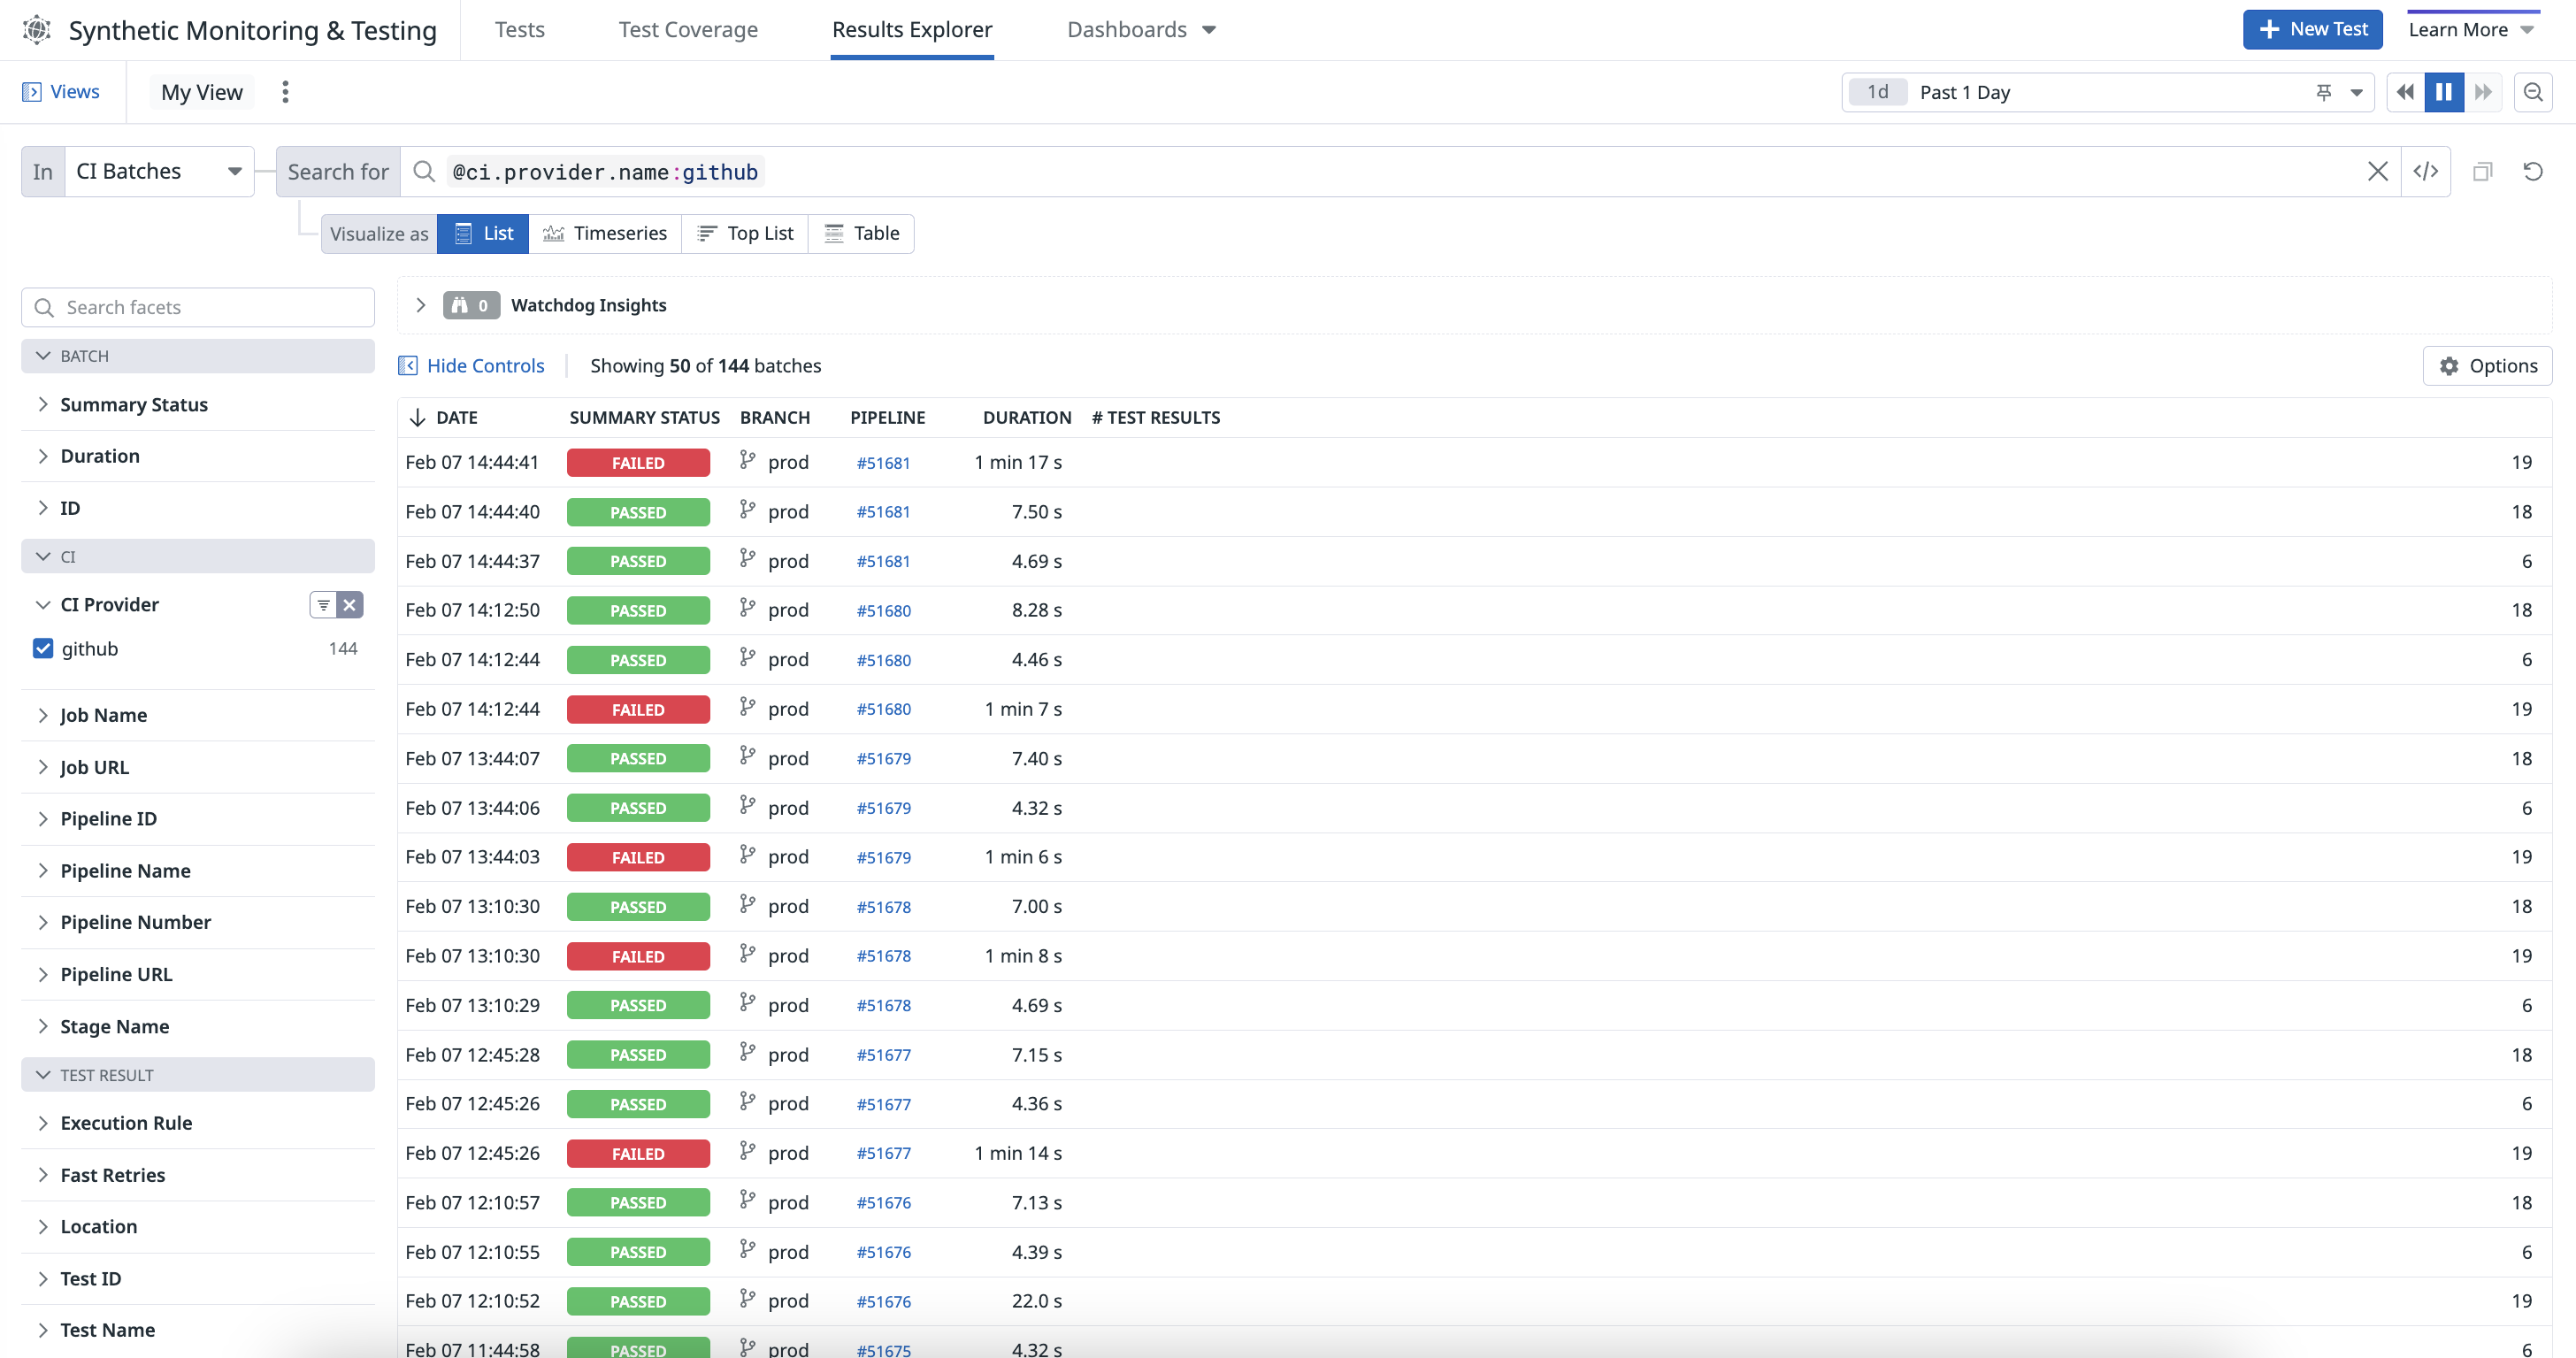
Explore test batches
The Results Explorer displays batches of tests run by Continuous Testing and your CI/CD provider. Every batch corresponds with a call to the Datadog API (through one of your CI/CD integrations, the datadog-ci NPM package, or directly through the API endpoint) and triggers one or several test executions.
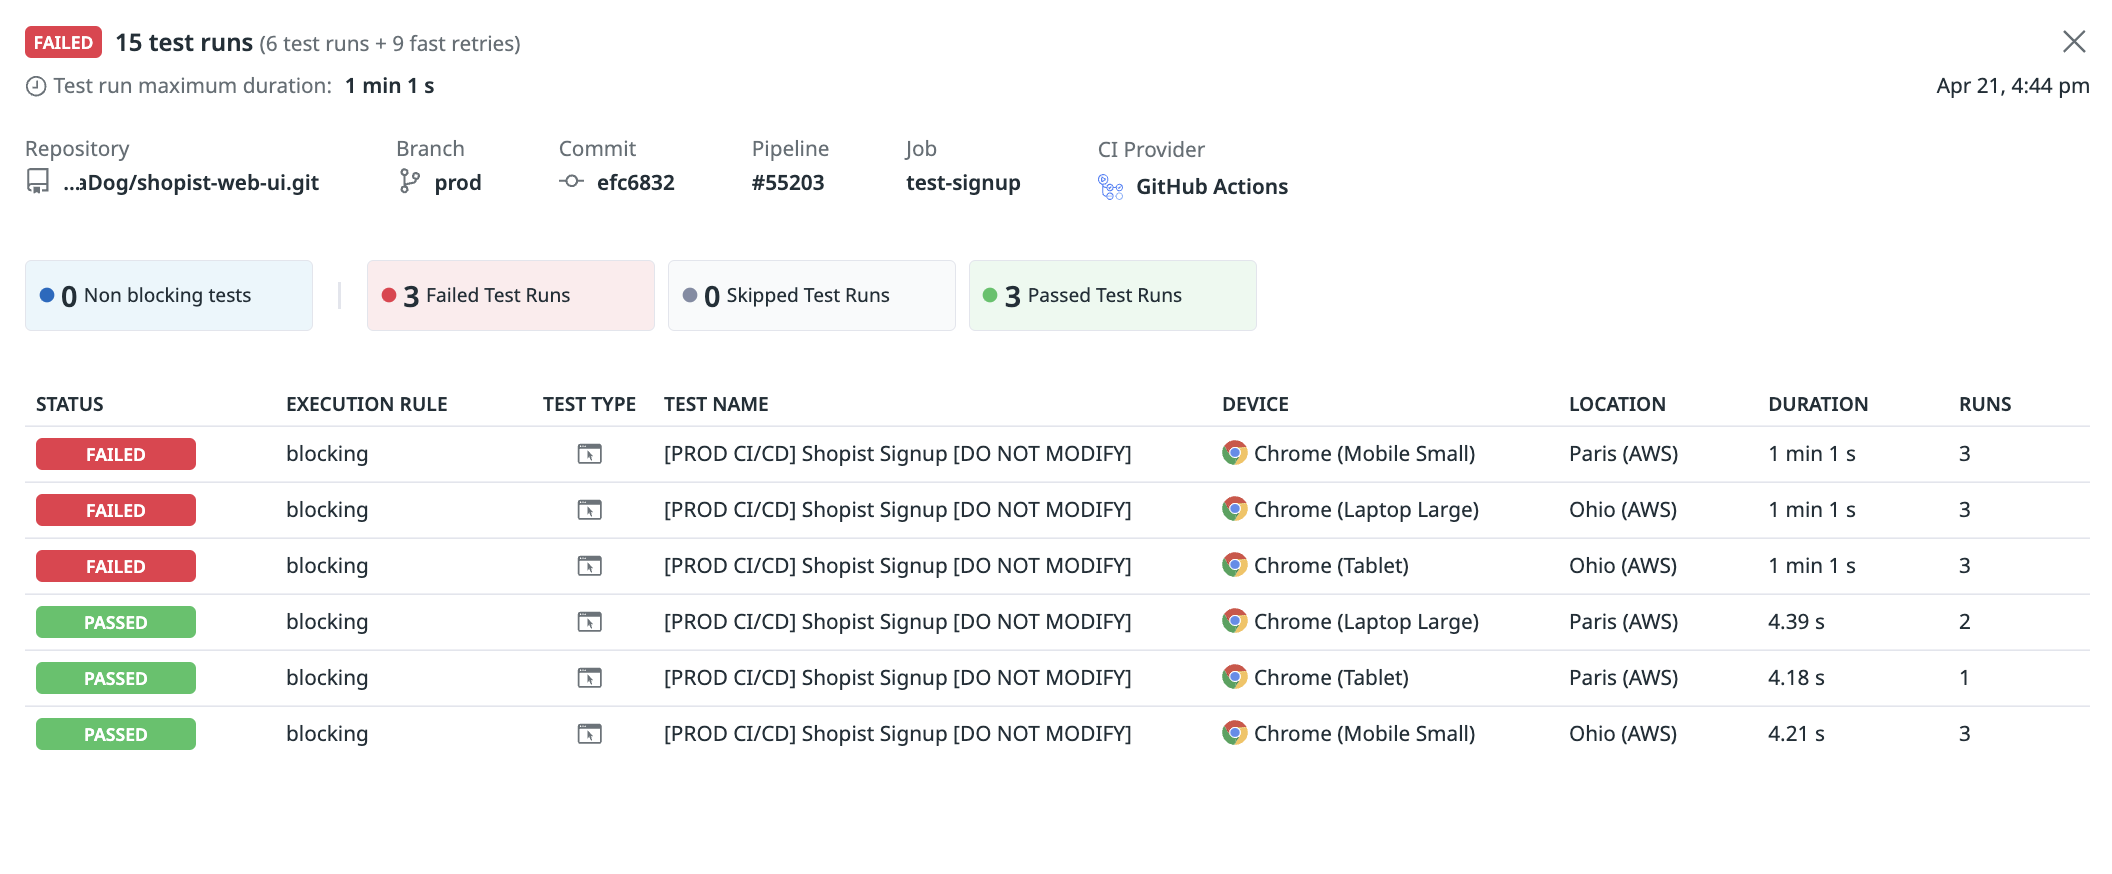
- Click on a batch to open a side panel containing batch CI/CD metadata and batch test results.
- Explore the test executions performed as part of the batch and pinpoint test failures.
- Click on a failing test result to see the detailed Test Result page and investigate the root cause of the issue.
For more information about test batches, see Search Test Batches.
Export
Export your view as a saved view in the Synthetic Monitoring & Testing Results Explorer.
Further reading
Additional helpful documentation, links, and articles:


