- Essentials
- Getting Started
- Agent
- API
- APM Tracing
- Containers
- Dashboards
- Database Monitoring
- Datadog
- Datadog Site
- DevSecOps
- Incident Management
- Integrations
- Logs
- Monitors
- OpenTelemetry
- Profiler
- Session Replay
- Security
- Serverless for AWS Lambda
- Software Catalog
- Software Delivery
- Synthetic Monitoring and Testing
- Tags
- Workflow Automation
- Learning Center
- Support
- Glossary
- Standard Attributes
- Guides
- Agent
- Integrations
- Developers
- Authorization
- DogStatsD
- Custom Checks
- Integrations
- Create an Agent-based Integration
- Create an API Integration
- Create a Log Pipeline
- Integration Assets Reference
- Build a Marketplace Offering
- Create a Tile
- Create an Integration Dashboard
- Create a Monitor Template
- Create a Cloud SIEM Detection Rule
- OAuth for Integrations
- Install Agent Integration Developer Tool
- Service Checks
- IDE Plugins
- Community
- Guides
- OpenTelemetry
- Administrator's Guide
- API
- Partners
- Datadog Mobile App
- DDSQL Reference
- CoScreen
- CoTerm
- Cloudcraft (Standalone)
- In The App
- Dashboards
- Notebooks
- DDSQL Editor
- Reference Tables
- Sheets
- Monitors and Alerting
- Metrics
- Watchdog
- Bits AI
- Internal Developer Portal
- Error Tracking
- Change Tracking
- Service Management
- Actions & Remediations
- Infrastructure
- Cloudcraft
- Resource Catalog
- Universal Service Monitoring
- Hosts
- Containers
- Processes
- Serverless
- Network Monitoring
- Cloud Cost
- Application Performance
- APM
- APM Terms and Concepts
- Application Instrumentation
- APM Metrics Collection
- Trace Pipeline Configuration
- Correlate Traces with Other Telemetry
- Trace Explorer
- Recommendations
- Code Origins for Spans
- Service Observability
- Endpoint Observability
- Dynamic Instrumentation
- Live Debugger
- Error Tracking
- Data Security
- Guides
- Troubleshooting
- Continuous Profiler
- Database Monitoring
- Agent Integration Overhead
- Setup Architectures
- Setting Up Postgres
- Setting Up MySQL
- Setting Up SQL Server
- Setting Up Oracle
- Setting Up Amazon DocumentDB
- Setting Up MongoDB
- Connecting DBM and Traces
- Data Collected
- Exploring Database Hosts
- Exploring Query Metrics
- Exploring Query Samples
- Exploring Database Schemas
- Exploring Recommendations
- Troubleshooting
- Guides
- Data Streams Monitoring
- Data Jobs Monitoring
- Data Observability
- Digital Experience
- Real User Monitoring
- Synthetic Testing and Monitoring
- Continuous Testing
- Product Analytics
- Software Delivery
- CI Visibility
- CD Visibility
- Deployment Gates
- Test Optimization
- Quality Gates
- DORA Metrics
- Security
- Security Overview
- Cloud SIEM
- Code Security
- Cloud Security
- App and API Protection
- Workload Protection
- Sensitive Data Scanner
- AI Observability
- Log Management
- Observability Pipelines
- Log Management
- Administration
DORA Metrics
This product is not supported for your selected Datadog site. ().
Join the Preview for Engineering Reports!
Request AccessOverview
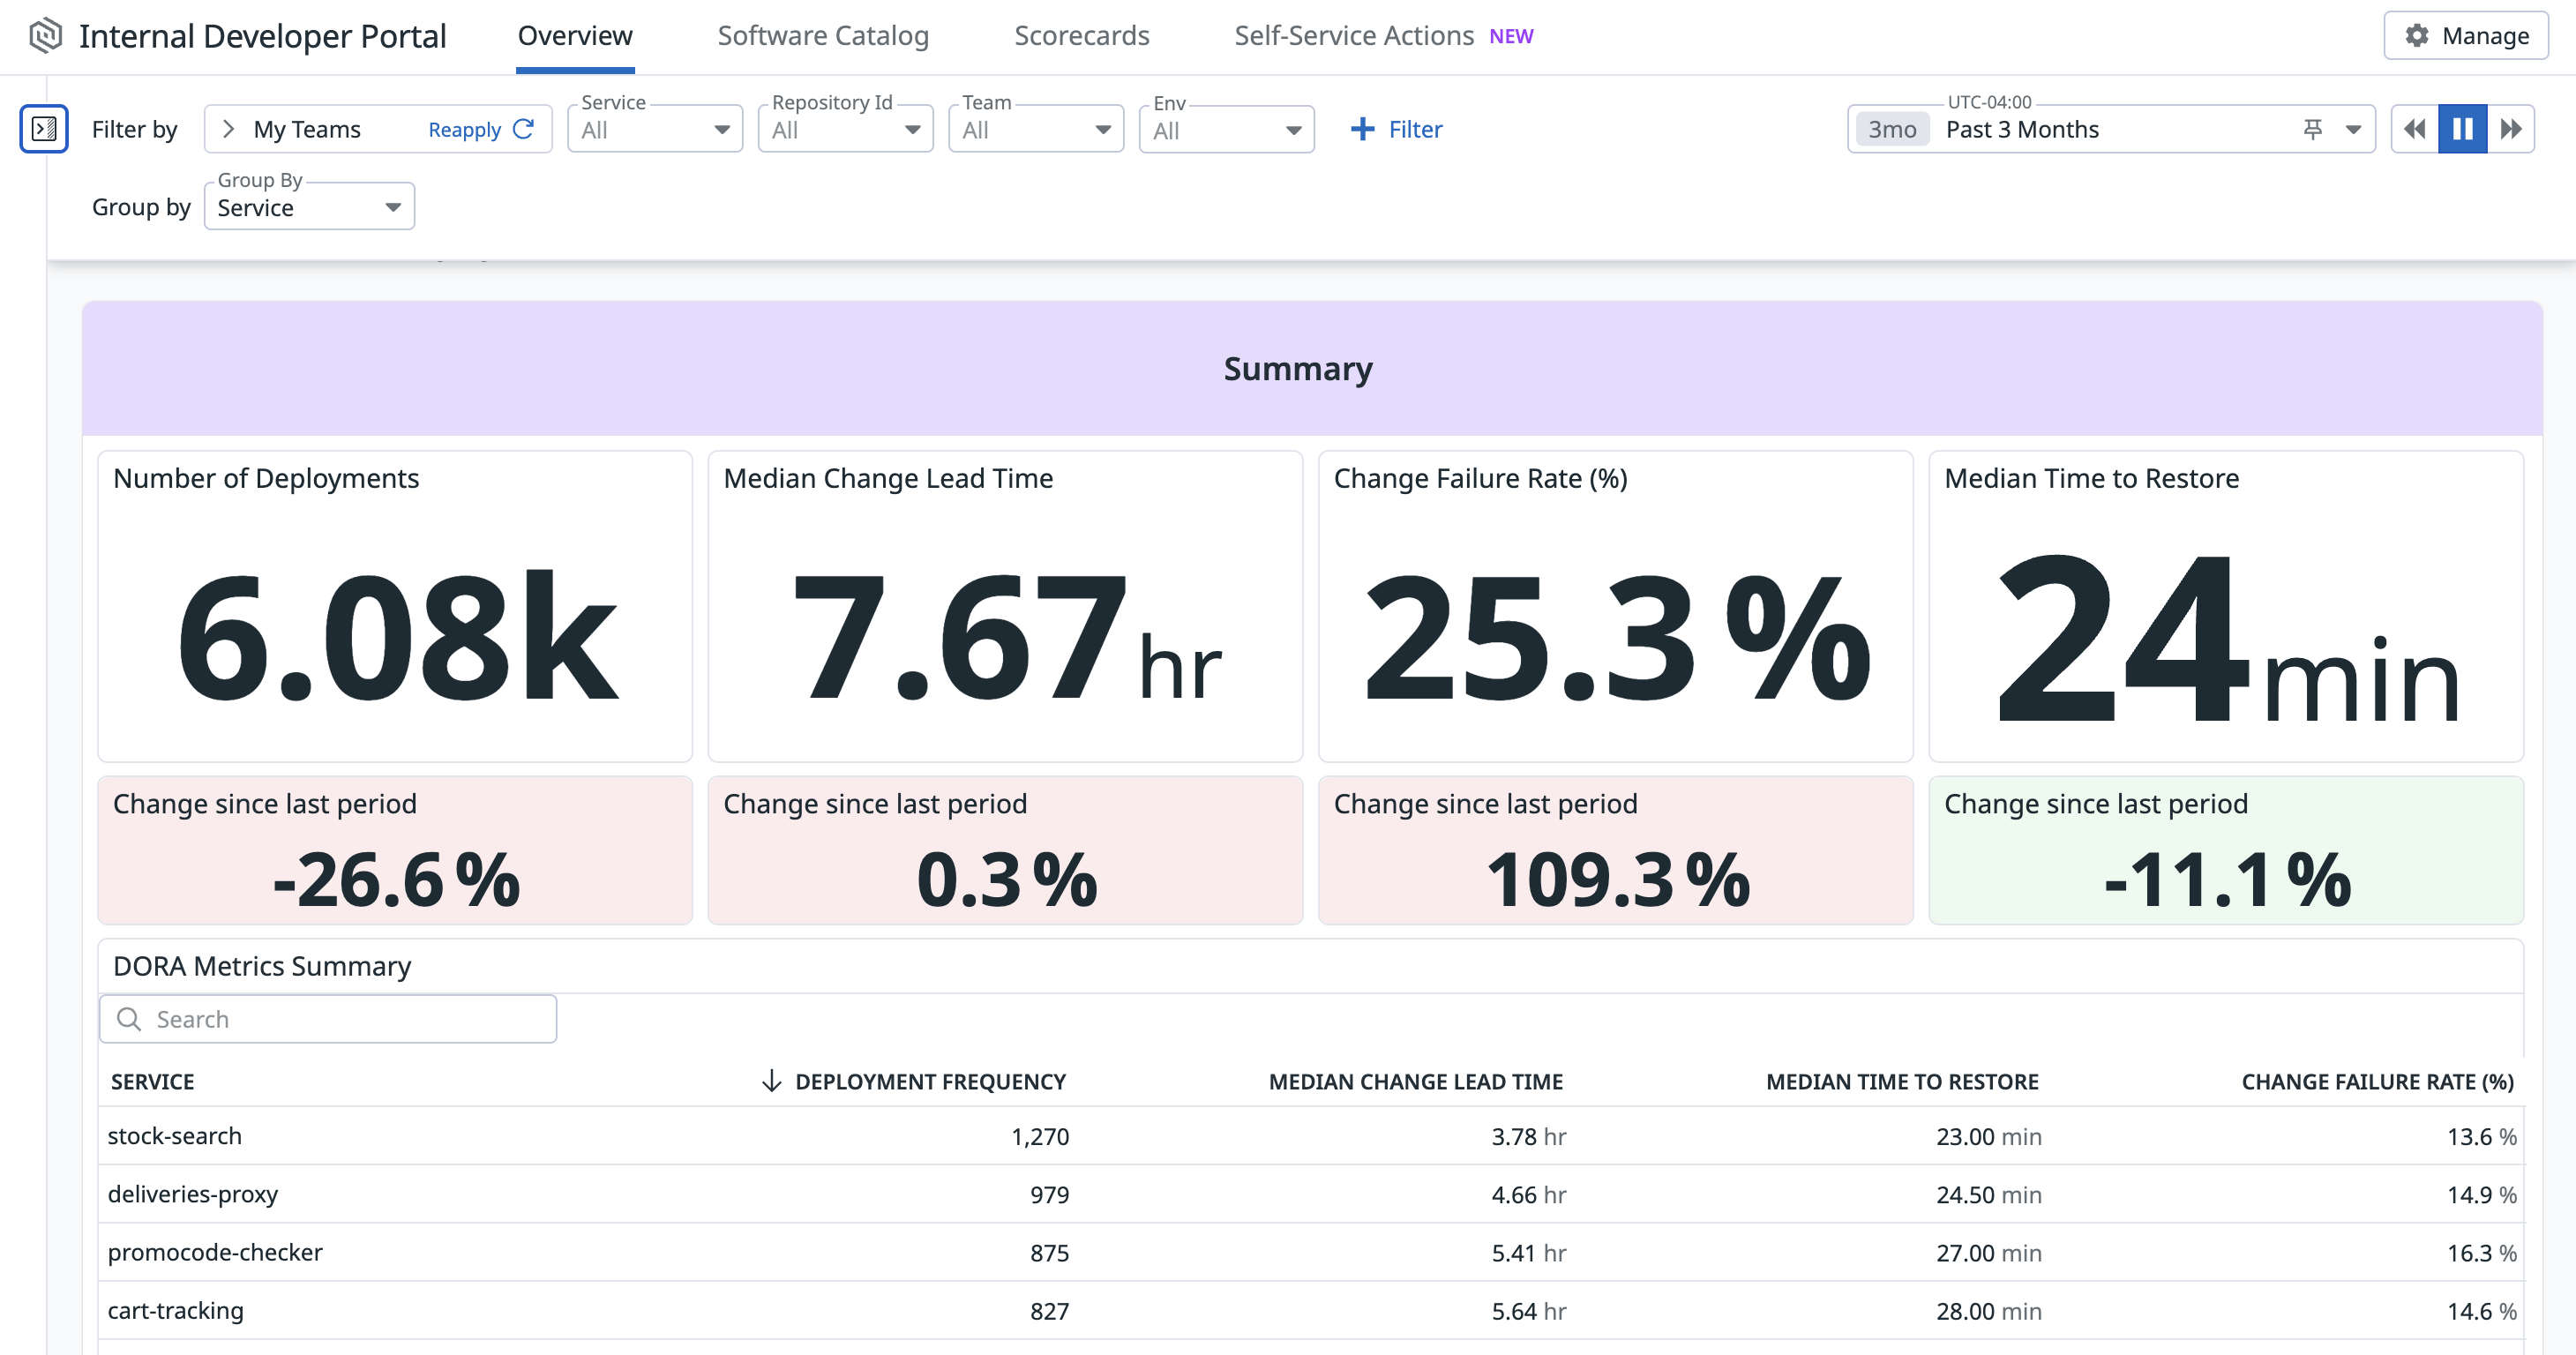
The DORA Metrics report includes an organization-wide view of software development velocity and stability metrics, including historical trends. With this report, you can:
- View a breakdown of DORA metrics by service, team, or env.
- Explore historical info and understand which services and teams are performing best vs. underperforming.
- Filter information based on service, team, repository id, env, and other tags.
- Leverage monthly Datadog recommendations to improve your organization’s software delivery performance.
Access the DORA Metrics report by searching for “Engineering Reports” (or clicking on the “Overview” tab in IDP) and selecting “DORA Metrics” in the left-hand menu.
Interact with your DORA Metrics report
Adjust your view
By default, the Scorecards Performance report breaks down data by service, which allows you to quickly understand DORA metrics performance across all your services.
You can update your DORA Metrics report view in the following ways:
- Switch the aggregation between “Service”, “Team”, or “Env”: View your organization’s DORA metrics by service/team/env groupings to identify top- and bottom-performing areas.
- Add filters to scope the data: Filter by service, team, repository id, env, and other tags.
Schedule reports
Set up scheduled reports for your stakeholders that are delivered as PDFs through email or Slack on a recurring basis.
To schedule reports, click on Schedule Report in the top right corner (or Manage Reports if you’ve already set up reports). Refer to the Scheduled Reports documentation for more information.
Customize your report
On the upper right corner of the report, click the kebab menu and select Clone as a Dashboard to create a dashboard with content from the DORA Metrics report. The dashboard reflects the “service” aggregated view.
To customize the dashboard, you can:
- Change the time frame for widgets showing historical trends
- Add widgets that are not included in the default view
- Add filters to the existing widgets
Further reading
Additional helpful documentation, links, and articles:

