- Essentials
- Getting Started
- Datadog
- Datadog Site
- DevSecOps
- Serverless for AWS Lambda
- Agent
- Integrations
- Containers
- Dashboards
- Monitors
- Logs
- APM Tracing
- Profiler
- Tags
- API
- Service Catalog
- Session Replay
- Continuous Testing
- Synthetic Monitoring
- Incident Management
- Database Monitoring
- Cloud Security Management
- Cloud SIEM
- Application Security Management
- Workflow Automation
- CI Visibility
- Test Visibility
- Test Impact Analysis
- Code Analysis
- Learning Center
- Support
- Glossary
- Standard Attributes
- Guides
- Agent
- Integrations
- OpenTelemetry
- Developers
- Authorization
- DogStatsD
- Custom Checks
- Integrations
- Create an Agent-based Integration
- Create an API Integration
- Create a Log Pipeline
- Integration Assets Reference
- Build a Marketplace Offering
- Create a Tile
- Create an Integration Dashboard
- Create a Recommended Monitor
- Create a Cloud SIEM Detection Rule
- OAuth for Integrations
- Install Agent Integration Developer Tool
- Service Checks
- IDE Plugins
- Community
- Guides
- API
- Datadog Mobile App
- CoScreen
- Cloudcraft
- In The App
- Dashboards
- Notebooks
- DDSQL Editor
- Sheets
- Monitors and Alerting
- Infrastructure
- Metrics
- Watchdog
- Bits AI
- Service Catalog
- API Catalog
- Error Tracking
- Service Management
- Infrastructure
- Application Performance
- APM
- Continuous Profiler
- Database Monitoring
- Data Streams Monitoring
- Data Jobs Monitoring
- Digital Experience
- Real User Monitoring
- Product Analytics
- Synthetic Testing and Monitoring
- Continuous Testing
- Software Delivery
- CI Visibility
- CD Visibility
- Test Optimization
- Code Analysis
- Quality Gates
- DORA Metrics
- Security
- Security Overview
- Cloud SIEM
- Cloud Security Management
- Application Security Management
- AI Observability
- Log Management
- Observability Pipelines
- Log Management
- Administration
Exploring Query Metrics
The Query Metrics view shows historical query performance for normalized queries. Visualize performance trends by infrastructure or custom tags such as data center availability zone, and get alerted for anomalies.
Navigate to the Query Metrics page in Datadog.
The view shows 200 top queries, that is the 200 queries with the most total time running in the selected time frame. See which queries are tracked for more details. Metrics aggregation for one-off or seldom-run fast queries isn’t shown in the Query Metrics view, but you can find snapshots of them represented in Query Samples, if they have run in the last 15 days.
Filtering and grouping
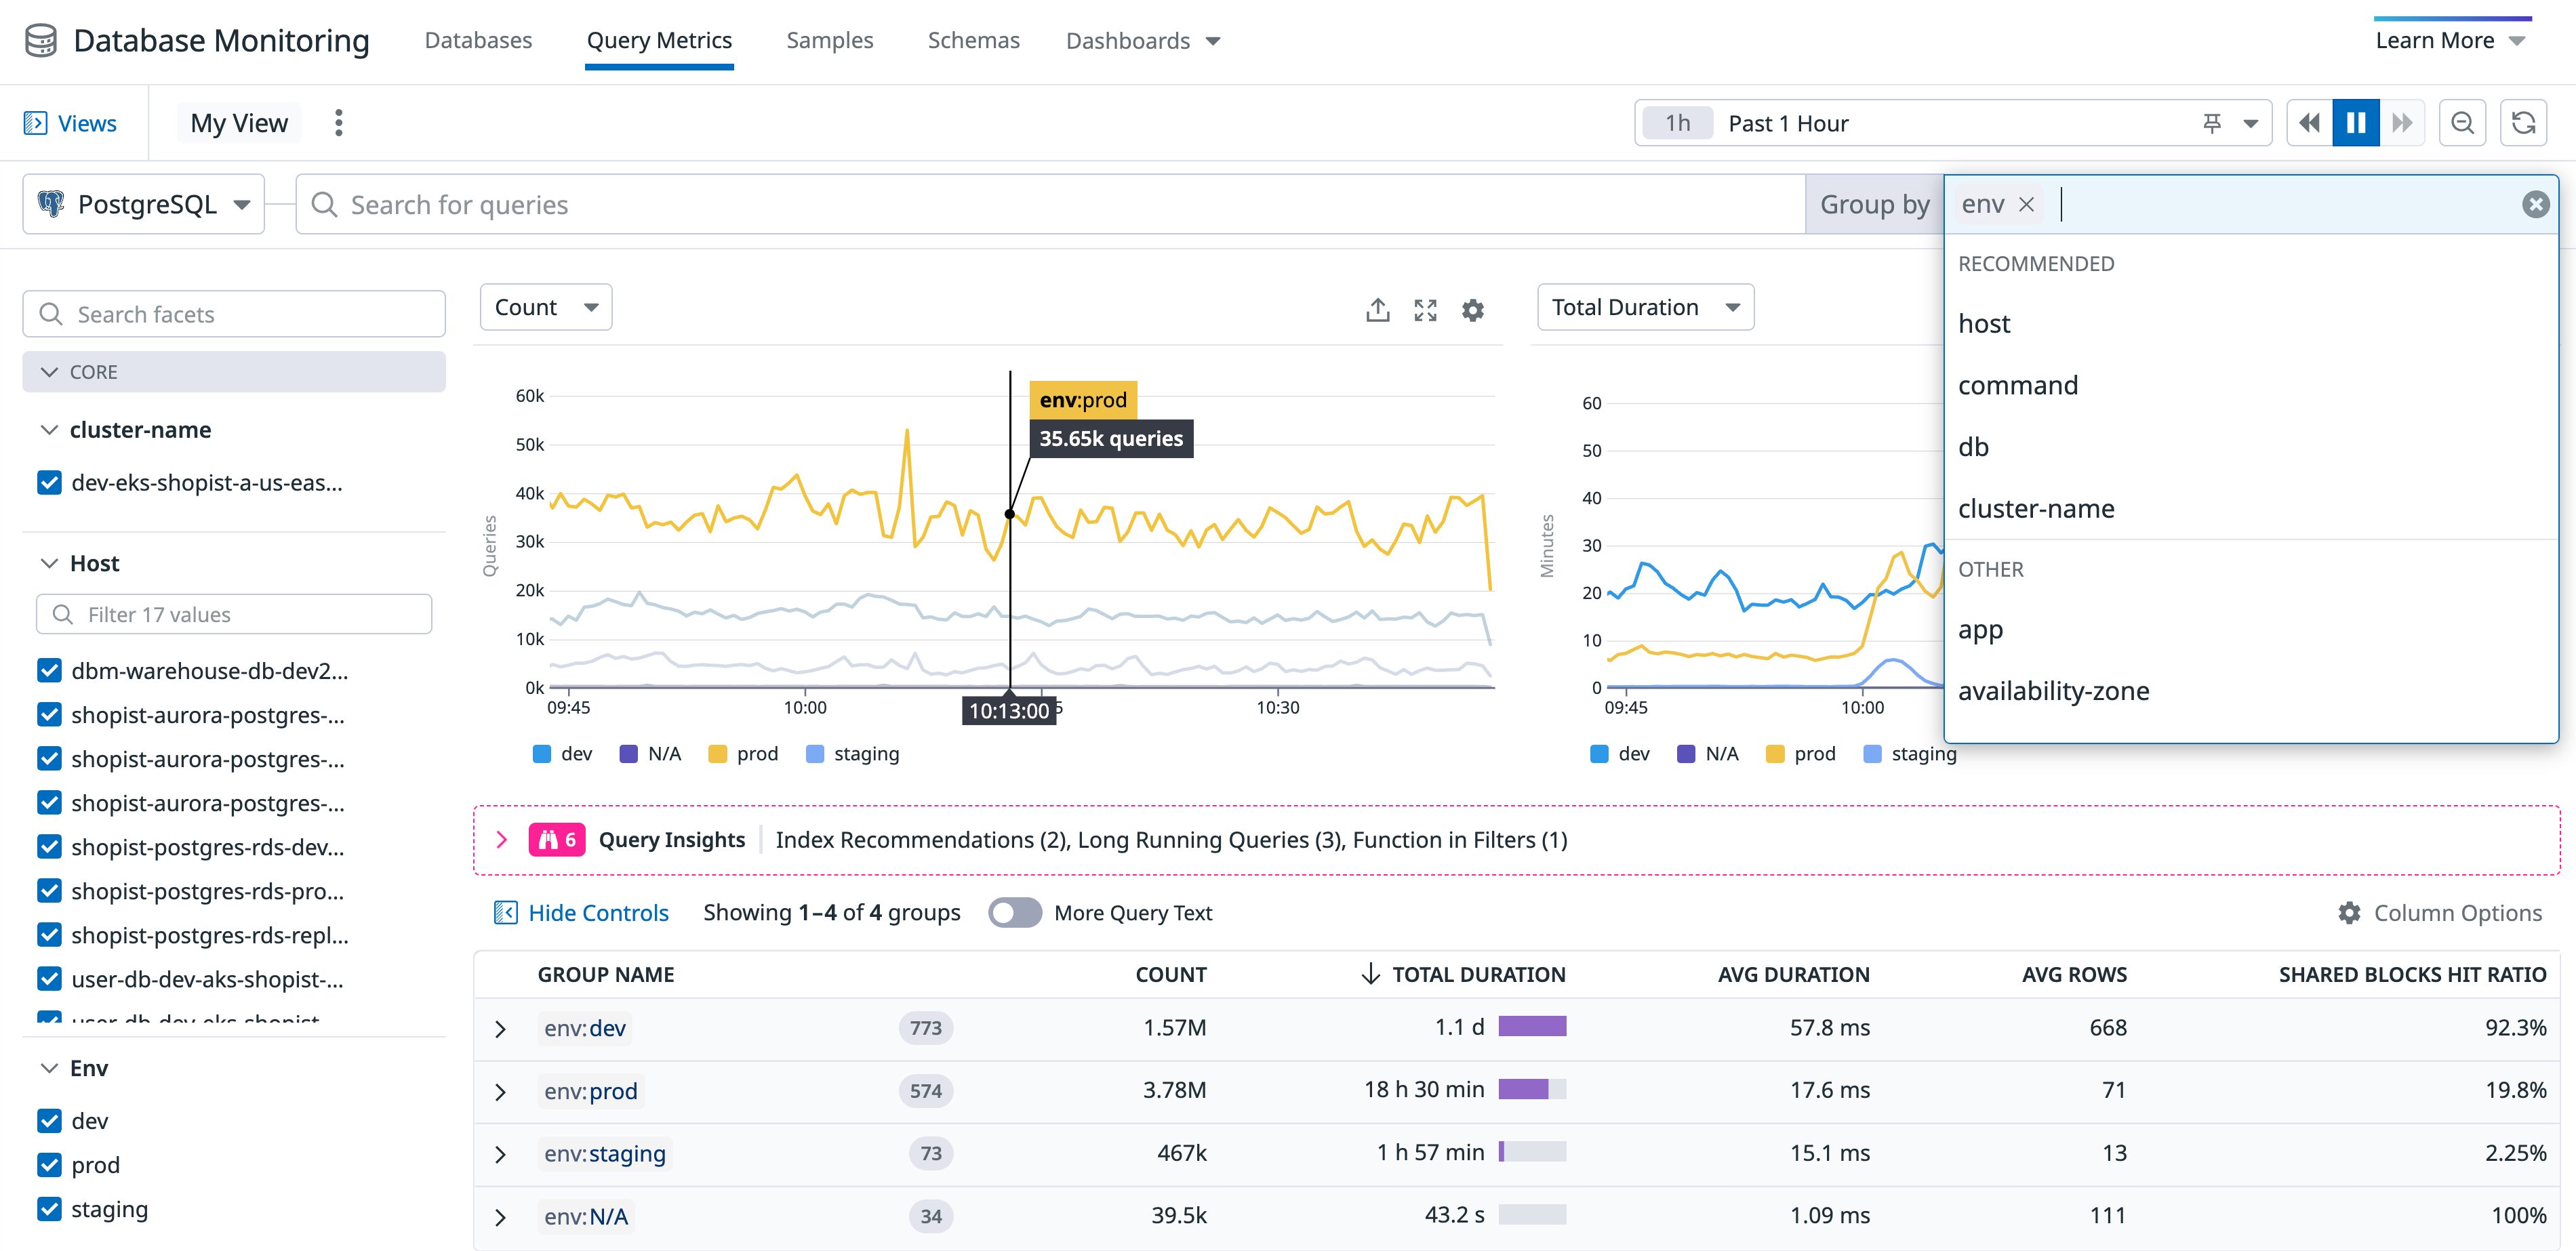
Select your database source (for example, Postgres) from the source selector at the top. Specify search tags to filter the list of queries (or list of stored procedures, where available), and group by tags to organize the list.
For example, it’s often useful to group by host or cluster, to quickly see what infrastructure the queries are running on.
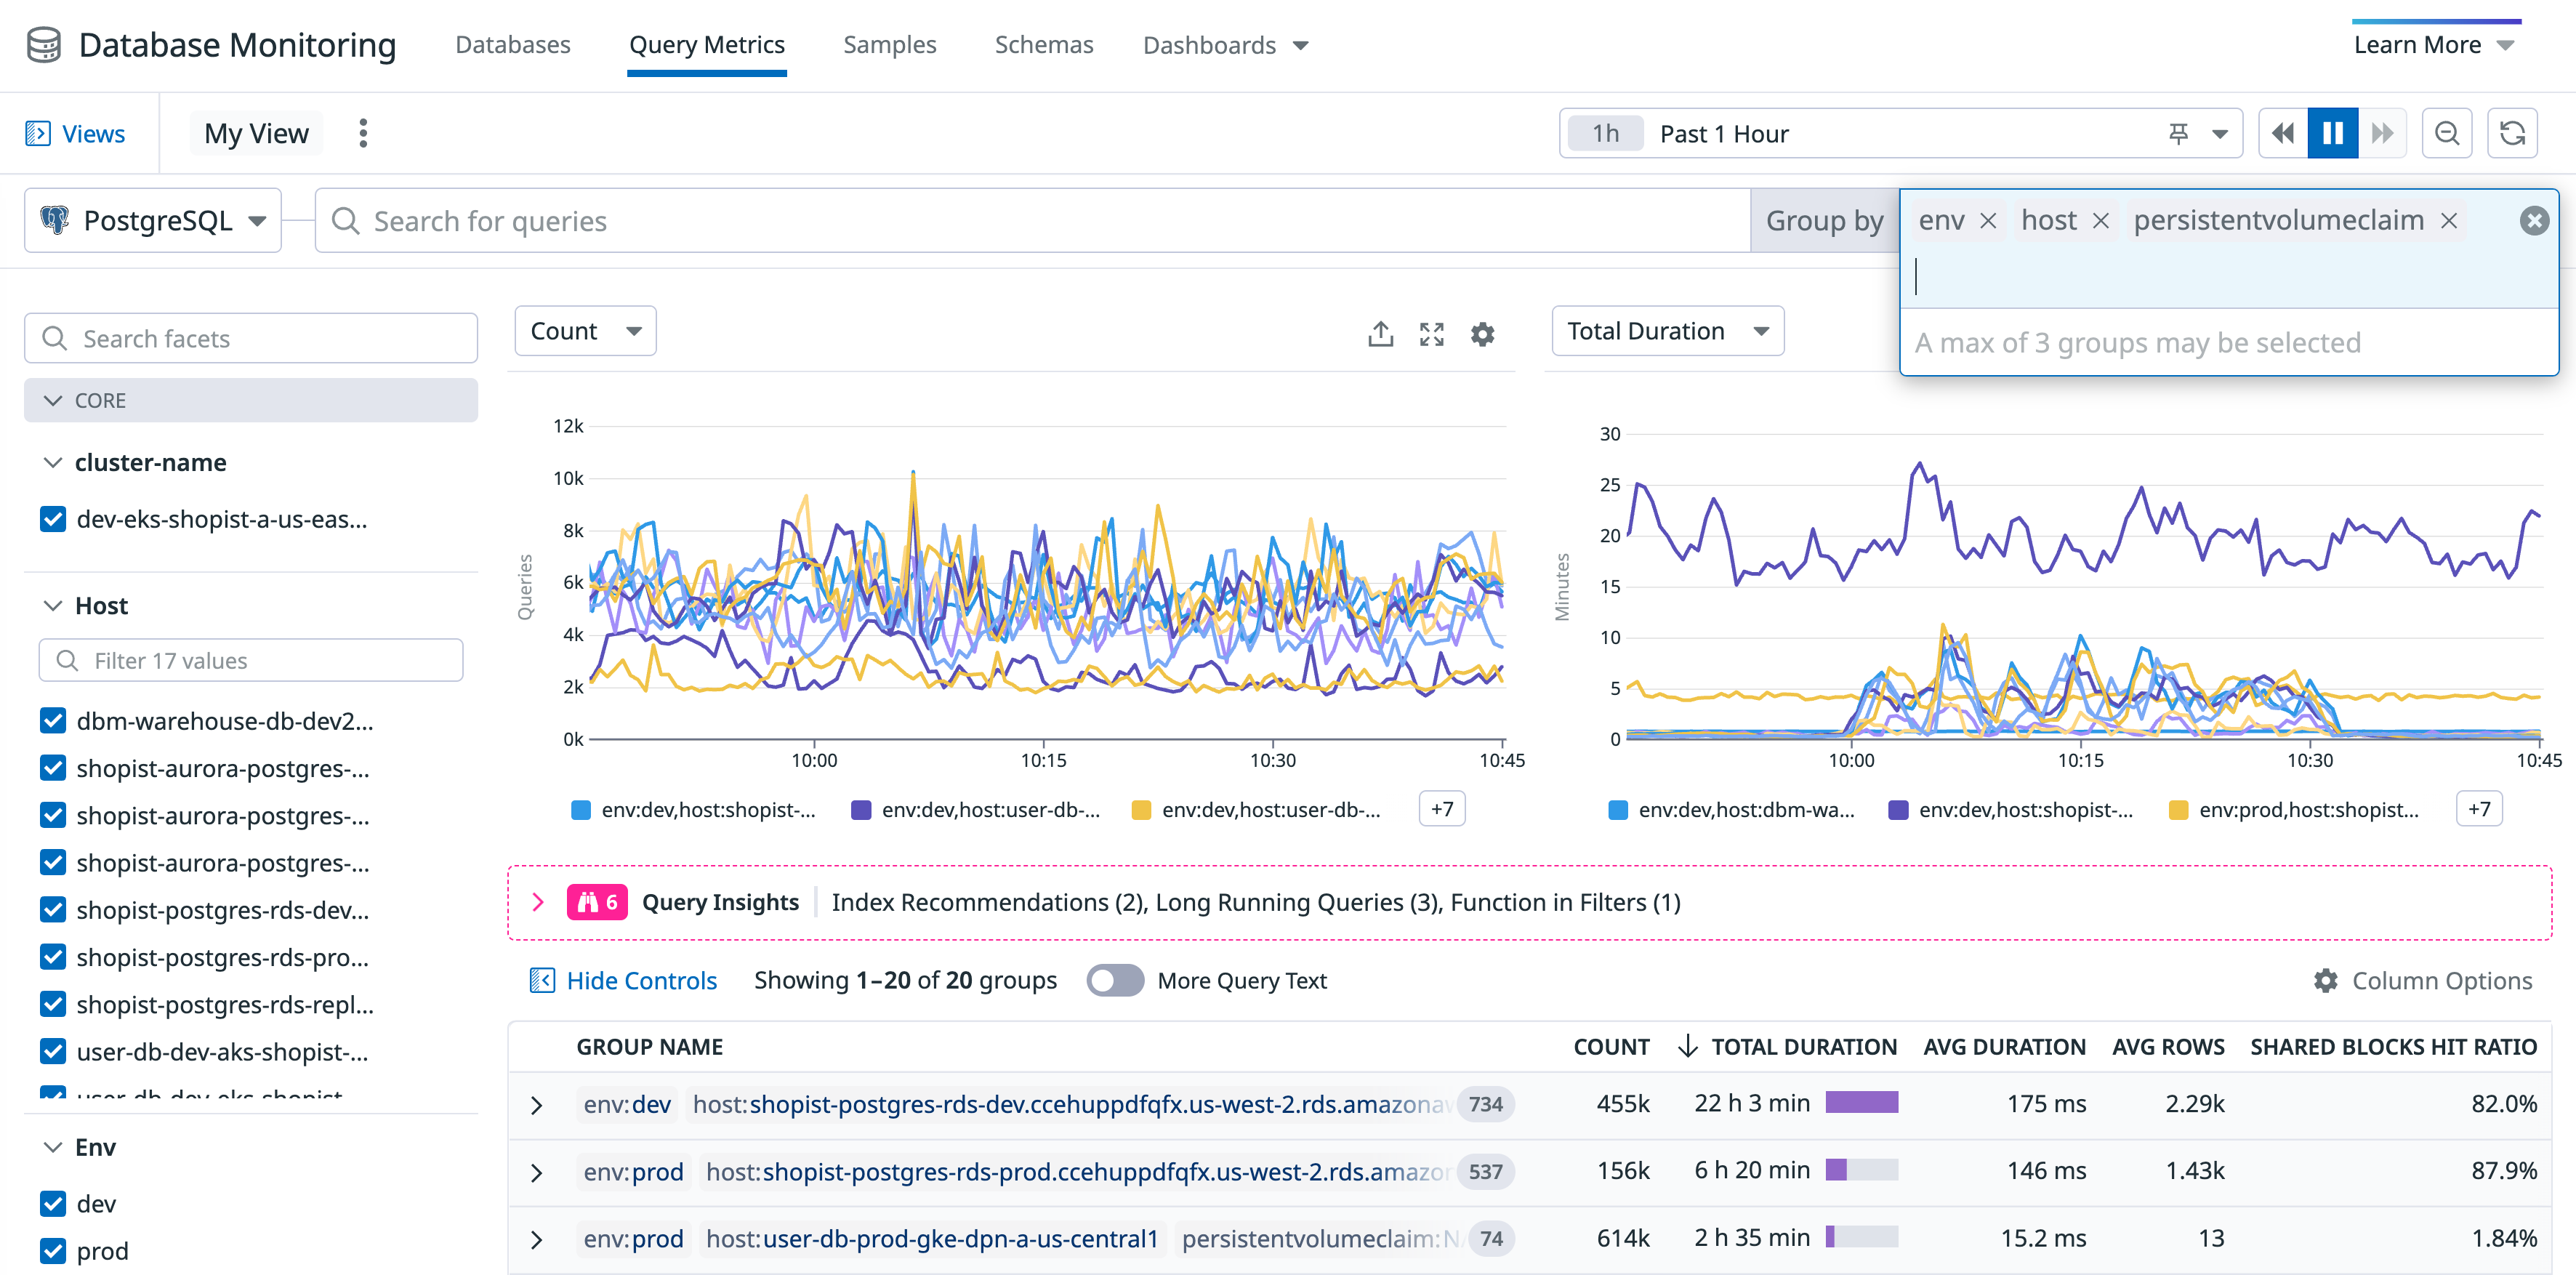
You can group by up to three things (for example, host, env, and datacenter) to get grouped sets of filtered results.
Expand the group to see the list of queries, and click View all queries in this group to move that group-by criteria into the Search field in the filter bar, filtering the page content to that search result.
Filtering by facets
On the left side of the view are lists of facets for filtering the list of queries. The facets include:
- Core: Services, hosts, environments.
- Database: Postgres has
databaseanduserfacets. MySQL hasschemafacets. - Infrastructure: Traditional Datadog infrastructure tags collected by the Agent.
Select or clear facets to find the list of queries you’re interested in.
Filtering the Query Metrics view to a single query
If you want to filter the contents of the Query Metrics view to just one normalized query, filter on the query_signature, not query. Tag names are truncated at 200 characters, and because queries can be long, their query tags aren’t necessarily unique. The query_signature is a hash of a normalized query and serves as a unique ID for the normalized query.
One way to filter to a specific query without looking up its query signature value is to click the query from the list. This opens its Query Details page, where you click Filter to This Query. This filters the Query Metrics page by the query_signature facet.
Exploring the metrics
The Query Metrics list shows Requests, Average latency, Total time, and Percent time metrics, plus others that depend on your database product. Click the Options menu to control which metrics are displayed in the list. Hover over the column heading to see a description for each type of metric. Click the column heading to sort the list by that metric.
To see a complete list of metrics collected, see the integration Data Collected documentation for your database product:
The metrics used for Database Monitoring views are, primarily:
- MySQL:
mysql.queries.* - Postgres:
postgresql.queries.* - SQL Server:
sqlserver.queries.* - Oracle:
oracle.queries.*
Query details page
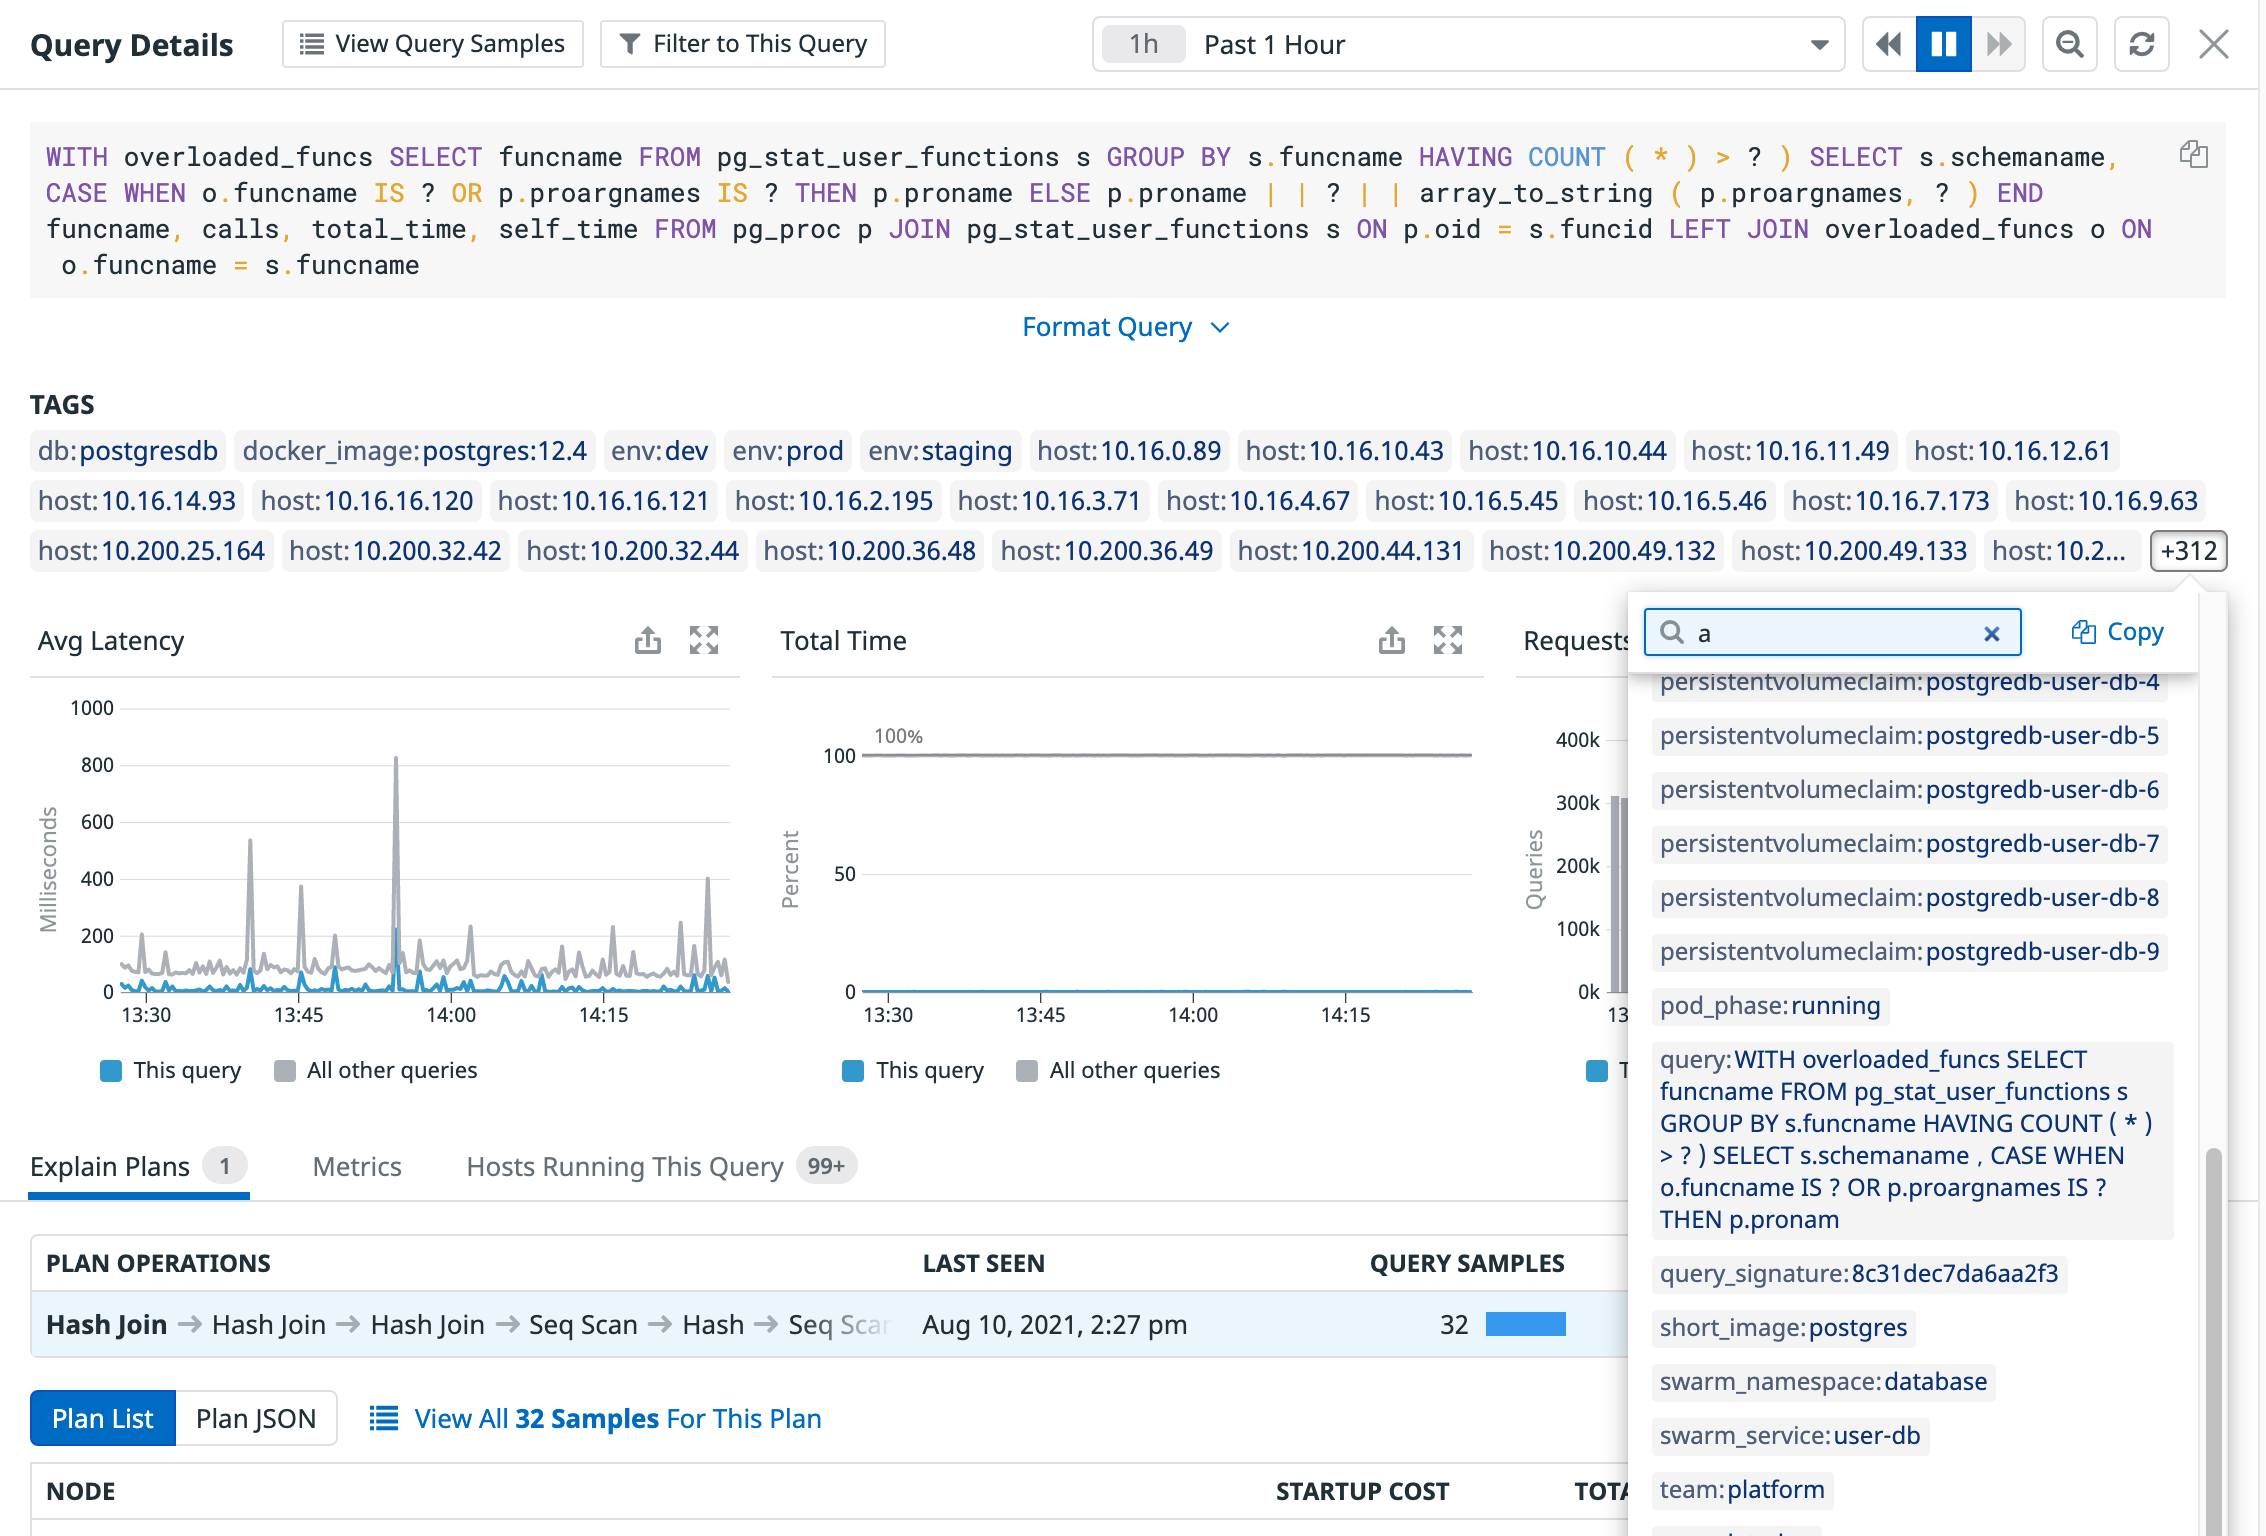
When you click a query in the Query Metrics list, the Query Details page for that query opens. The top of the page shows the full text of the normalized query, and a list of all tags associated with the query. The list of tags is the union of all tags from each host that the query runs on. Browse the list to see information such as what server the query is running on:
Stay in the context of this query and navigate to the Query Samples page with the View Query Samples button, or back to Query Metrics filtered by this query with the Filter by This Query button.
When you’re looking at a query’s details and want to find the hosts it’s running on, click Filter by This Query and then group by hosts. The metrics list shows each host the query is running on. Sort by Percent time to see if a particular host is responsible for a large percentage of a query’s execution.
Sort by Rows/Query to see if a particular host tends to return a lot more rows, indicating that sharding is unbalanced across the hosts.
Metrics graphs
The graphs show metrics for this query compared to all queries except this query. Maybe this query’s average latency is a lot higher than the average of other queries, but also it is executed infrequently so its total impact is minor. You can see how much of the database’s time it is consuming when it does run, compared to all other queries.
Click the Metrics tab to see more graphs of metrics for this query.
Explain plans
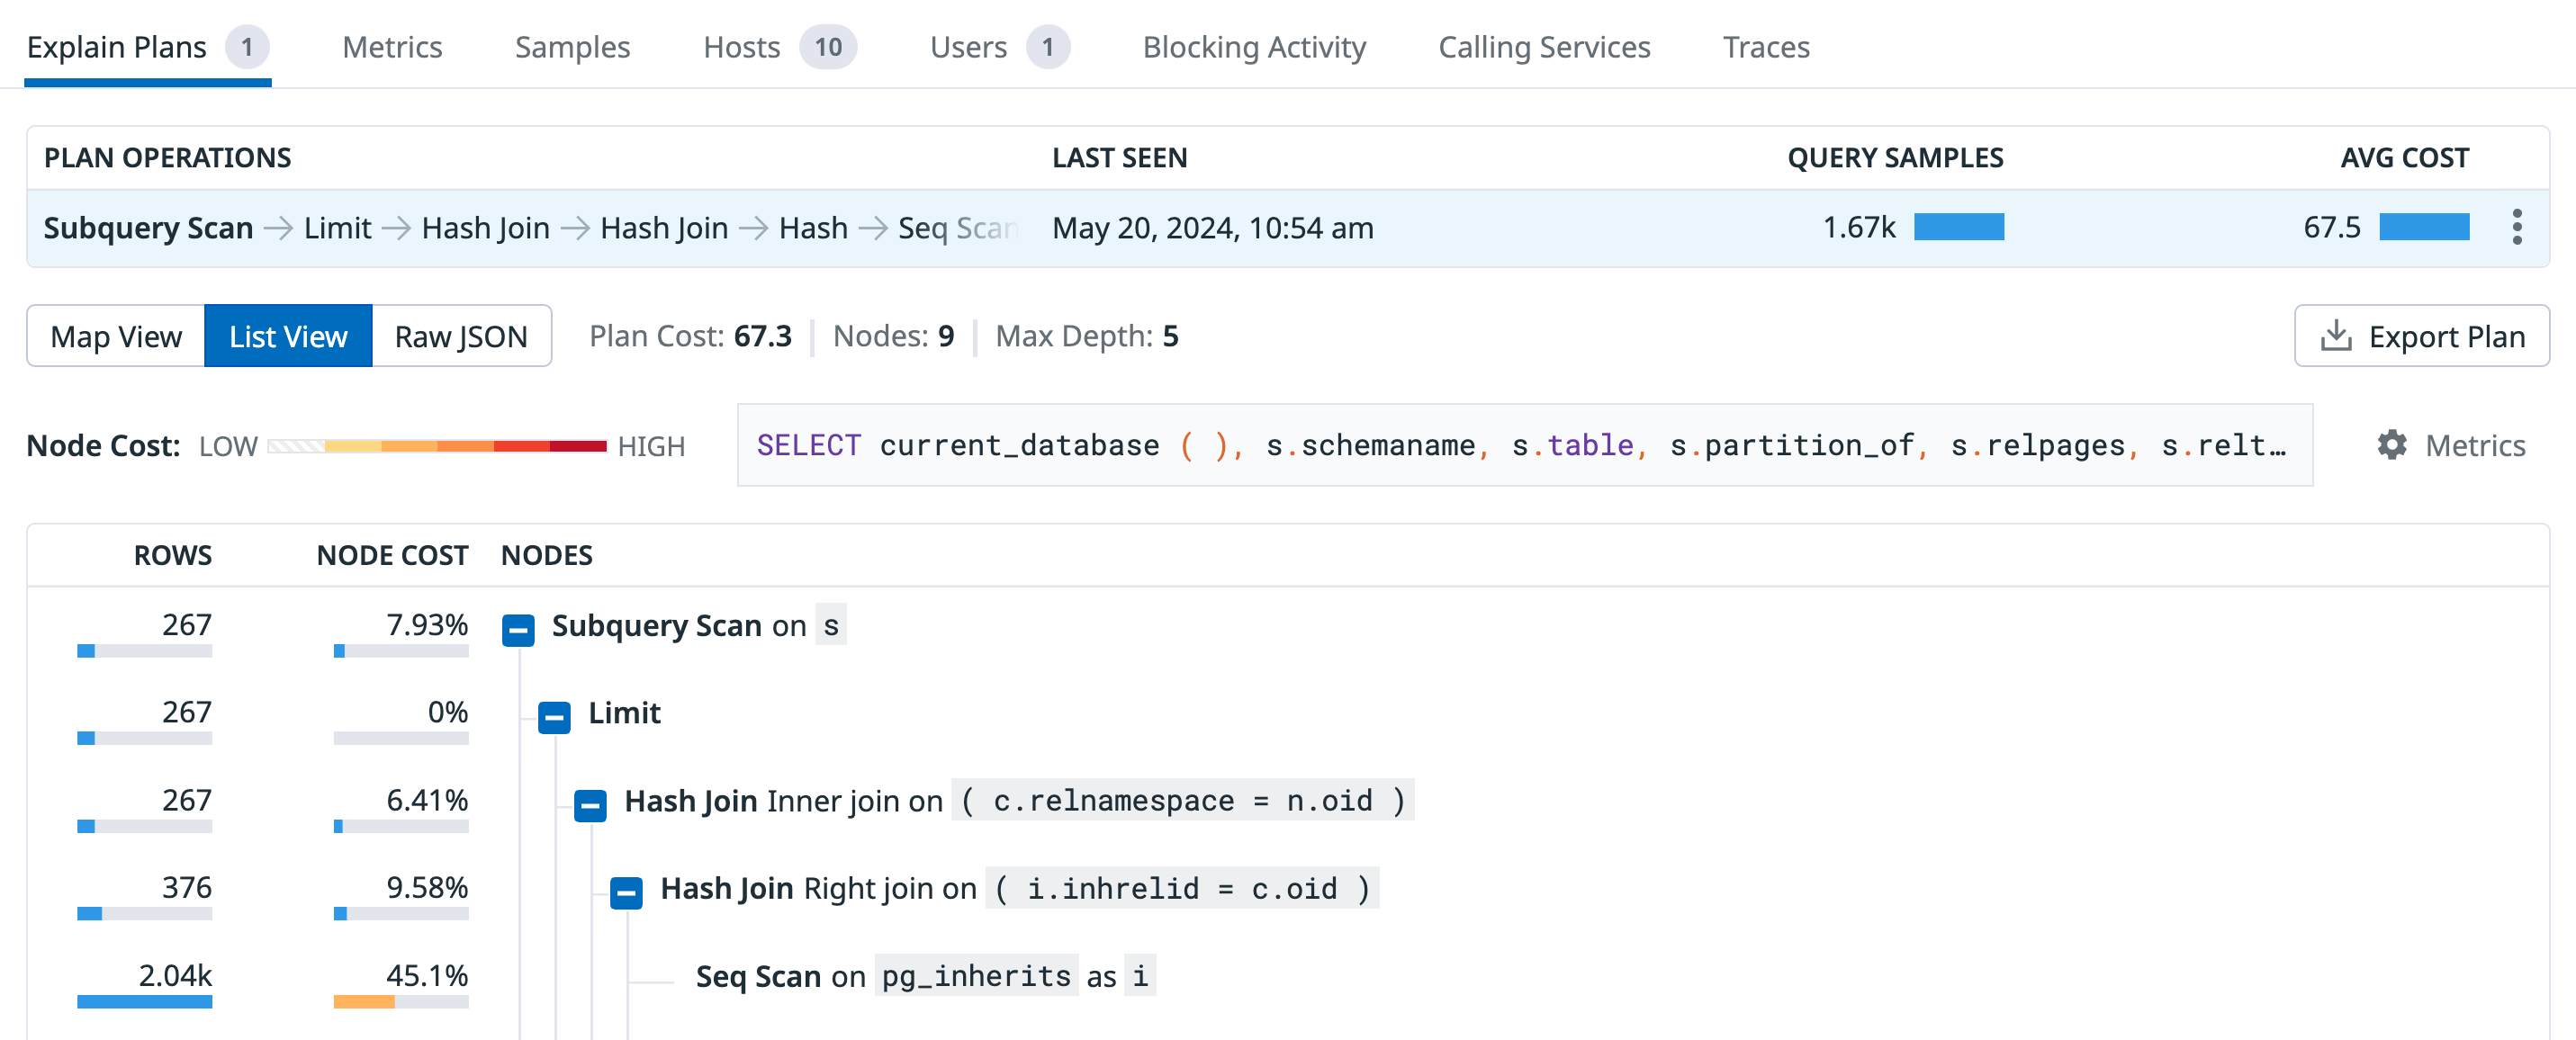
Datadog collects explain plans continuously, so a given query can have multiple plans. Those plans are normalized and shown separately so that you can see if a query has plans that perform better or have higher relative cost than others. For example, the following explain plan contains information for a query:
Select a plan to see cost metrics or its JSON. Click View All Samples for This Plan to navigate to Query Samples view for the samples associated with it.
Not all queries have explain plans, for various reasons, including what type of query it is, or various configuration settings. See Troubleshooting for more details.
Hosts running this query
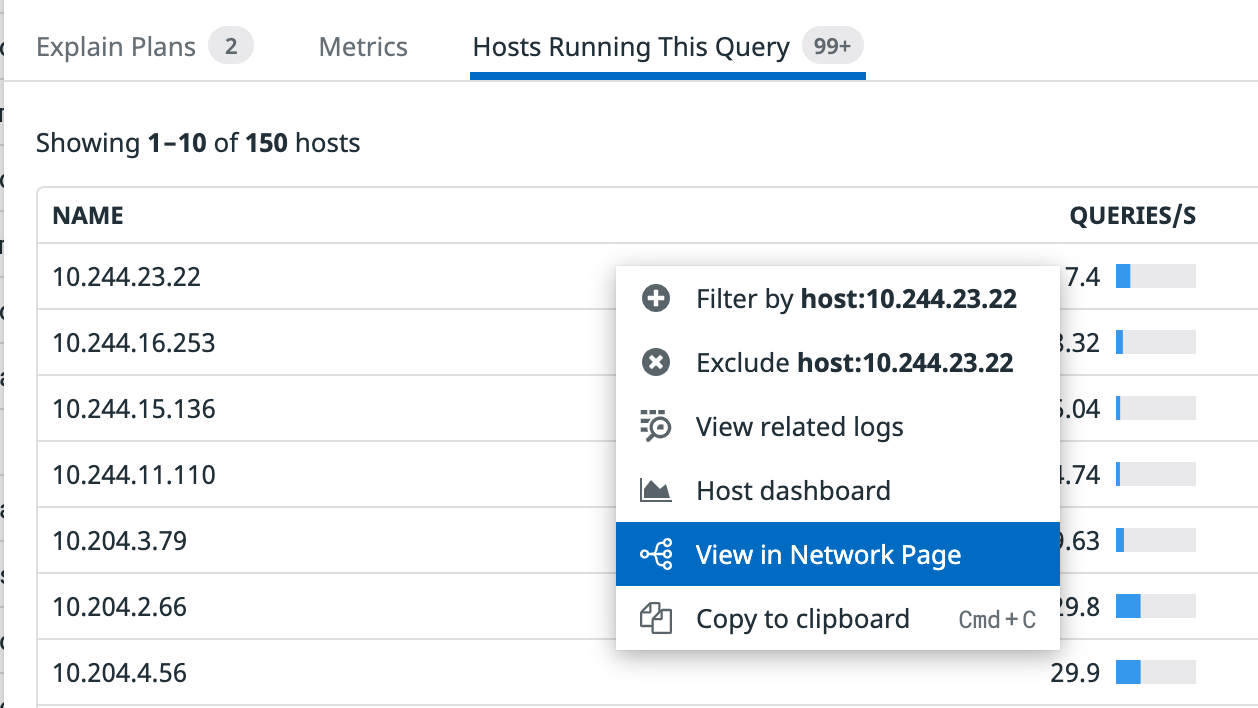
The Hosts Running This Query tab lists the hosts that run this query, with a context menu that lets you navigate to related information for the hosts, such as logs or the network data, which can be useful for troubleshooting where latency problems are coming from.
Database Monitoring dashboards
For quick access to dashboards that showcase database-related infrastructure and query metrics visualizations, click the Dashboards link at the top of the page. Use the out-of-the-box dashboards, or clone and customize them to suit your needs.
Further Reading
Additional helpful documentation, links, and articles:
