- Esenciales
- Empezando
- Datadog
- Sitio web de Datadog
- DevSecOps
- Serverless para Lambda AWS
- Agent
- Integraciones
- Contenedores
- Dashboards
- Monitores
- Logs
- Rastreo de APM
- Generador de perfiles
- Etiquetas (tags)
- API
- Catálogo de servicios
- Session Replay
- Continuous Testing
- Monitorización Synthetic
- Gestión de incidencias
- Monitorización de bases de datos
- Cloud Security Management
- Cloud SIEM
- Application Security Management
- Workflow Automation
- CI Visibility
- Test Visibility
- Intelligent Test Runner
- Análisis de código
- Centro de aprendizaje
- Compatibilidad
- Glosario
- Atributos estándar
- Guías
- Agent
- Uso básico del Agent
- Arquitectura
- IoT
- Plataformas compatibles
- Recopilación de logs
- Configuración
- Configuración remota
- Automatización de flotas
- Actualizar el Agent
- Solucionar problemas
- Detección de nombres de host en contenedores
- Modo de depuración
- Flare del Agent
- Estado del check del Agent
- Problemas de NTP
- Problemas de permisos
- Problemas de integraciones
- Problemas del sitio
- Problemas de Autodiscovery
- Problemas de contenedores de Windows
- Configuración del tiempo de ejecución del Agent
- Consumo elevado de memoria o CPU
- Guías
- Seguridad de datos
- Integraciones
- OpenTelemetry
- Desarrolladores
- Autorización
- DogStatsD
- Checks personalizados
- Integraciones
- Crear una integración basada en el Agent
- Crear una integración API
- Crear un pipeline de logs
- Referencia de activos de integración
- Crear una oferta de mercado
- Crear un cuadro
- Crear un dashboard de integración
- Crear un monitor recomendado
- Crear una regla de detección Cloud SIEM
- OAuth para integraciones
- Instalar la herramienta de desarrollo de integraciones del Agente
- Checks de servicio
- Complementos de IDE
- Comunidad
- Guías
- API
- Aplicación móvil de Datadog
- CoScreen
- Cloudcraft
- En la aplicación
- Dashboards
- Notebooks
- Editor DDSQL
- Hojas
- Monitores y alertas
- Infraestructura
- Métricas
- Watchdog
- Bits AI
- Catálogo de servicios
- Catálogo de APIs
- Error Tracking
- Gestión de servicios
- Objetivos de nivel de servicio (SLOs)
- Gestión de incidentes
- De guardia
- Gestión de eventos
- Gestión de casos
- Workflow Automation
- App Builder
- Infraestructura
- Universal Service Monitoring
- Contenedores
- Serverless
- Monitorización de red
- Coste de la nube
- Rendimiento de las aplicaciones
- APM
- Términos y conceptos de APM
- Instrumentación de aplicación
- Recopilación de métricas de APM
- Configuración de pipelines de trazas
- Correlacionar trazas (traces) y otros datos de telemetría
- Trace Explorer
- Observabilidad del servicio
- Instrumentación dinámica
- Error Tracking
- Seguridad de los datos
- Guías
- Solucionar problemas
- Continuous Profiler
- Database Monitoring
- Gastos generales de integración del Agent
- Arquitecturas de configuración
- Configuración de Postgres
- Configuración de MySQL
- Configuración de SQL Server
- Configuración de Oracle
- Configuración de MongoDB
- Conexión de DBM y trazas
- Datos recopilados
- Explorar hosts de bases de datos
- Explorar métricas de consultas
- Explorar ejemplos de consulta
- Solucionar problemas
- Guías
- Data Streams Monitoring
- Data Jobs Monitoring
- Experiencia digital
- Real User Monitoring
- Monitorización del navegador
- Configuración
- Configuración avanzada
- Datos recopilados
- Monitorización del rendimiento de páginas
- Monitorización de signos vitales de rendimiento
- Monitorización del rendimiento de recursos
- Recopilación de errores del navegador
- Rastrear las acciones de los usuarios
- Señales de frustración
- Error Tracking
- Solucionar problemas
- Monitorización de móviles y TV
- Plataforma
- Session Replay
- Exploración de datos de RUM
- Feature Flag Tracking
- Error Tracking
- Guías
- Seguridad de los datos
- Monitorización del navegador
- Análisis de productos
- Pruebas y monitorización de Synthetics
- Continuous Testing
- Entrega de software
- CI Visibility
- CD Visibility
- Test Visibility
- Configuración
- Tests en contenedores
- Búsqueda y gestión
- Explorador
- Monitores
- Flujos de trabajo de desarrolladores
- Cobertura de código
- Instrumentar tests de navegador con RUM
- Instrumentar tests de Swift con RUM
- Detección temprana de defectos
- Reintentos automáticos de tests
- Correlacionar logs y tests
- Guías
- Solucionar problemas
- Intelligent Test Runner
- Code Analysis
- Quality Gates
- Métricas de DORA
- Seguridad
- Información general de seguridad
- Cloud SIEM
- Cloud Security Management
- Application Security Management
- Observabilidad de la IA
- Log Management
- Observability Pipelines
- Gestión de logs
- Administración
- Gestión de cuentas
- Seguridad de los datos
- Sensitive Data Scanner
- Ayuda
Getting Started with Code Analysis
This page is not yet available in Spanish. We are working on its translation.
If you have any questions or feedback about our current translation project, feel free to reach out to us!
If you have any questions or feedback about our current translation project, feel free to reach out to us!
Overview
Datadog Code Analysis allows you to identify and resolve code quality issues and security vulnerabilities before deploying to production, ensuring safe and clean code throughout the software development lifecycle.
Code Analysis offers a comprehensive suite of tools, including Static Analysis and Software Composition Analysis, to improve overall software delivery.
- Static Analysis (SAST) scans your repositories for quality and security issues in first-party code, and suggests fixes to prevent these issues from impacting production.
- Software Composition Analysis (SCA) scans your codebase for imported open source libraries, helping you manage your dependencies and secure your applications from external threats.
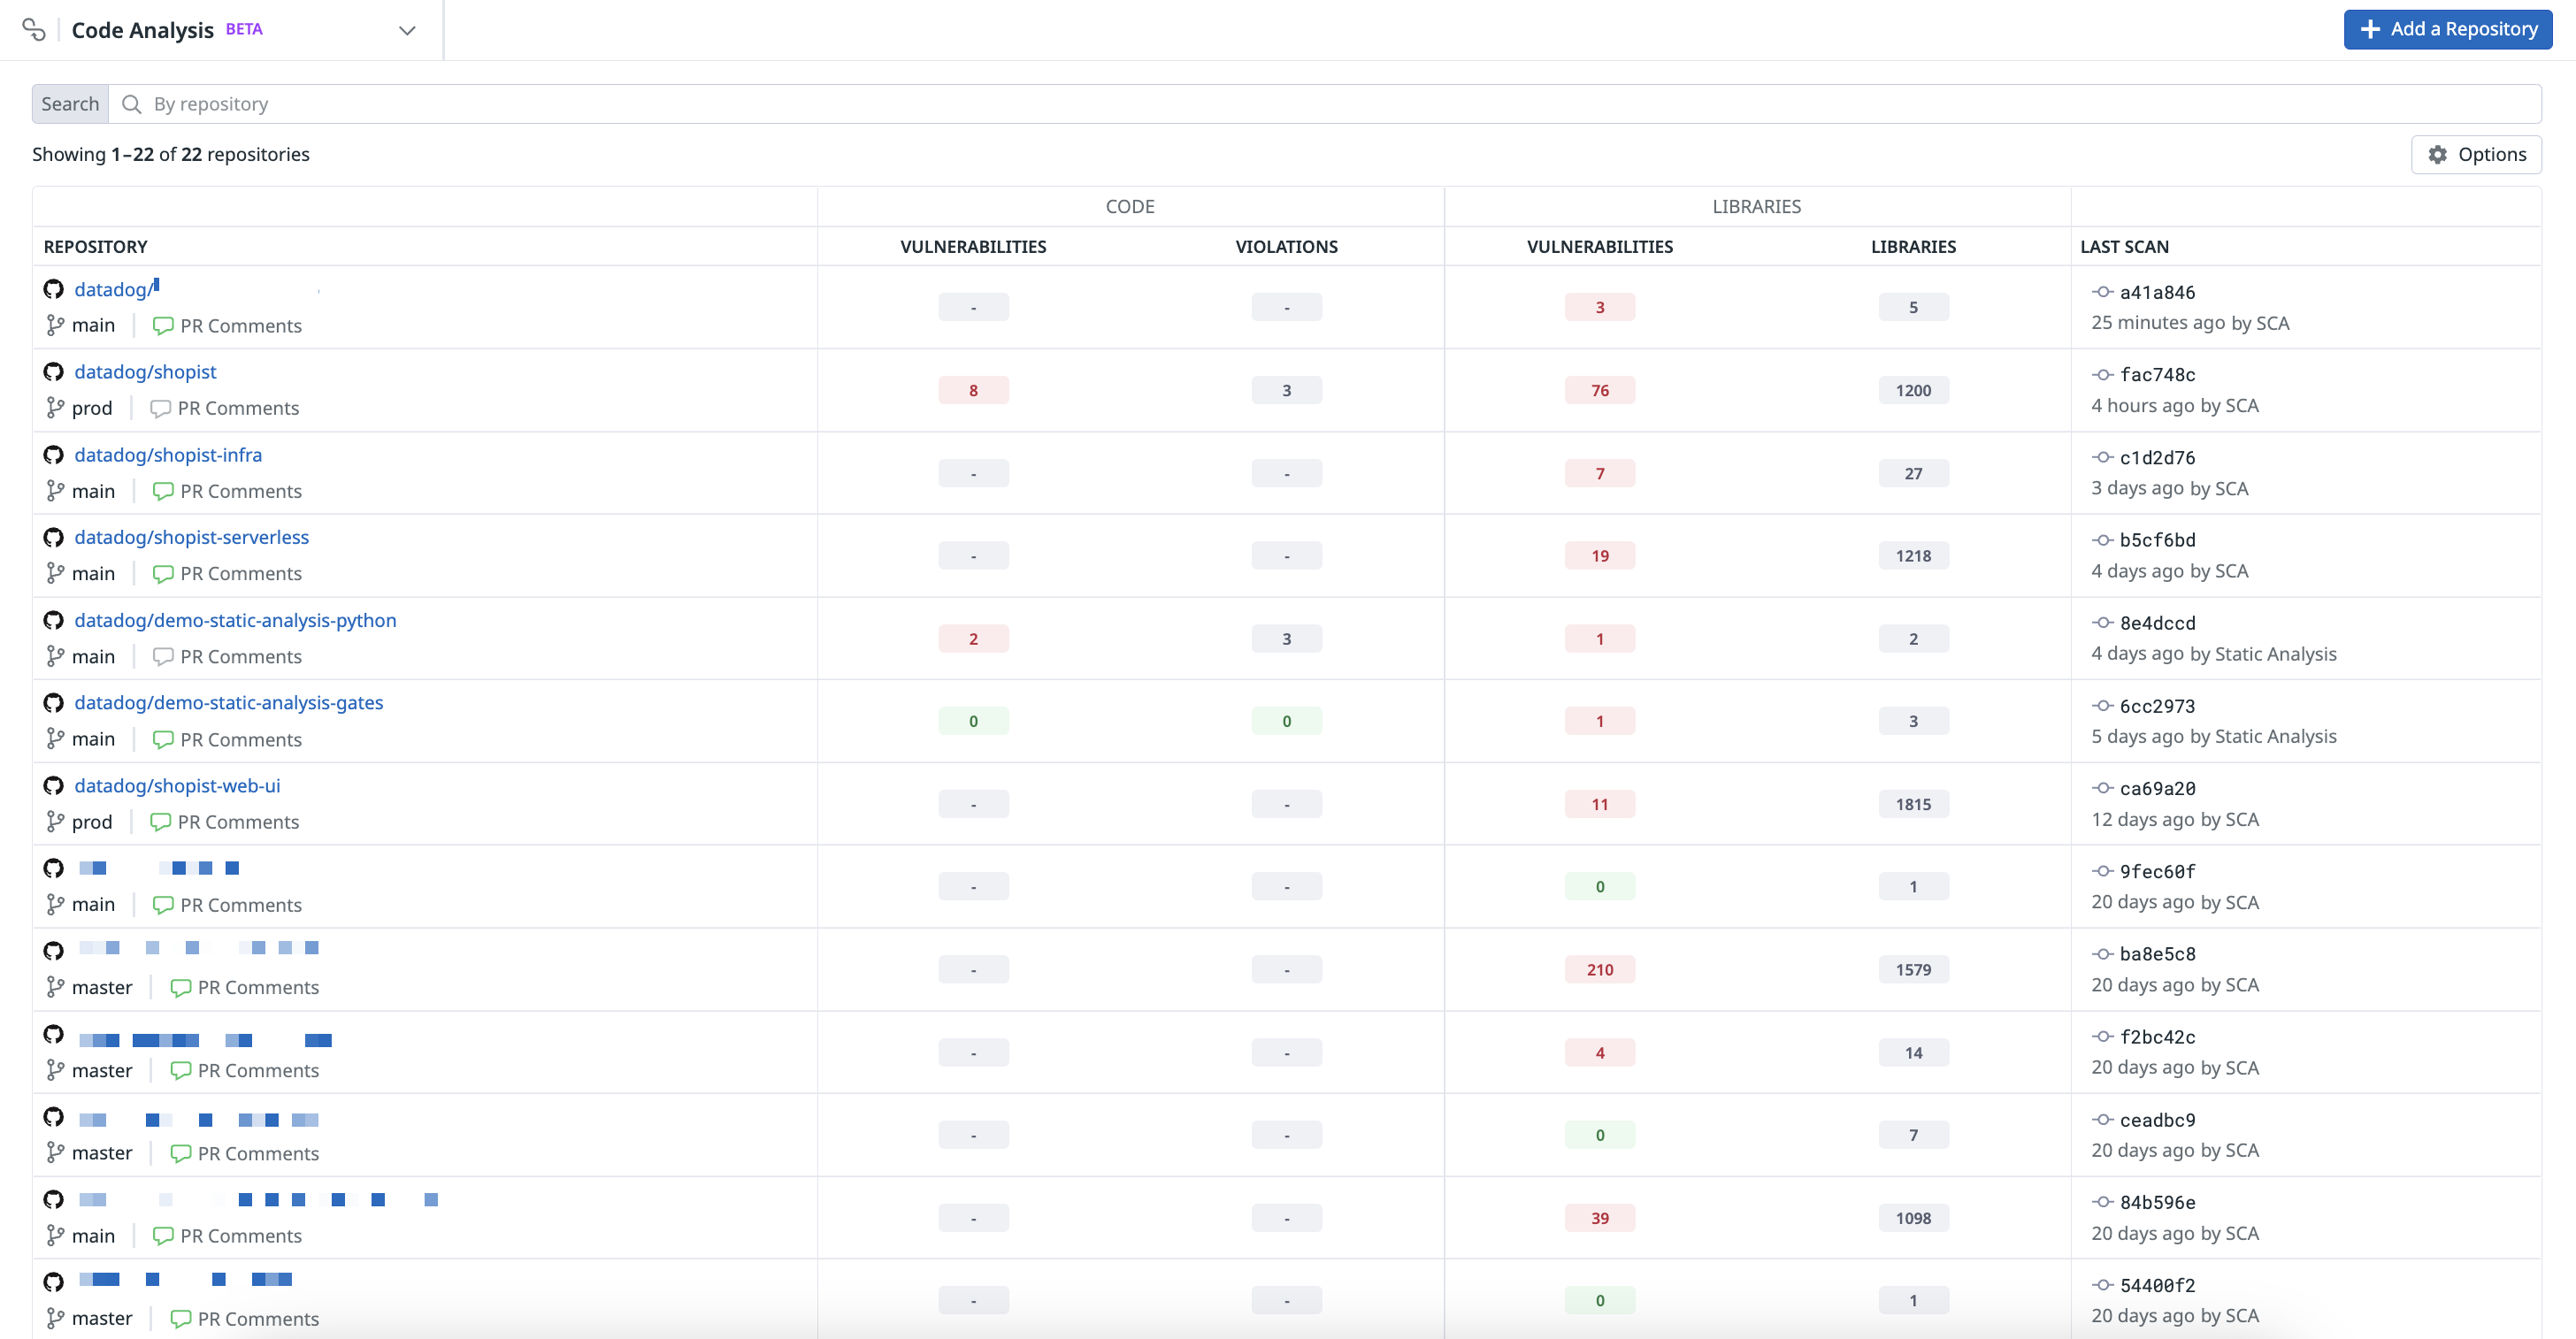
By using datadog-ci, you can integrate analyses from other providers into your development workflow, allowing you to send Static Analysis and SCA results directly to Datadog. You can access the latest scan results for each repository on the Repositories page to effectively monitor and enhance code health across all branches.
Set up Code Analysis
You can configure Code Analysis to run scans on code directly in Datadog or on code running in your CI pipelines. To get started, navigate to Software Delivery > Code Analysis > Repositories and click + Add a Repository.
With Datadog-hosted scans, your code is scanned within Datadog’s infrastructure as opposed to within your CI pipeline. Datadog reads your code, runs the static analyzer to perform Static Analysis and/or Software Composition Analysis, and uploads the results.
Using Datadog-hosted scans eliminates the need for you to configure a CI pipeline so you can use Code Analysis.
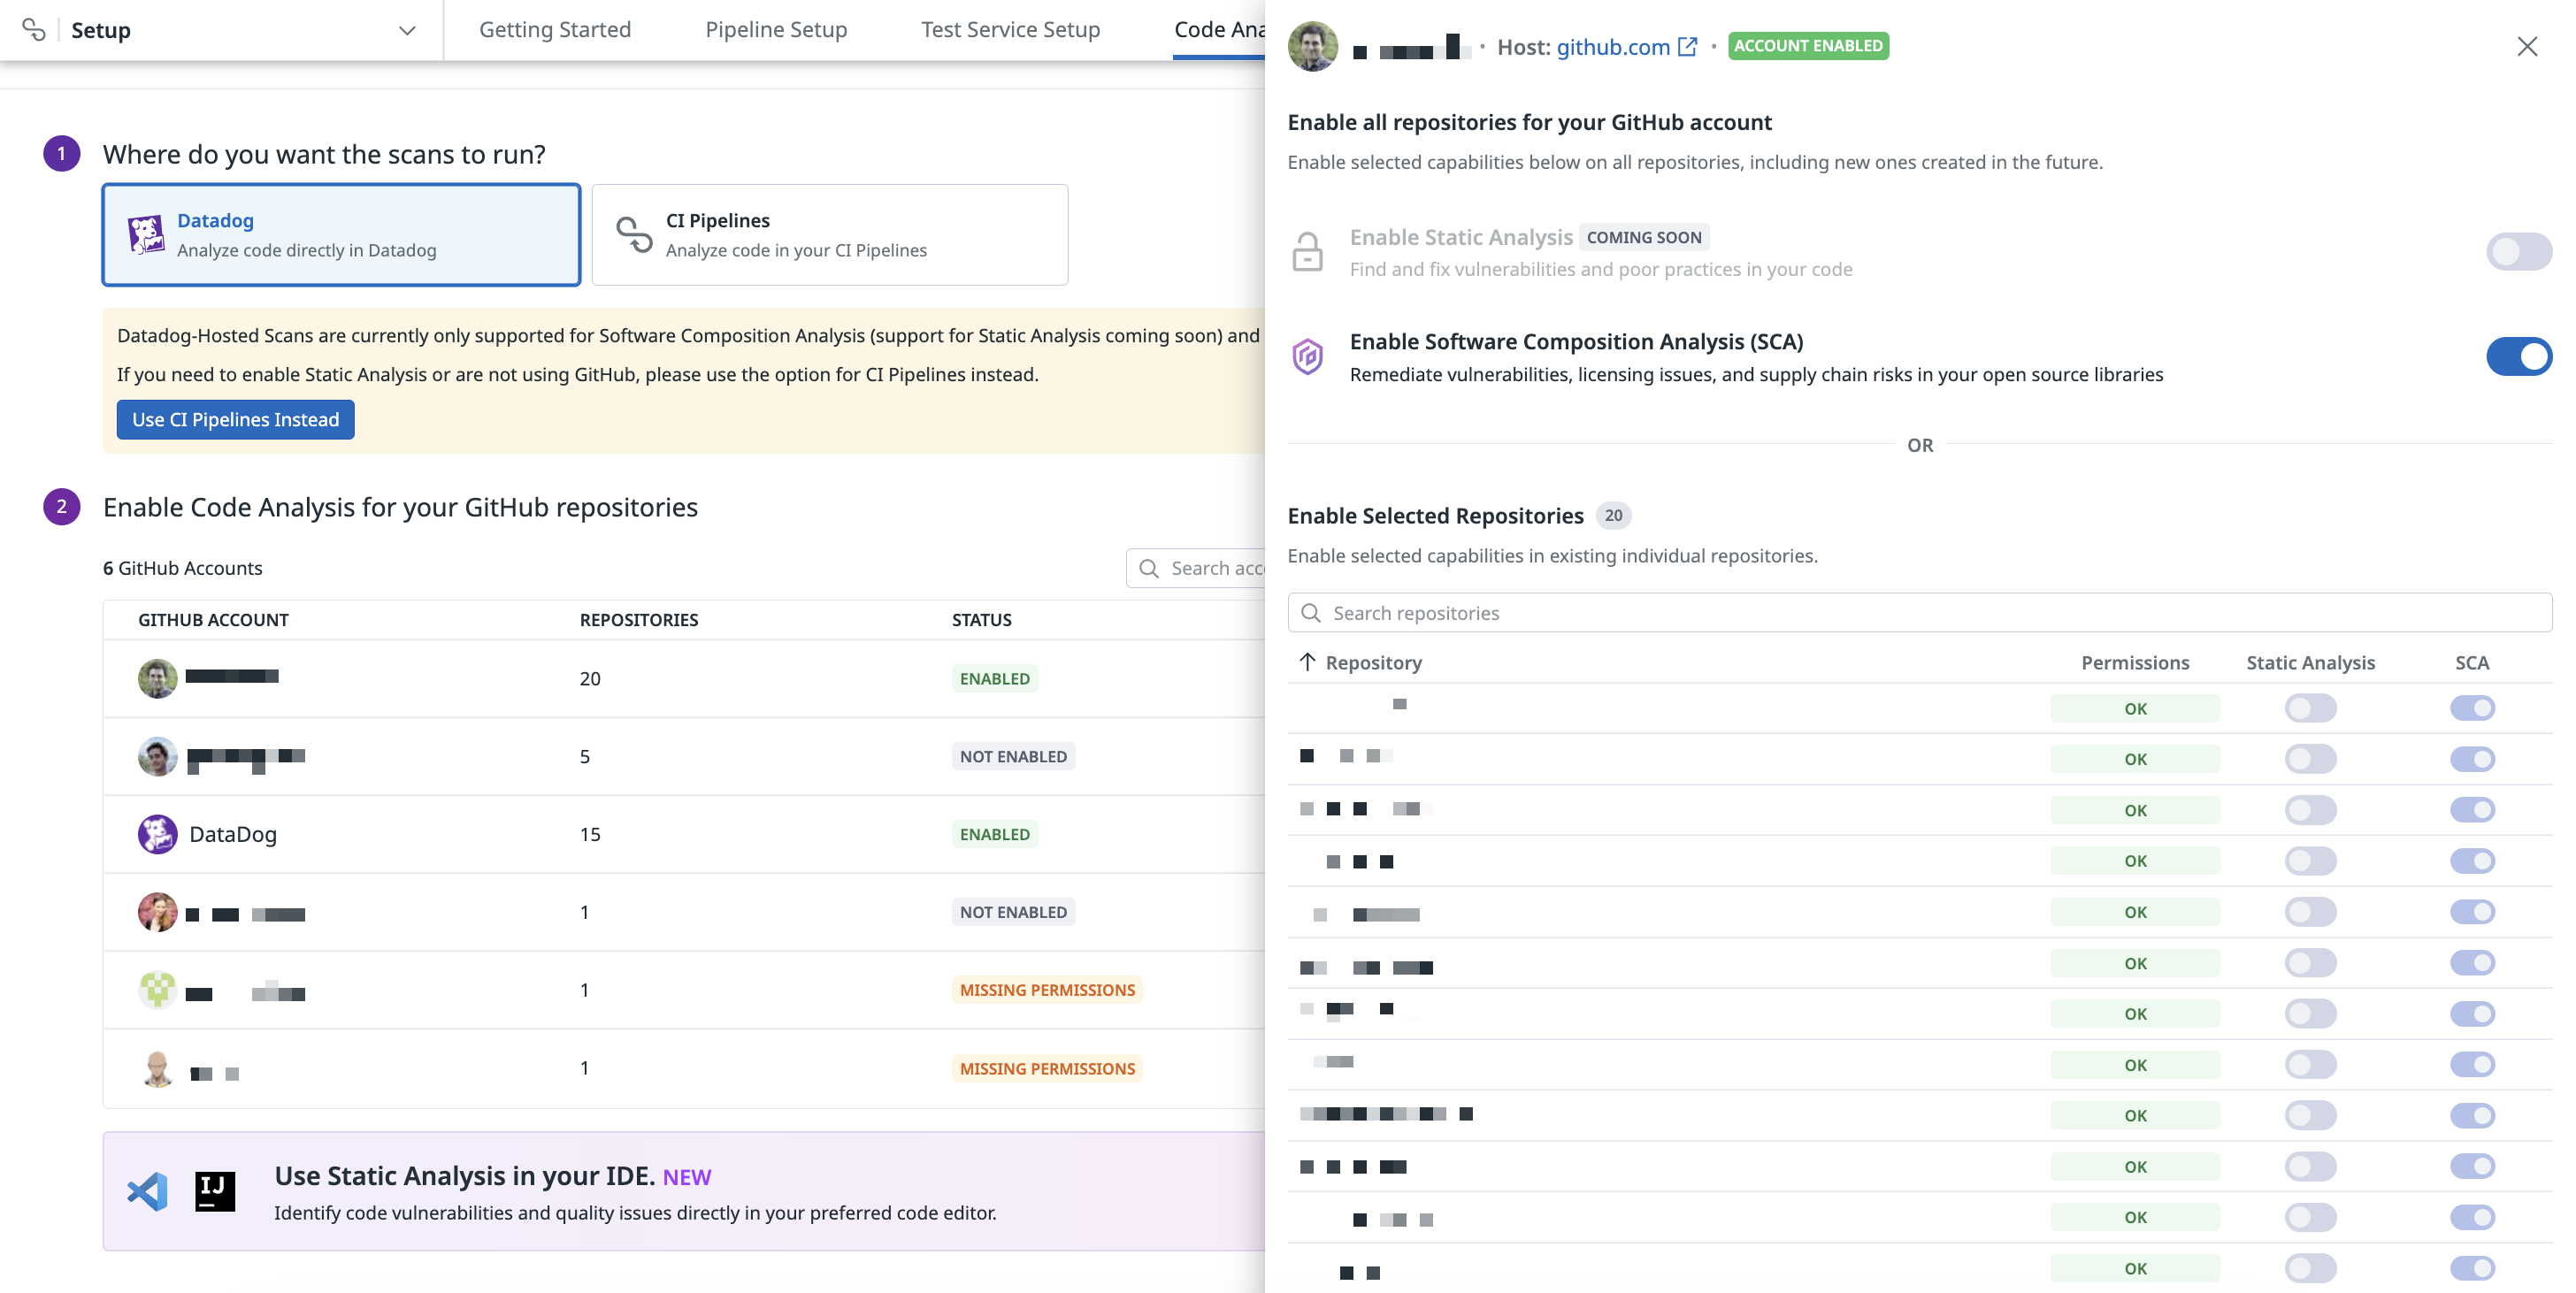
Enable Code Analysis on your GitHub repositories for each GitHub Account you’ve added by setting up the GitHub integration.
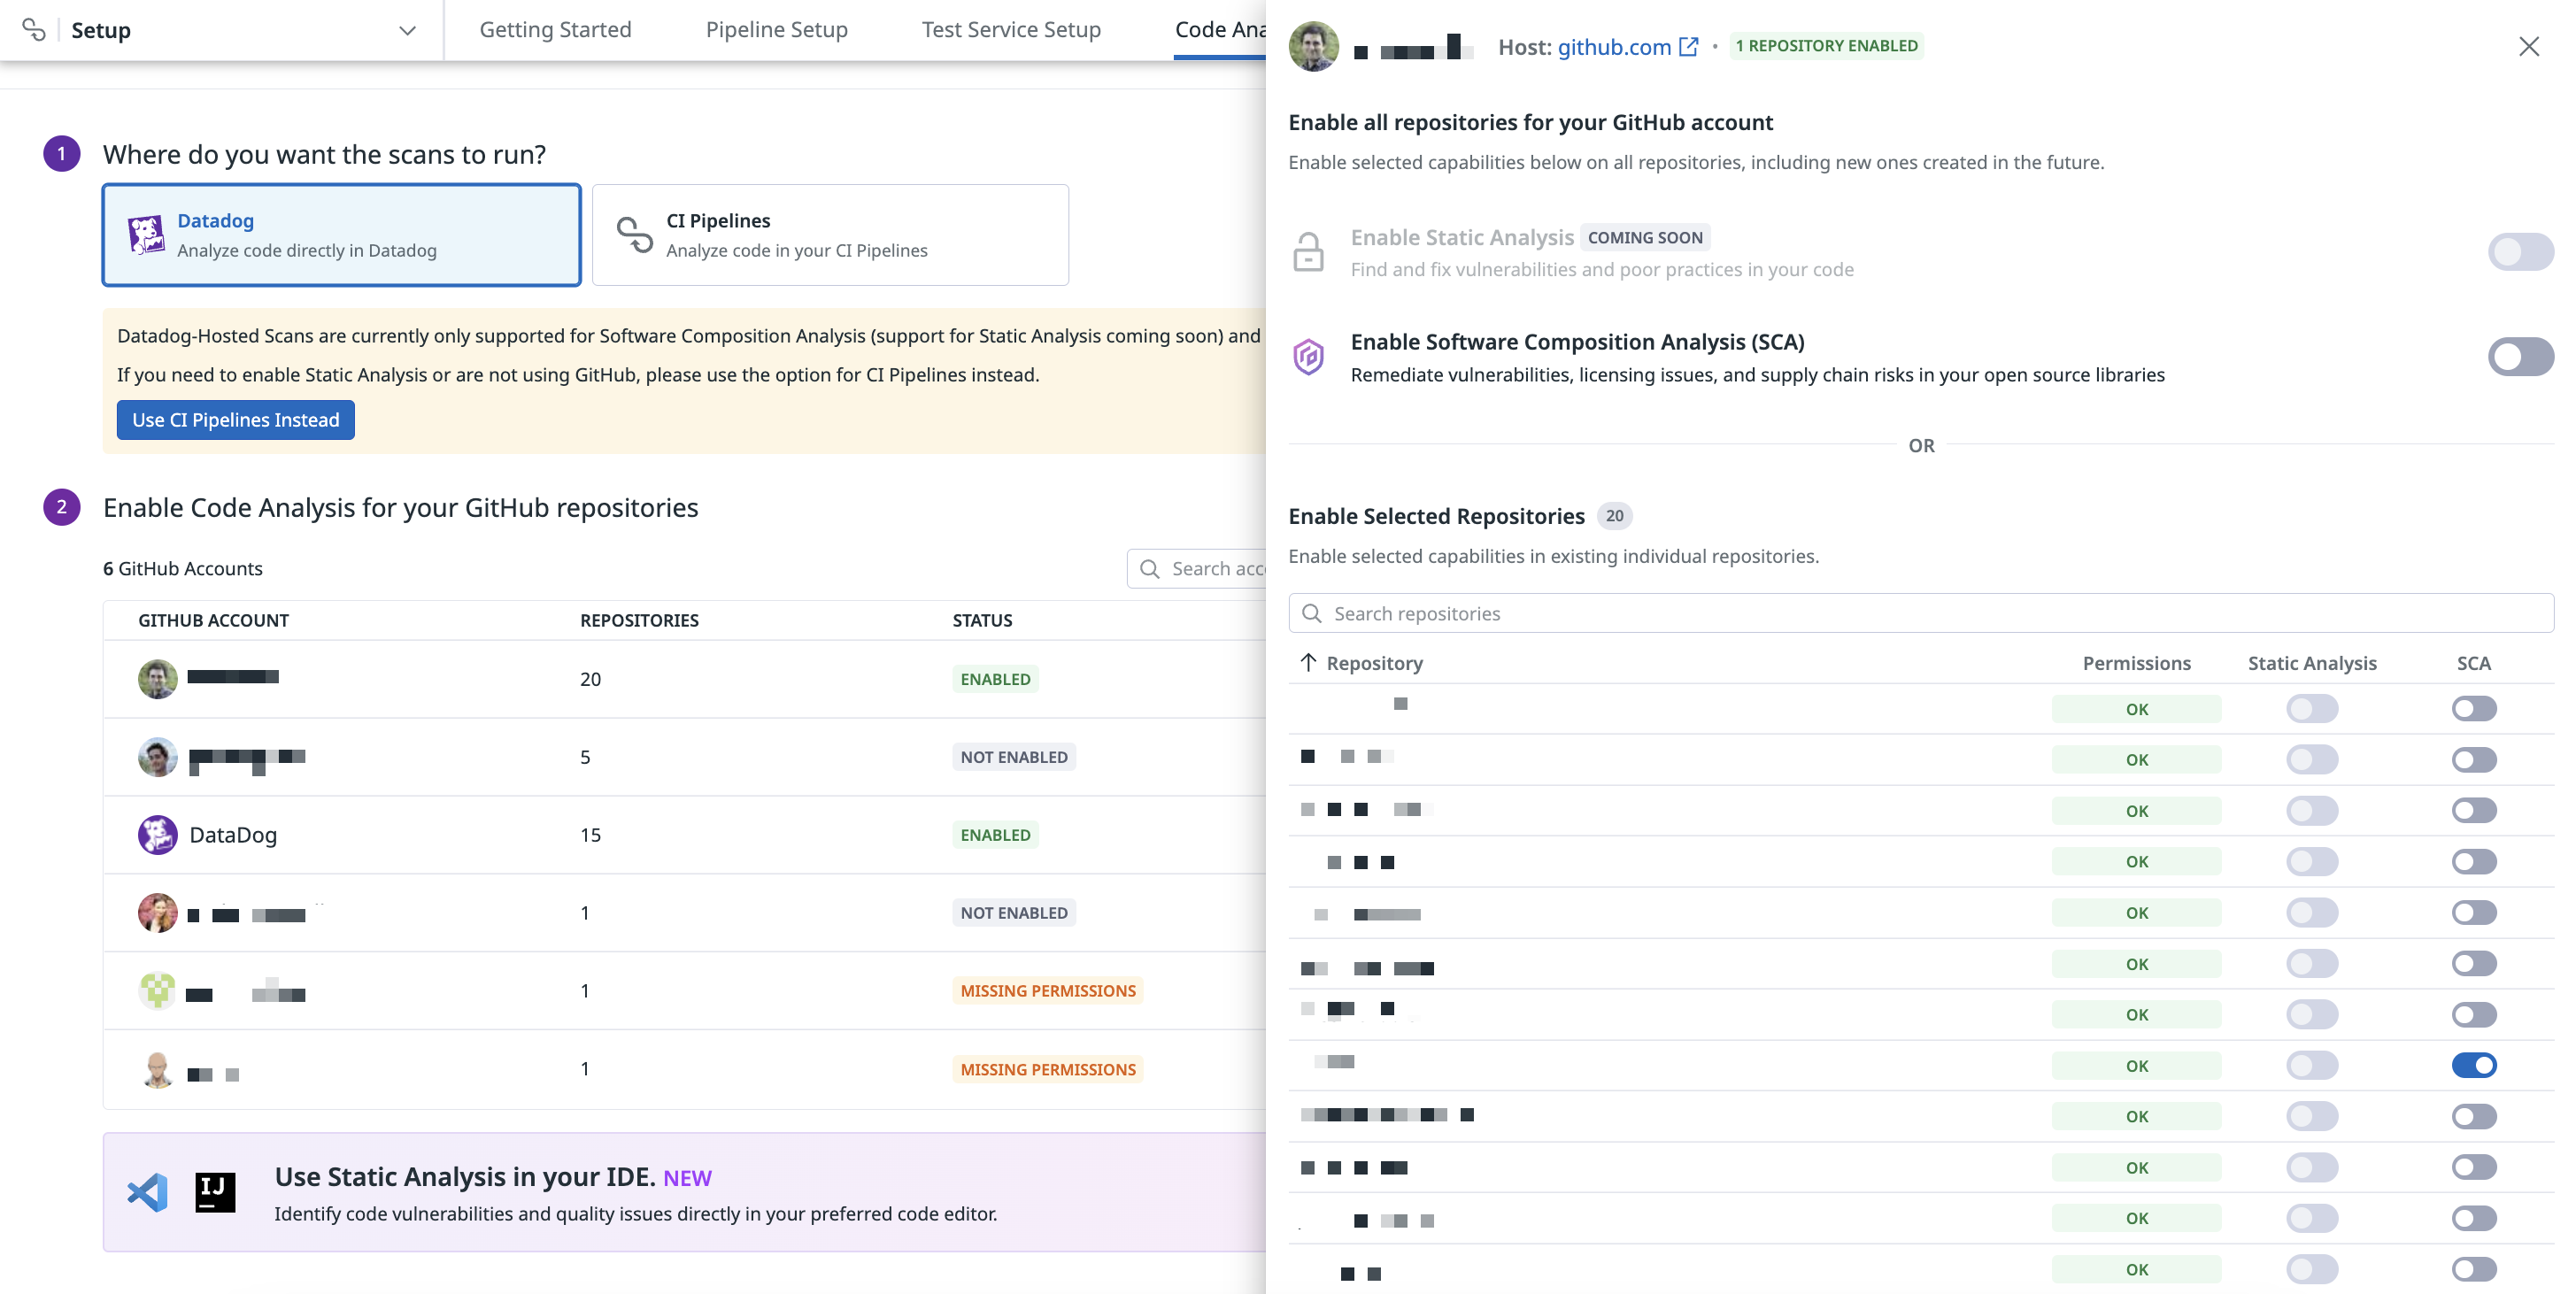
You can either enable Software Composition Analysis (SCA) to scan for vulnerabilities, licensing issues, and supply chain risks in your open source libraries for all repositories, or you can enable SCA for individual repositories in the Repositories side panel.
Select from the following types of scans you want to run in your repository.
- Static Analysis: Examine your code for poor practices and vulnerabilities.
- Software Composition Analysis: Check your third-party libraries for vulnerabilities.
Select a source code management (SCM) provider such as GitHub or another provider.
GitHub
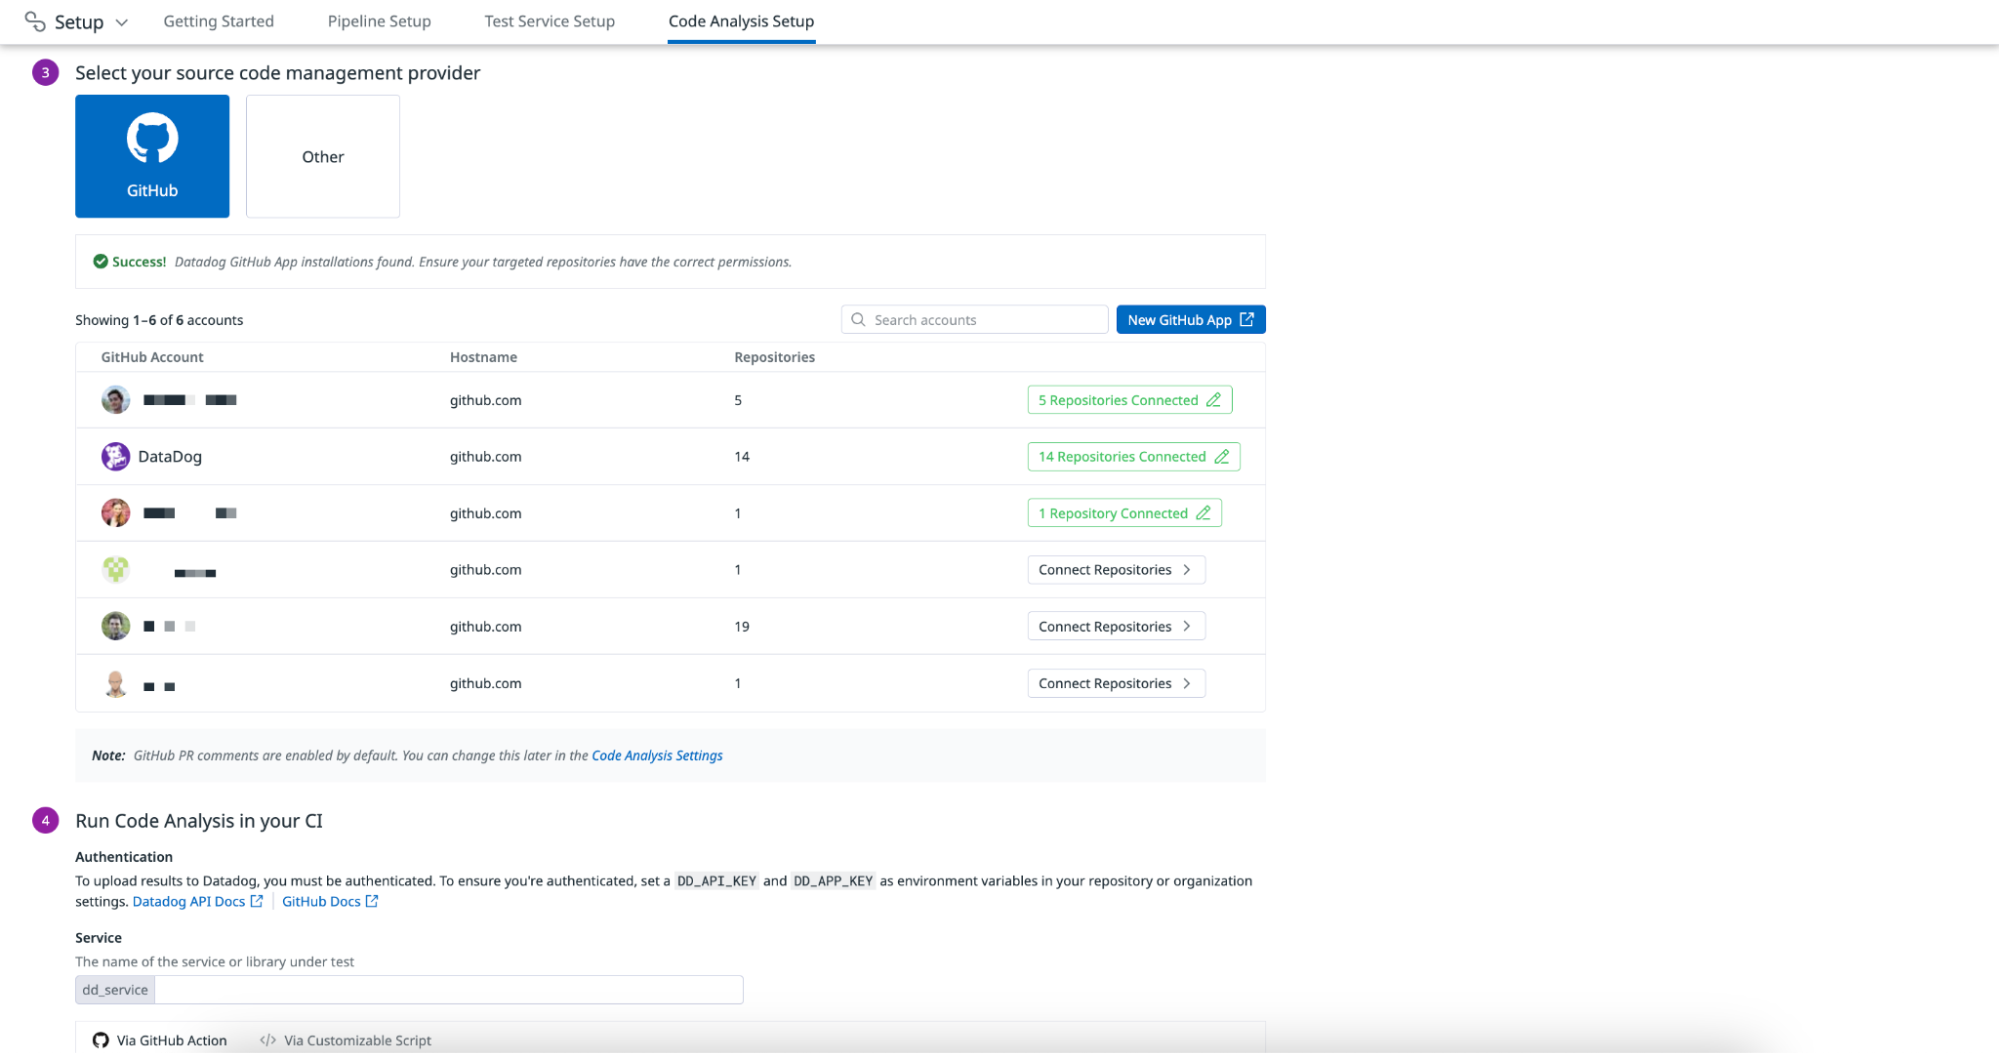
If you are using a GitHub repository, you can set up the GitHub integration and connect your repository to enable Static Analysis and Software Composition Analysis scans.
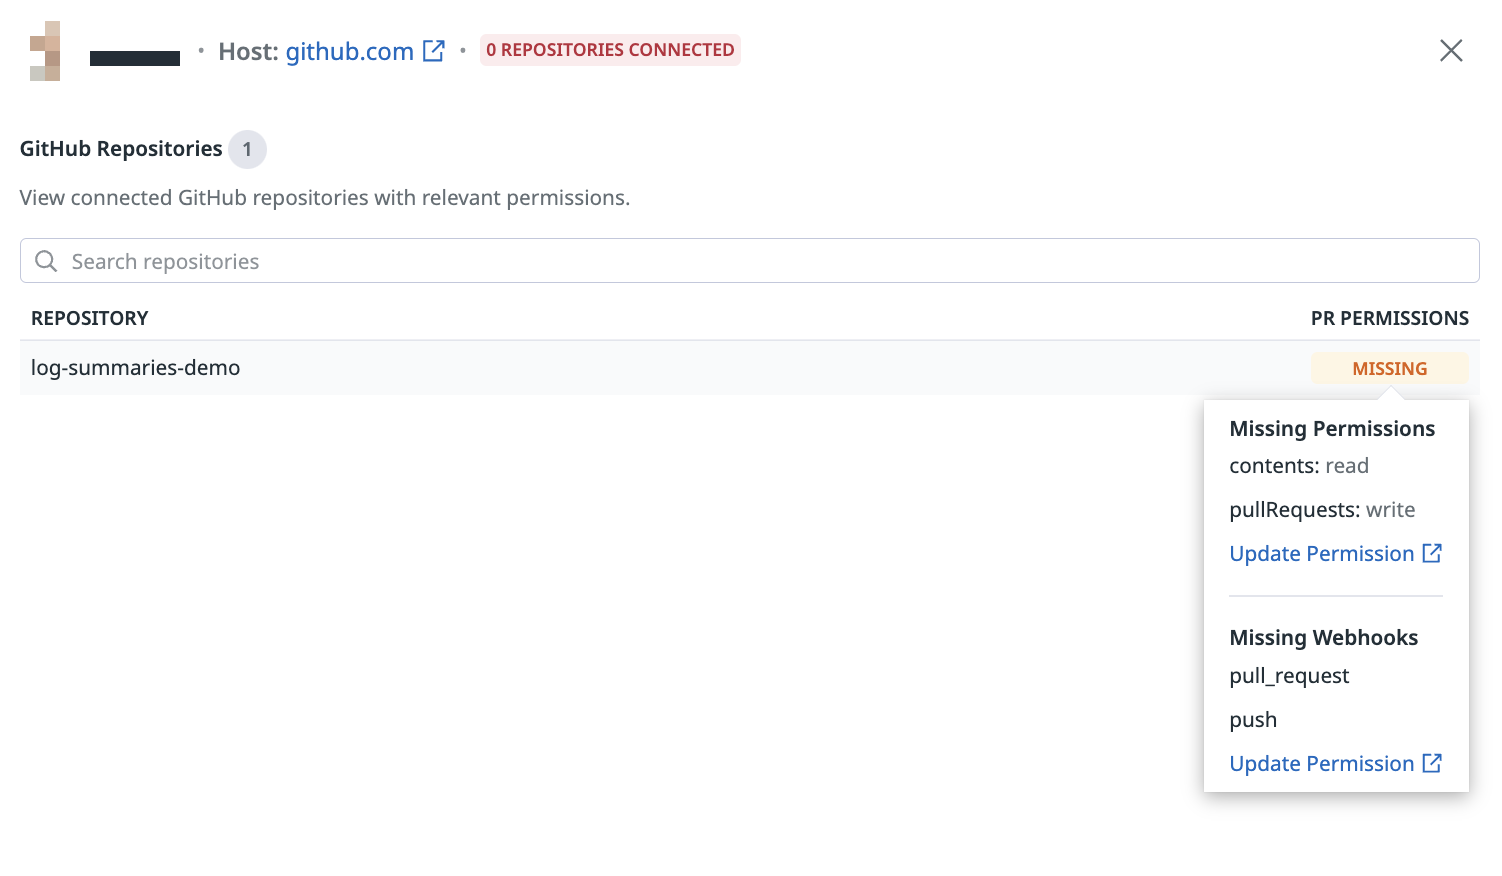
Comments in GitHub pull requests are enabled by default. Click Connect Repositories on the Code Analysis Setup page and hover over the Missing flag on the PR Permissions column to see which permissions you need to update for your account.
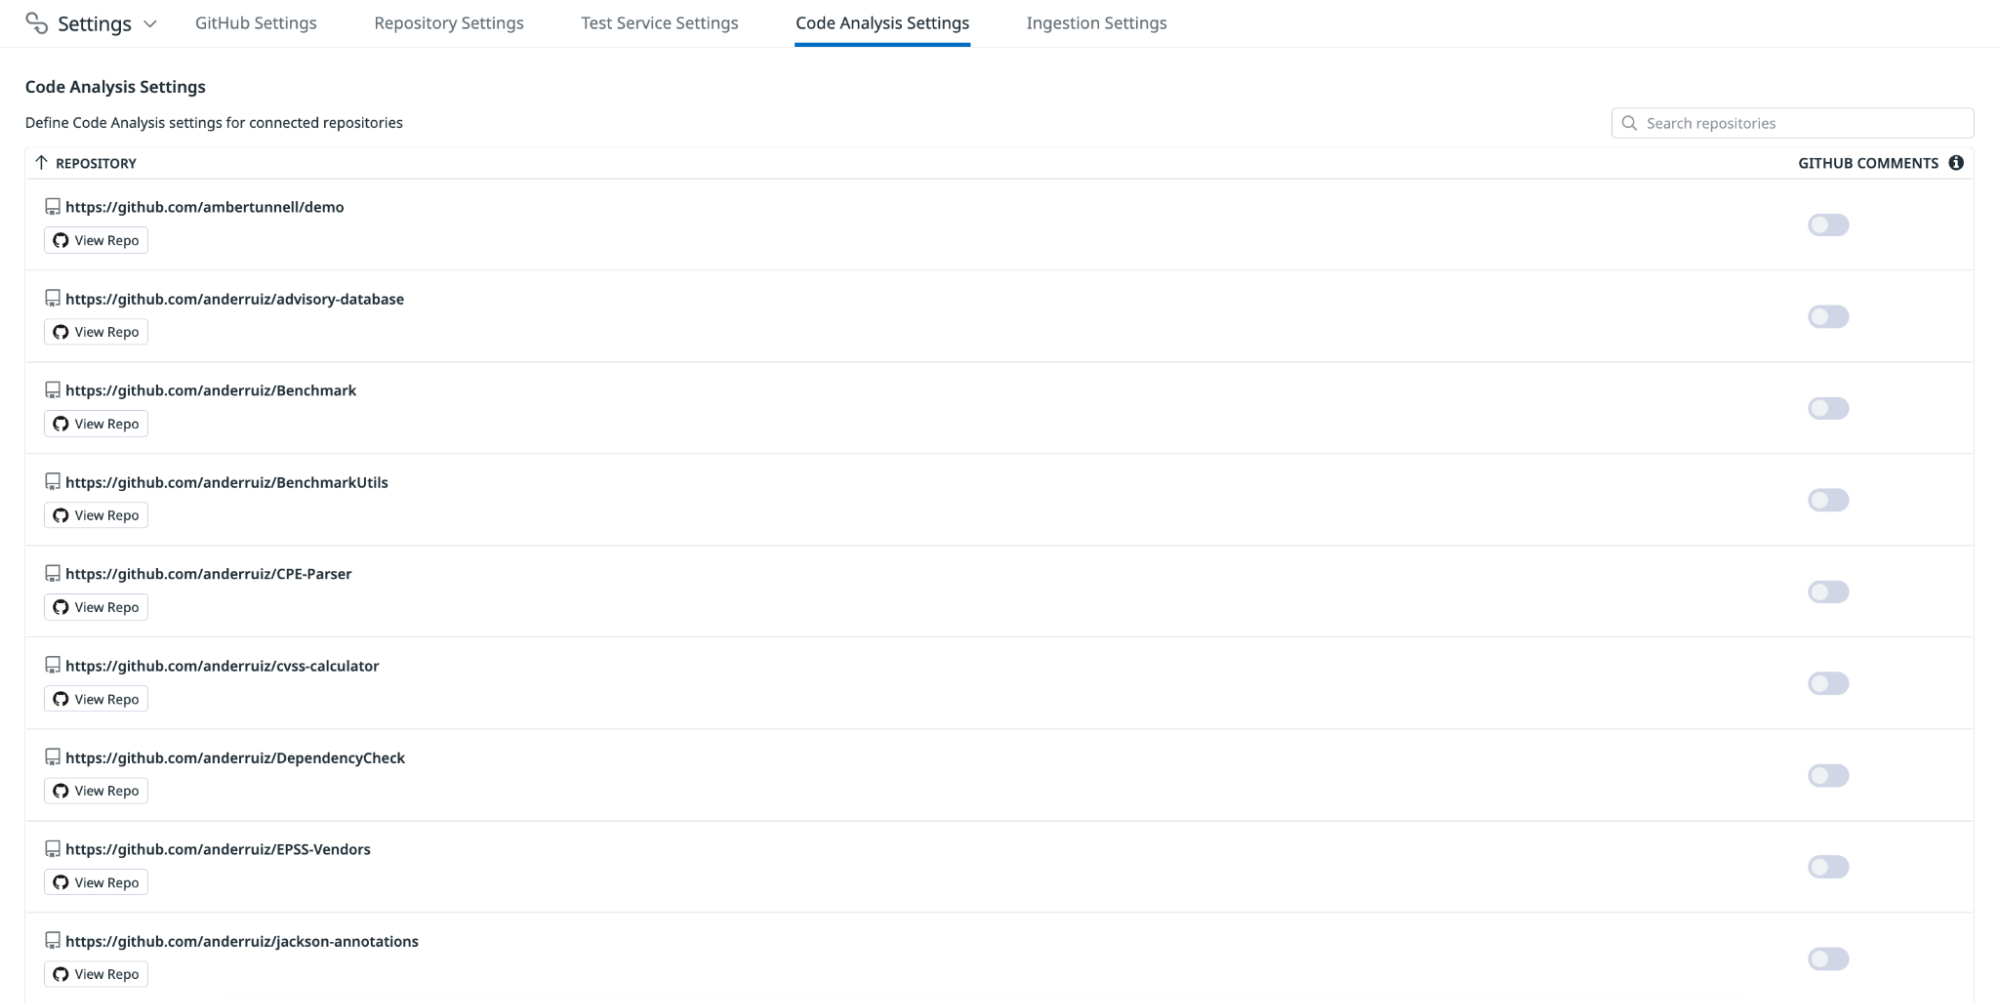
To disable this feature, navigate to the Code Analysis Settings page and click the toggle in the GitHub Comments column.
Other providers
For other providers, you can run the Datadog CLI directly in your CI pipeline platform. For more information, see Generic CI Providers for Static Analysis and Generic CI Providers for Software Composition Analysis.
You must run an analysis of your repository on the default branch for results to start appearing on the Repositories page.
Run Code Analysis in your CI provider
To upload results to Datadog, ensure you have a Datadog API key and application key.
Specify a name for the service or library in the dd_service field such as shopist.
GitHub Action
You can configure a GitHub Action to run Static Analysis and Software Composition Analysis scans as part of your CI workflows.
Create a .github/workflows/datadog-static-analysis.yml file in your repository with the following content:
on: [push]

name: Datadog Static Analysis

jobs:
  static-analysis:
    runs-on: ubuntu-latest
    name: Datadog Static Analyzer
    steps:
    - name: Checkout
      uses: actions/checkout@v3
    - name: Check code meets quality and security standards
      id: datadog-static-analysis
      uses: DataDog/datadog-static-analyzer-github-action@v1
      with:
        dd_api_key: ${{ secrets.DD_API_KEY }}
        dd_app_key: ${{ secrets.DD_APP_KEY }}
        dd_service: shopist
        dd_env: ci
        dd_site: datadoghq.com
        cpu_count: 2
Then, create a .github/workflows/datadog-sca.yml file in your repository with the following content:
on: [push]

name: Datadog Software Composition Analysis

jobs:
  software-composition-analysis:
    runs-on: ubuntu-latest
    name: Datadog SBOM Generation and Upload
    steps:
    - name: Checkout
      uses: actions/checkout@v3
    - name: Check imported libraries are secure and compliant
      id: datadog-software-composition-analysis
      uses: DataDog/datadog-sca-github-action@main
      with:
        dd_api_key: ${{ secrets.DD_API_KEY }}
        dd_app_key: ${{ secrets.DD_APP_KEY }}
        dd_service: shopist
        dd_env: ci
        dd_site: datadoghq.com
Customizable script
You can upload a SARIF report with Static Analysis results or an SBOM report with Software Composition Analysis results to Datadog using the datadog-ci NPM package.
Static Analysis
To upload Static Analysis reports to Datadog, you must install Unzip and Node.js version 14 or later.
Add the following content to your CI pipeline configuration:
# Set the Datadog site to send information to
export DD_SITE="datadoghq.com"

# Install dependencies
npm install -g @datadog/datadog-ci

# Download the latest Datadog static analyzer:
# https://github.com/DataDog/datadog-static-analyzer/releases
DATADOG_STATIC_ANALYZER_URL=https://github.com/DataDog/datadog-static-analyzer/releases/latest/download/datadog-static-analyzer-x86_64-unknown-linux-gnu.zip

curl -L $DATADOG_STATIC_ANALYZER_URL > /tmp/ddog-static-analyzer.zip
unzip /tmp/ddog-static-analyzer.zip -d /tmp
mv /tmp/datadog-static-analyzer /usr/local/datadog-static-analyzer

# Run Static Analysis
/usr/local/datadog-static-analyzer -i . -o /tmp/report.sarif -f sarif

# Upload results
datadog-ci sarif upload /tmp/report.sarif --service "shopist" --env "ci"
Software Composition Analysis
To upload Software Composition Analysis results to Datadog, you must install Trivy and Node.js version 14 or later.
Add the following content to your CI pipeline configuration:
# Set the Datadog site to send information to
export DD_SITE="datadoghq.com"

# Install dependencies
npm install -g @datadog/datadog-ci

# Download the latest Datadog OSV Scanner:
# https://github.com/DataDog/osv-scanner/releases
DATADOG_OSV_SCANNER_URL=https://github.com/DataDog/osv-scanner/releases/latest/download/osv-scanner_linux_amd64.zip

# Install OSV Scanner
mkdir /osv-scanner
curl -L -o /osv-scanner/osv-scanner.zip $DATADOG_OSV_SCANNER_URL
cd /osv-scanner && unzip osv-scanner.zip
chmod 755 /osv-scanner/osv-scanner

# Output OSC Scanner results
/osv-scanner/osv-scanner --skip-git -r --experimental-only-packages --format=cyclonedx-1-5 --paths-relative-to-scan-dir  --output=/tmp/sbom.json /path/to/repository

# Upload results
datadog-ci sbom upload --service "shopist" --env "ci" /tmp/sbom.json
Once you’ve configured these scripts, run an analysis of your repository on the default branch. Then, results will start appearing on the Repositories page.
Run Static Analysis in an IDE
Install the Datadog IDE plugins to run Static Analysis scans locally and see results directly in your code editor. You can detect and fix problems such as maintainability issues, bugs, or security vulnerabilities in your code before you commit your changes.
To start running Static Analysis scans in your IDE, see the respective documentation for your code editor of choice.
Enable Code Analysis comments in GitHub pull requests
You can integrate Code Analysis with GitHub pull requests to automatically flag code violations and enhance code quality in the review process.
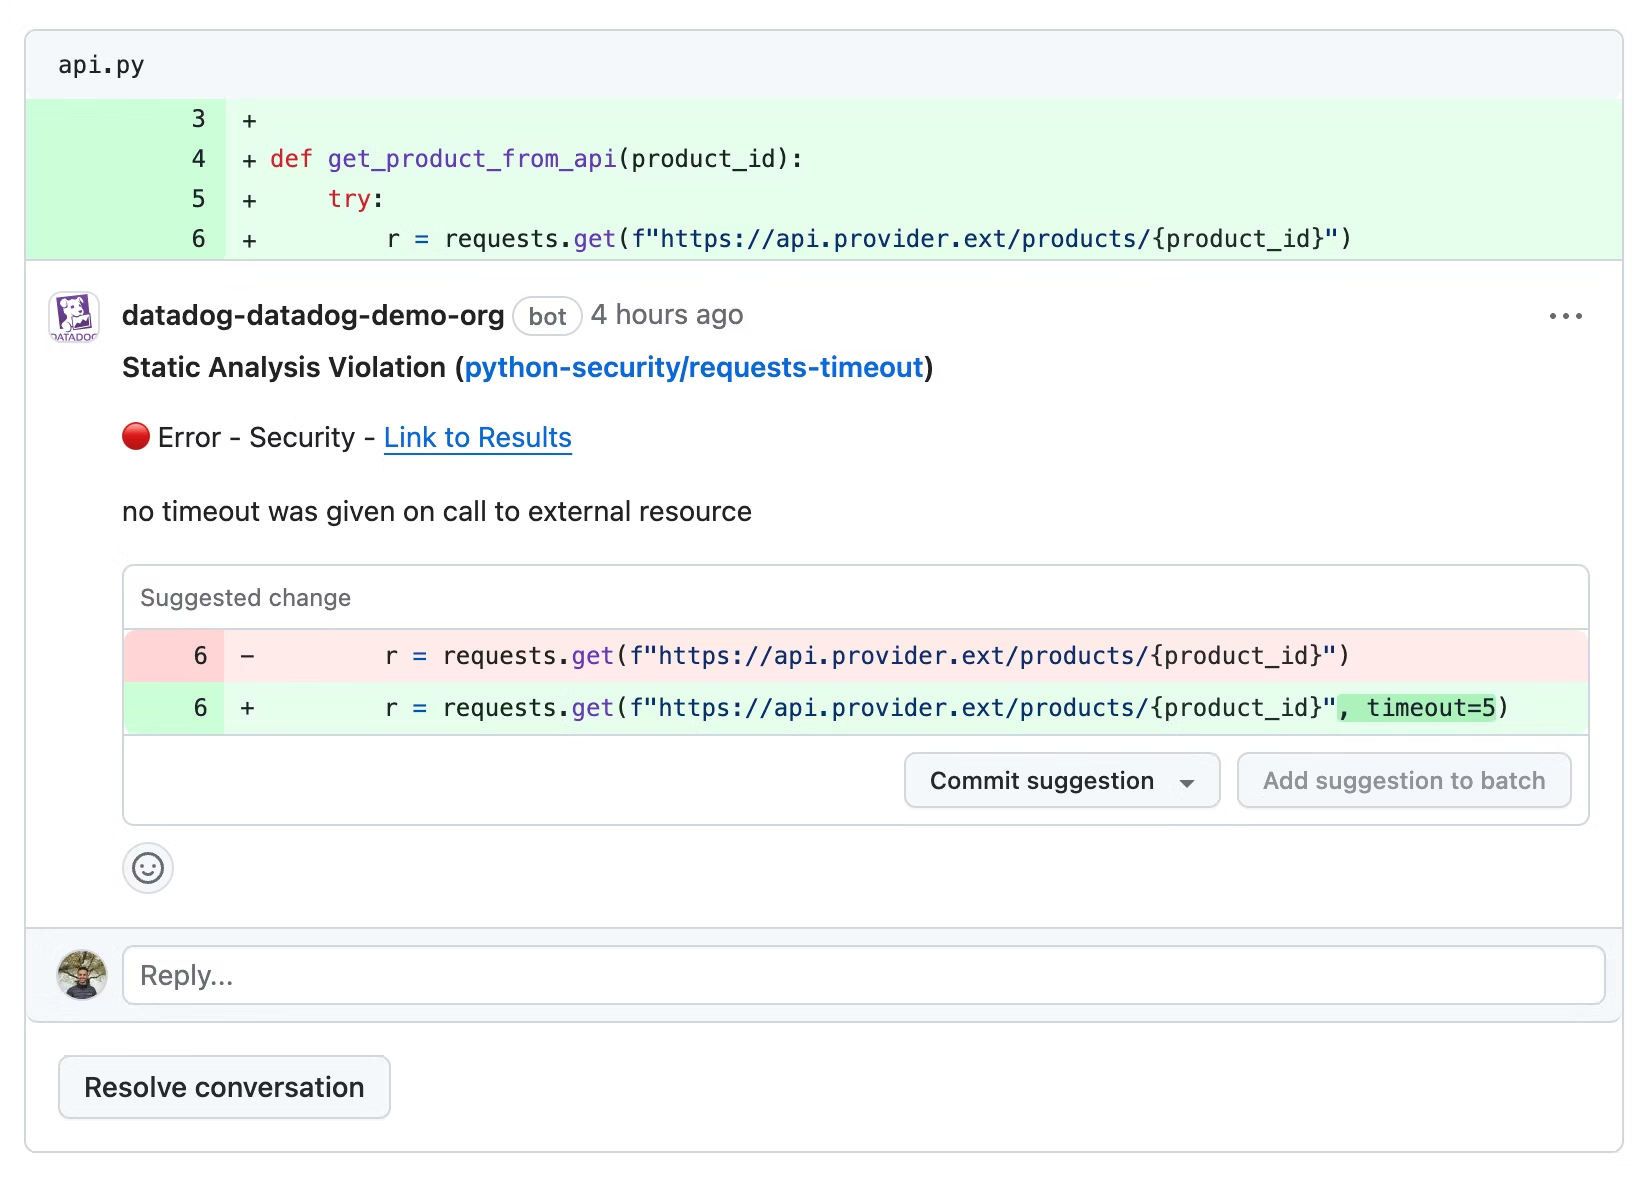
When configured, Code Analysis directly comments on the PR, indicating violations with details such as the name, ID, severity, and suggested fixes, which you can directly apply from the GitHub UI.
After adding the appropriate configuration files to your repository, create a GitHub App in Datadog (a new app or an update to an existing one). Ensure it has the proper read and write access to pull requests.
Once you’ve configured your app, navigate to the Code Analysis Settings page and click the toggle in the GitHub Comments column for each repository.
For more information, see GitHub Pull Requests.
Search and manage repositories
Click on a repository on the Repositories page to access a more detailed view where you can customize the search query by branch (with the default branch appearing first) and by commit (starting with the latest).
You can use the following out-of-the-box facets to create a search query for identifying and resolving poor coding practices in the Code Quality tab or security risks in the Code Vulnerabilities tab.
| Facet Name | Description |
|---|---|
| Result Status | Filters results based on the completion status of the analysis. |
| Rule ID | Specific rules that triggered the findings. |
| Tool Name | Determines which tools contributed to the analysis. |
| CWE (Common Weakness Enumeration) | Filters findings by recognized vulnerability categories. |
| Has Fixes | Filters issues for which suggested fixes are available. |
| Result Message | Contains concise descriptions or messages associated with the findings. |
| Rule Description | Contains the rationale behind each rule. |
| Source File | Contains the files where issues were detected. |
| Tool Version | Filters results by the version of the tools used. |
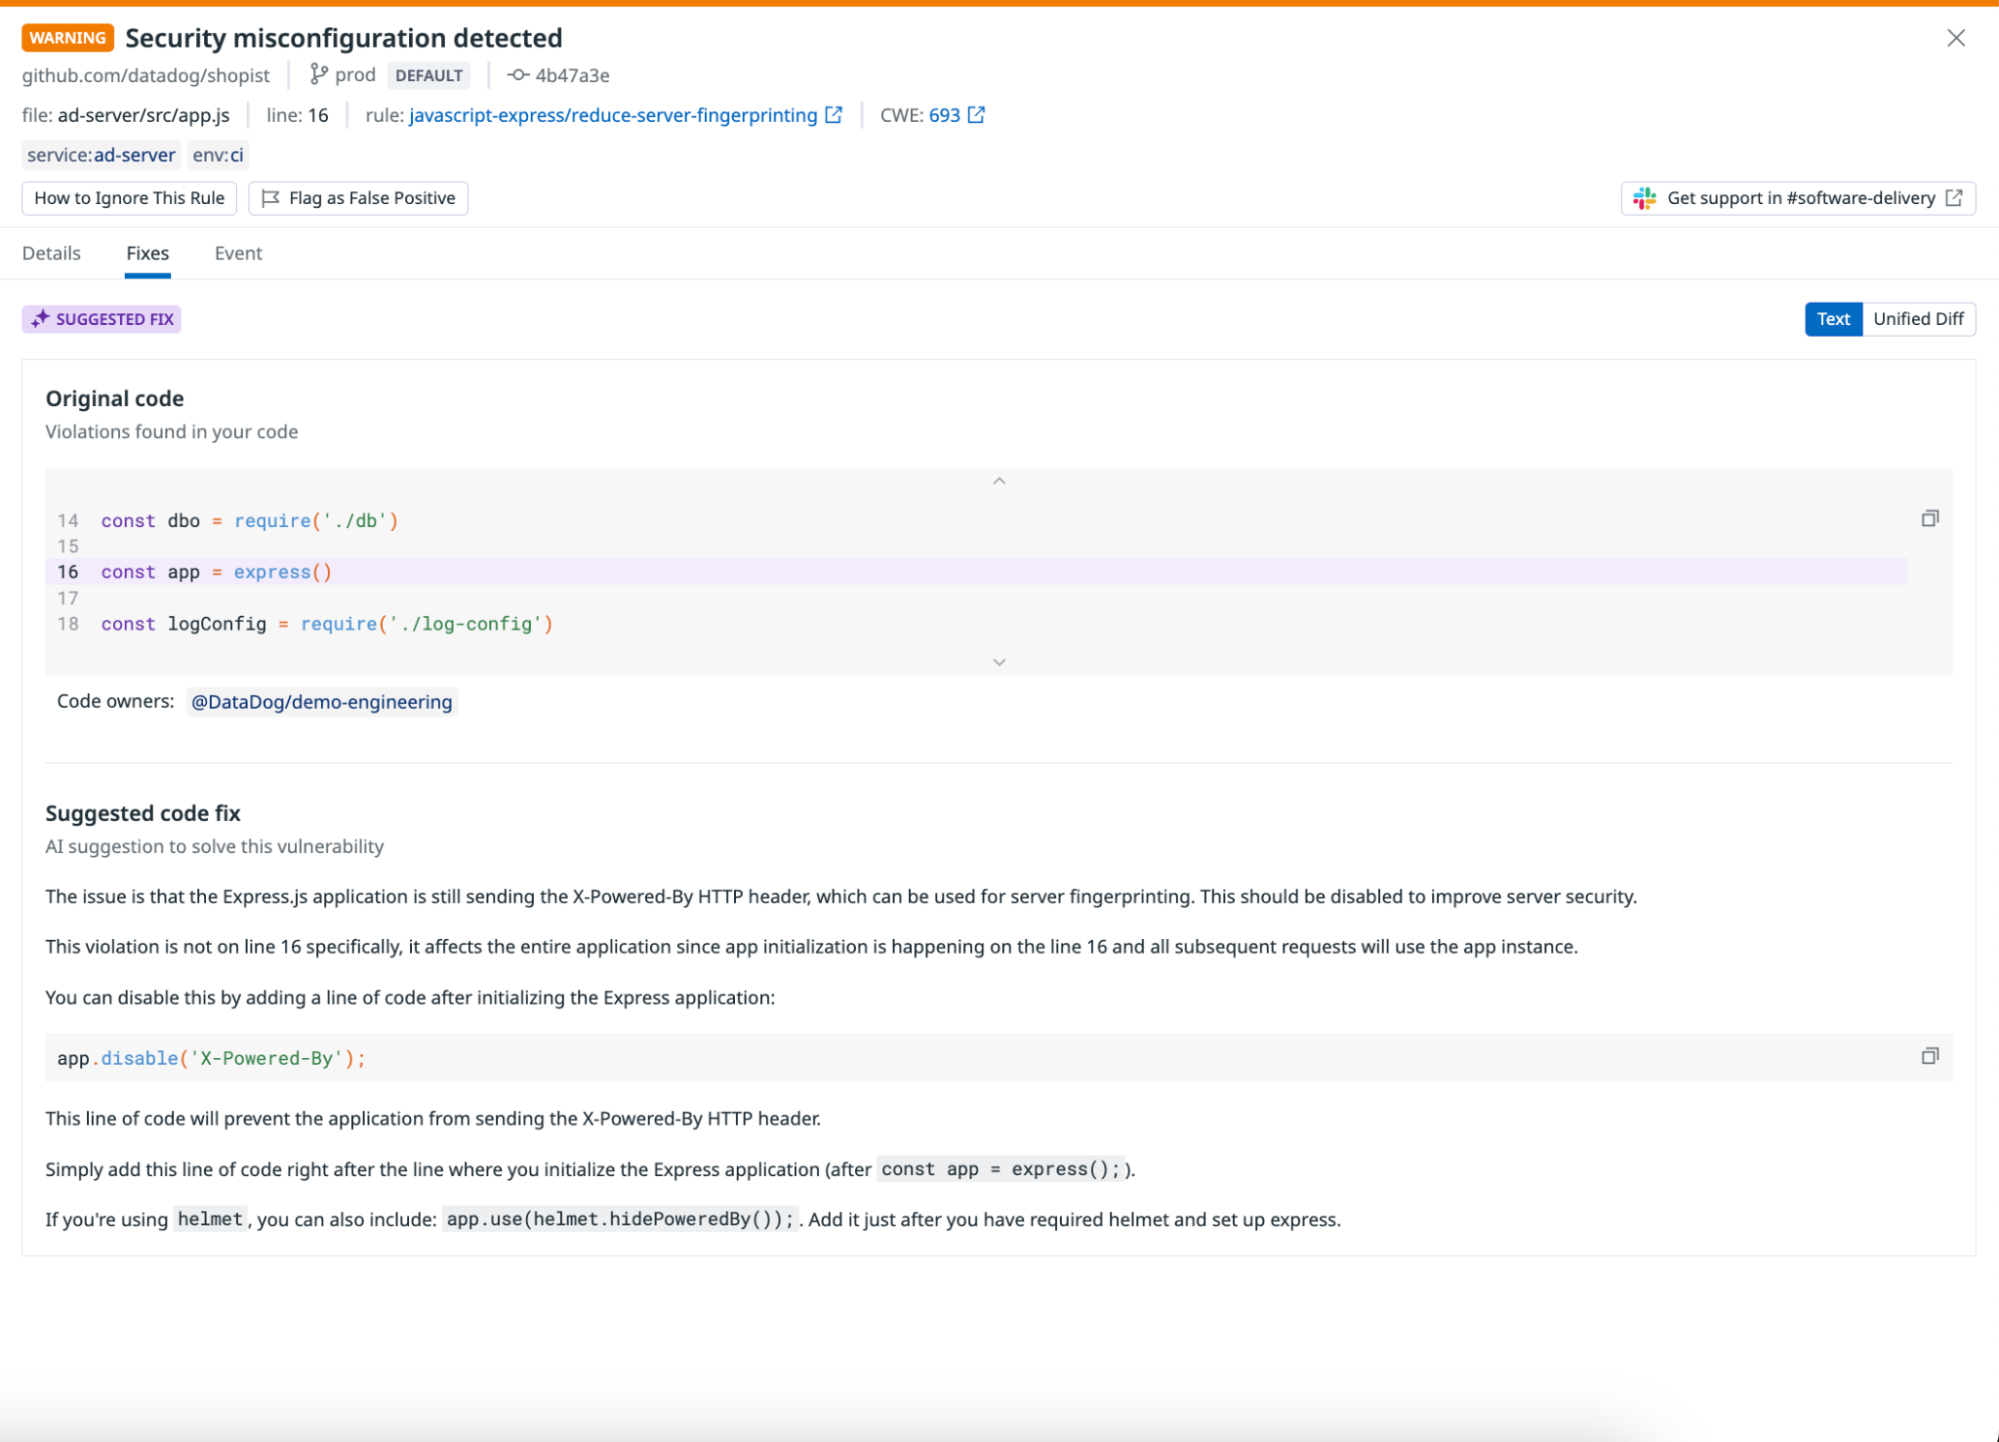
You can access suggested fixes directly from the results to improve code quality practices and address security vulnerabilities.
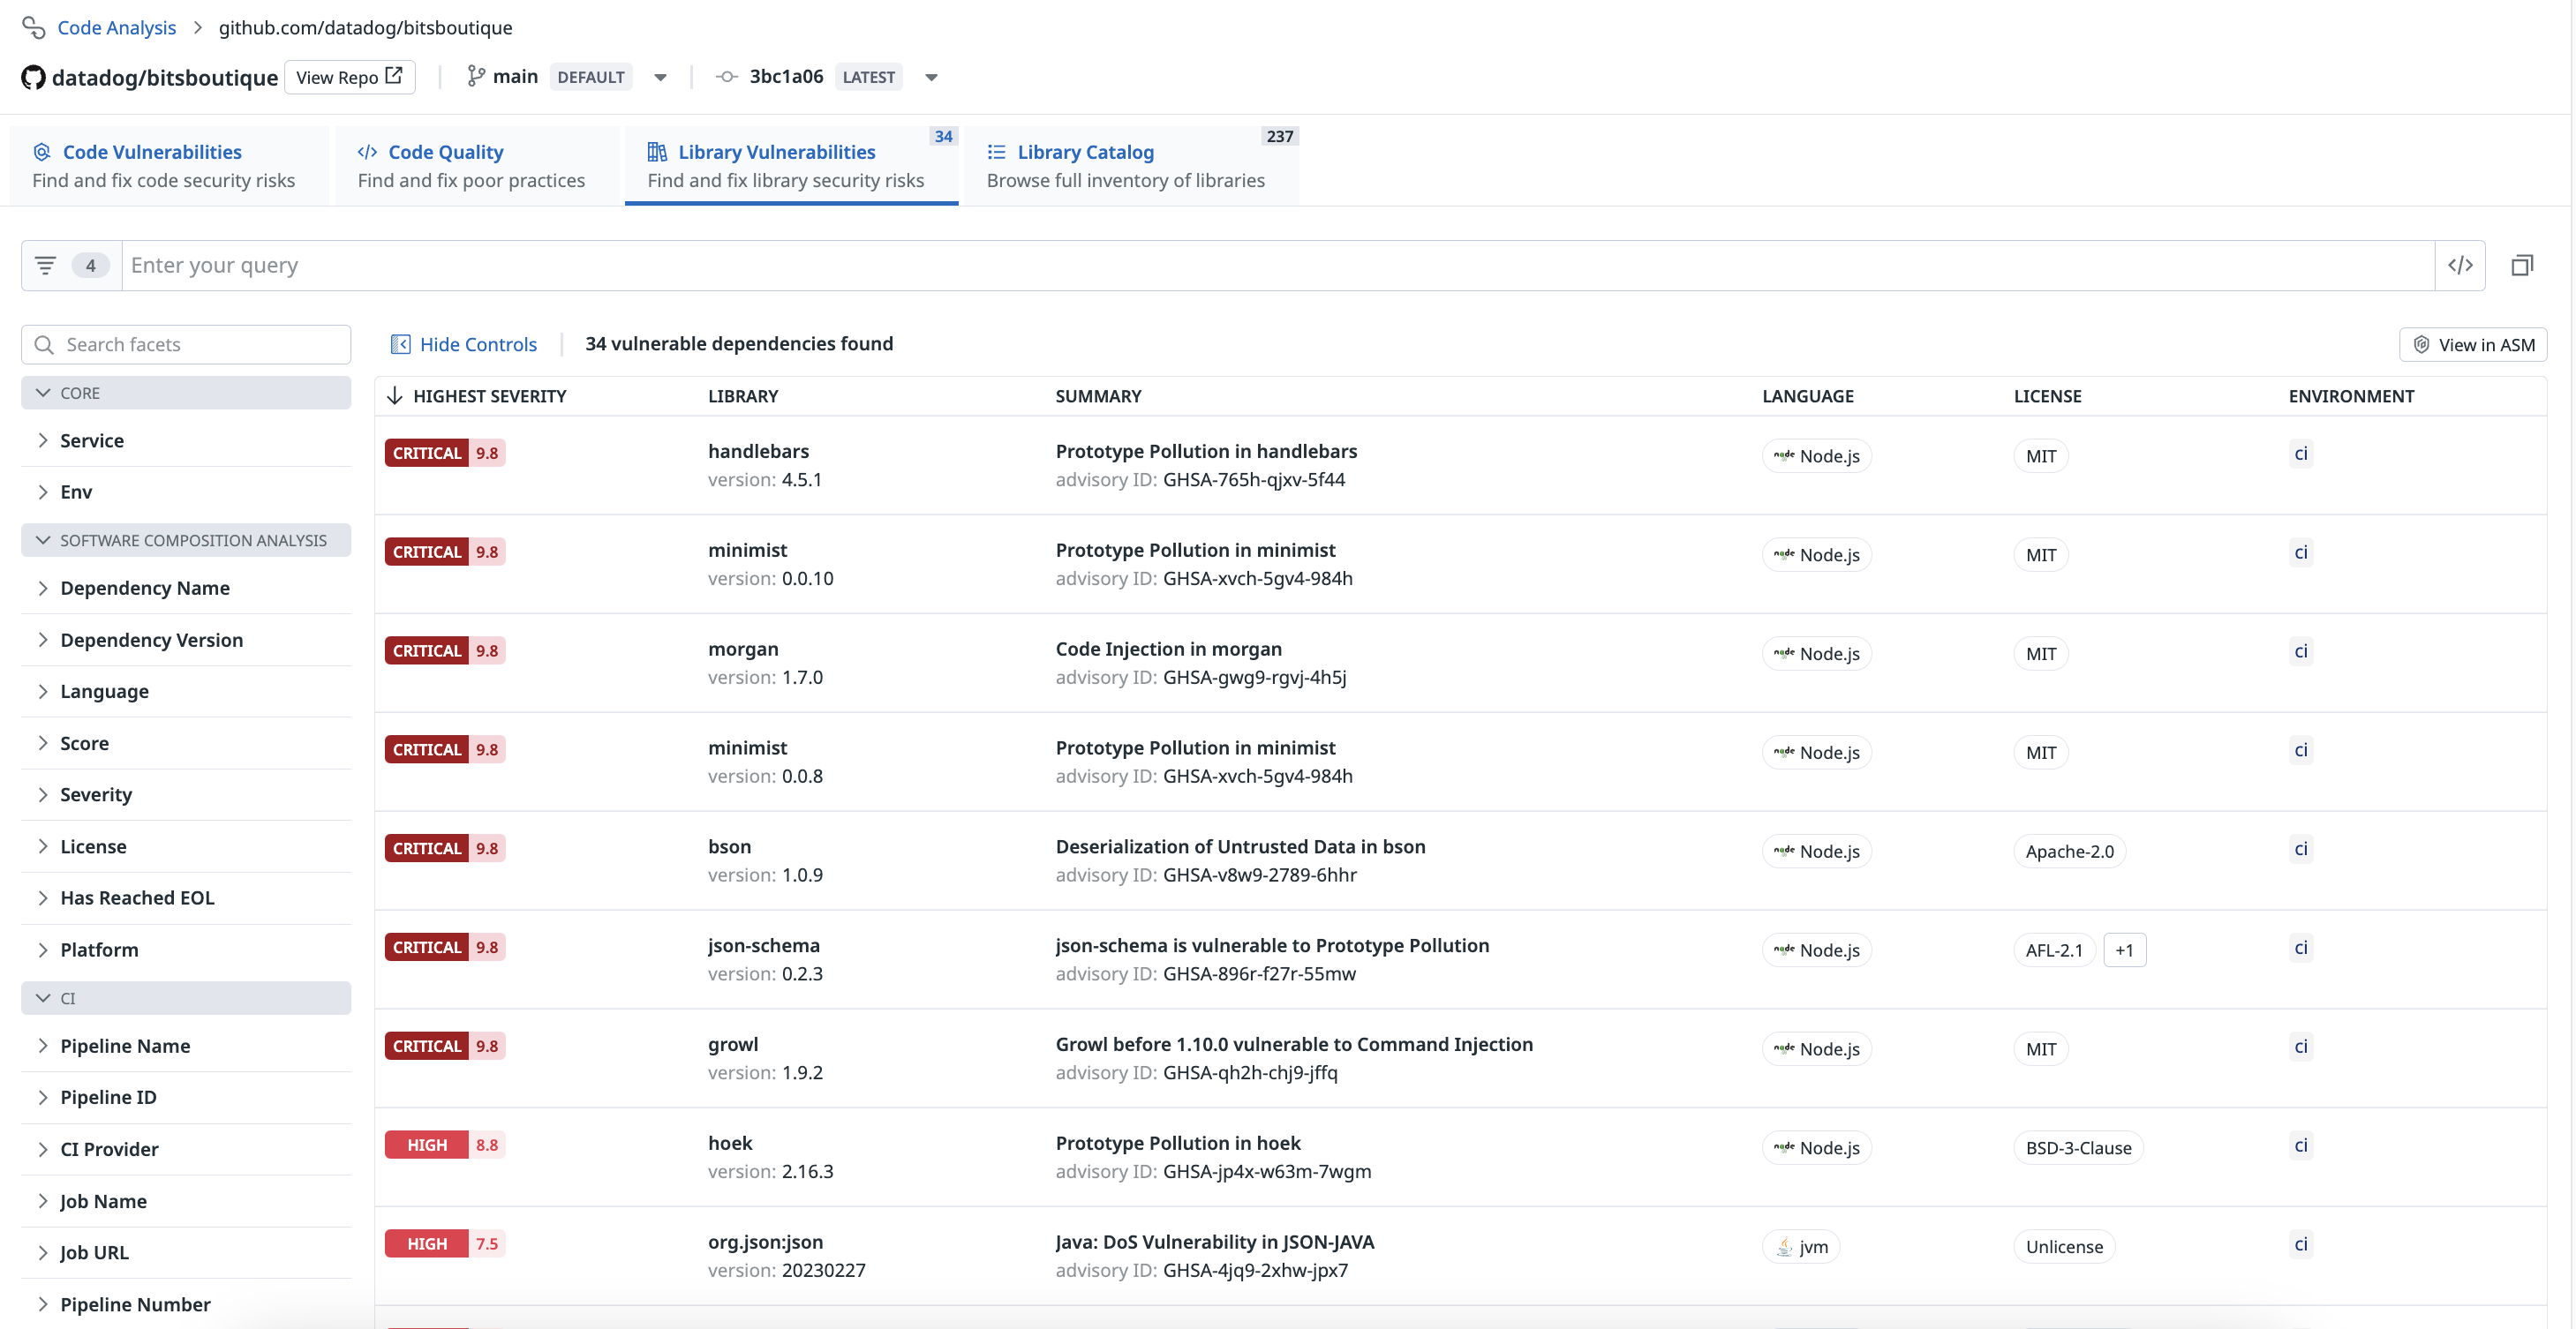
You can use the following out-of-the-box facets to create a search query for identifying and addressing security risks in third-party libraries in the Library Vulnerabilities tab or reviewing your library inventory in the Library Catalog tab.
| Facet Name | Description |
|---|---|
| Dependency Name | Identifies the libraries by name. |
| Dependency Version | Filters by specific versions of libraries. |
| Language | Sorts libraries by the programming language. |
| Score | Sorts the risk or quality score of the dependencies. |
| Severity | Filters vulnerabilities based on their severity rating. |
| Platform | Distinguishes libraries by the platform they are intended for. |
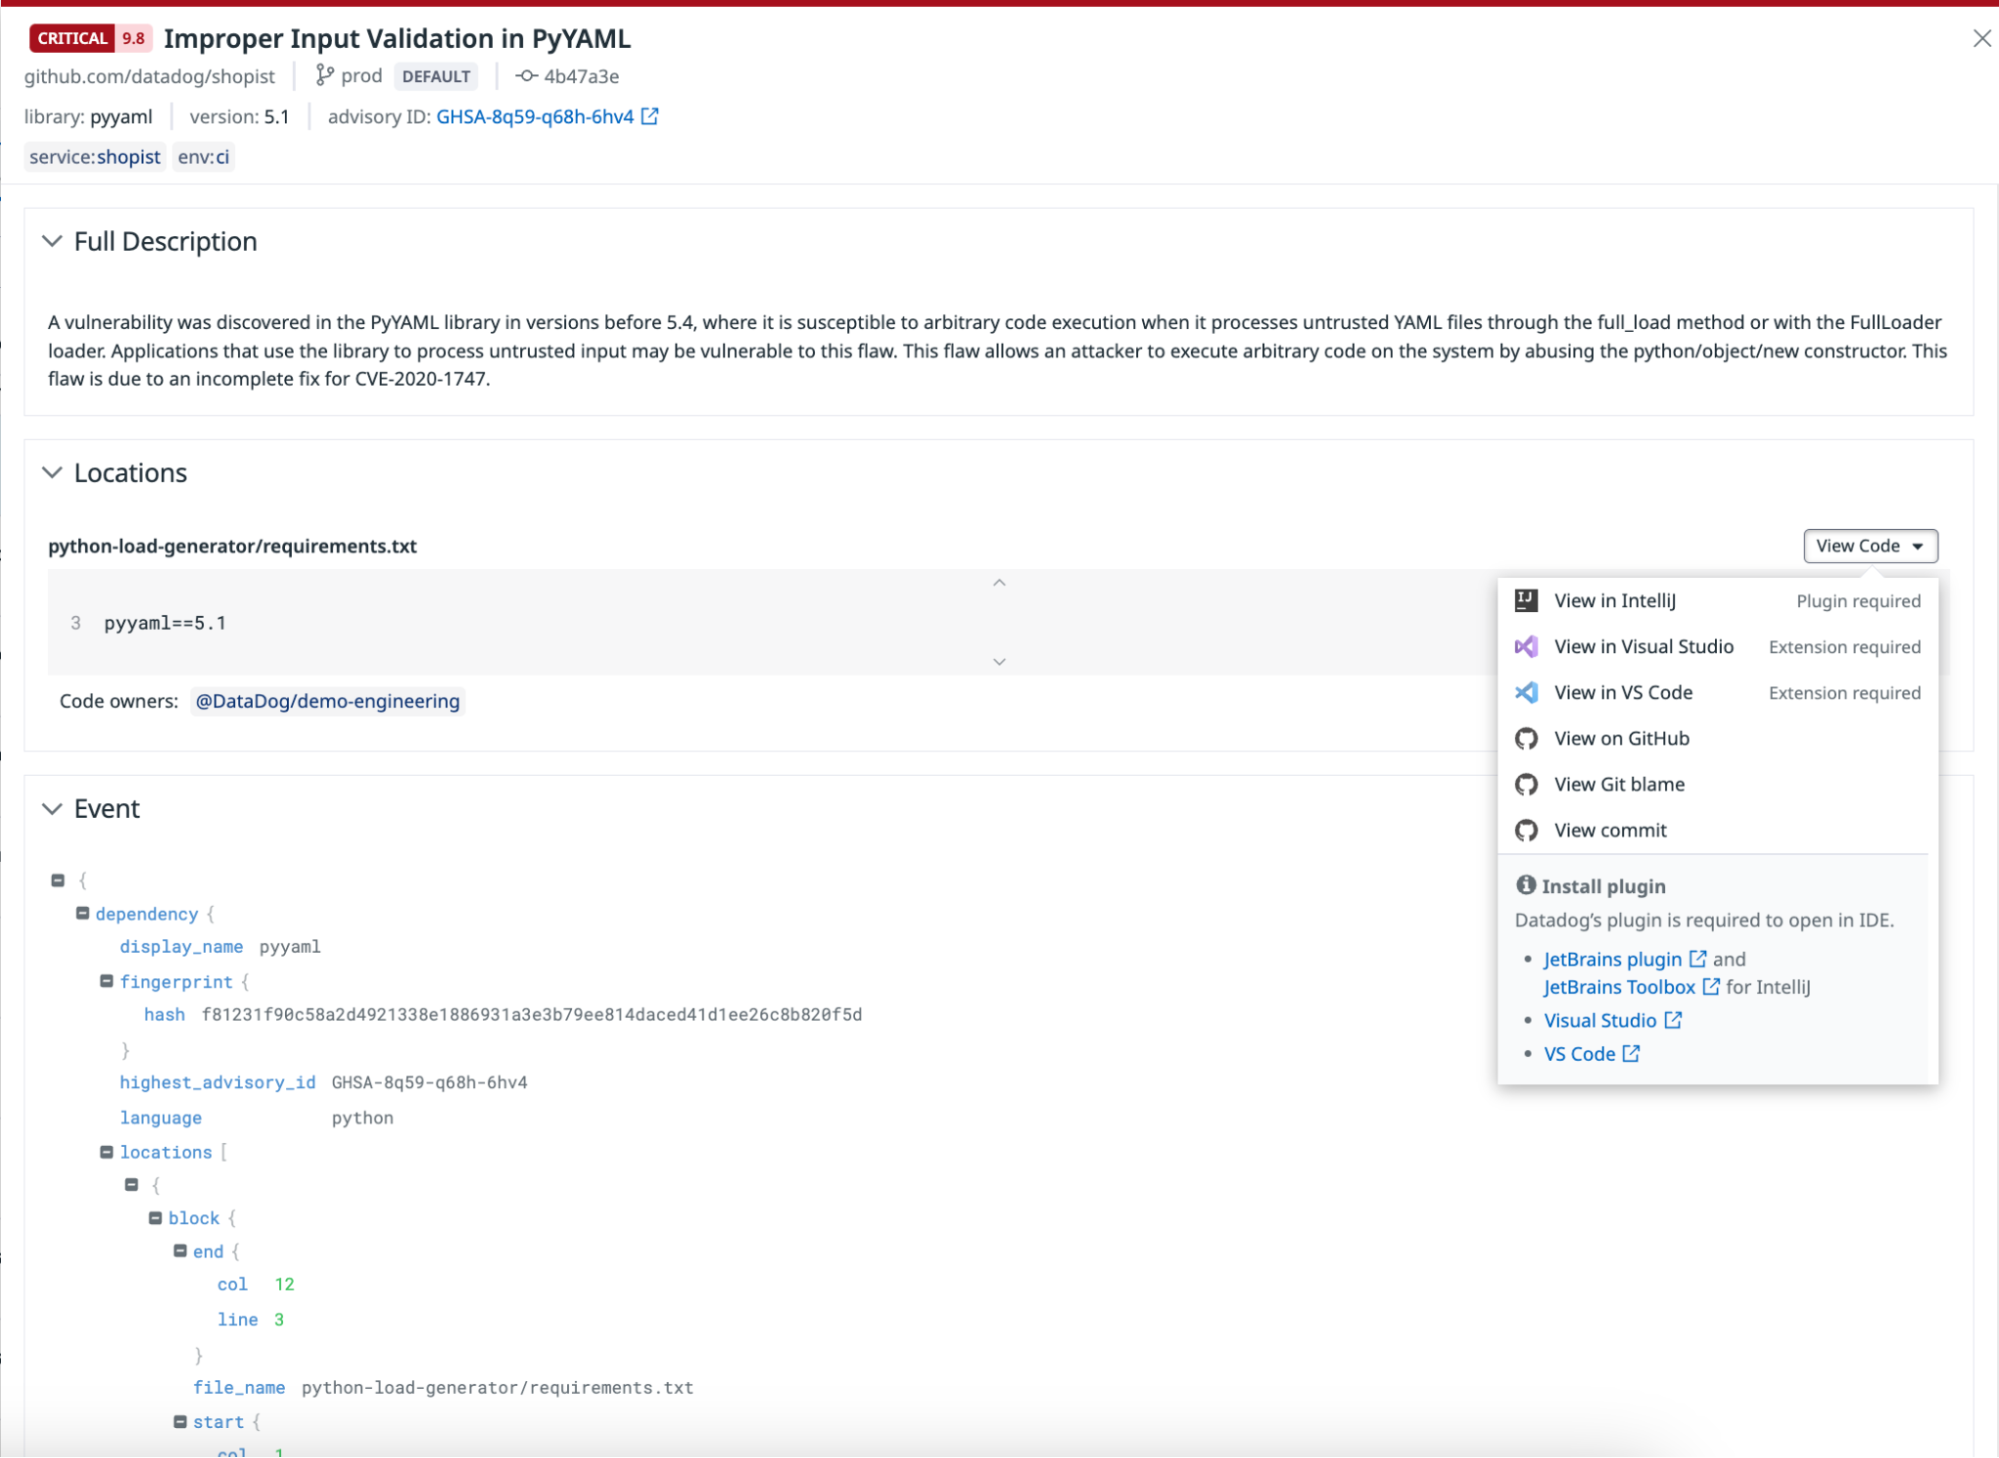
You can access vulnerability reports and locate the source files where the vulnerability was discovered in your projects, along with information about the file’s code owners.
Explore results in the Service Catalog
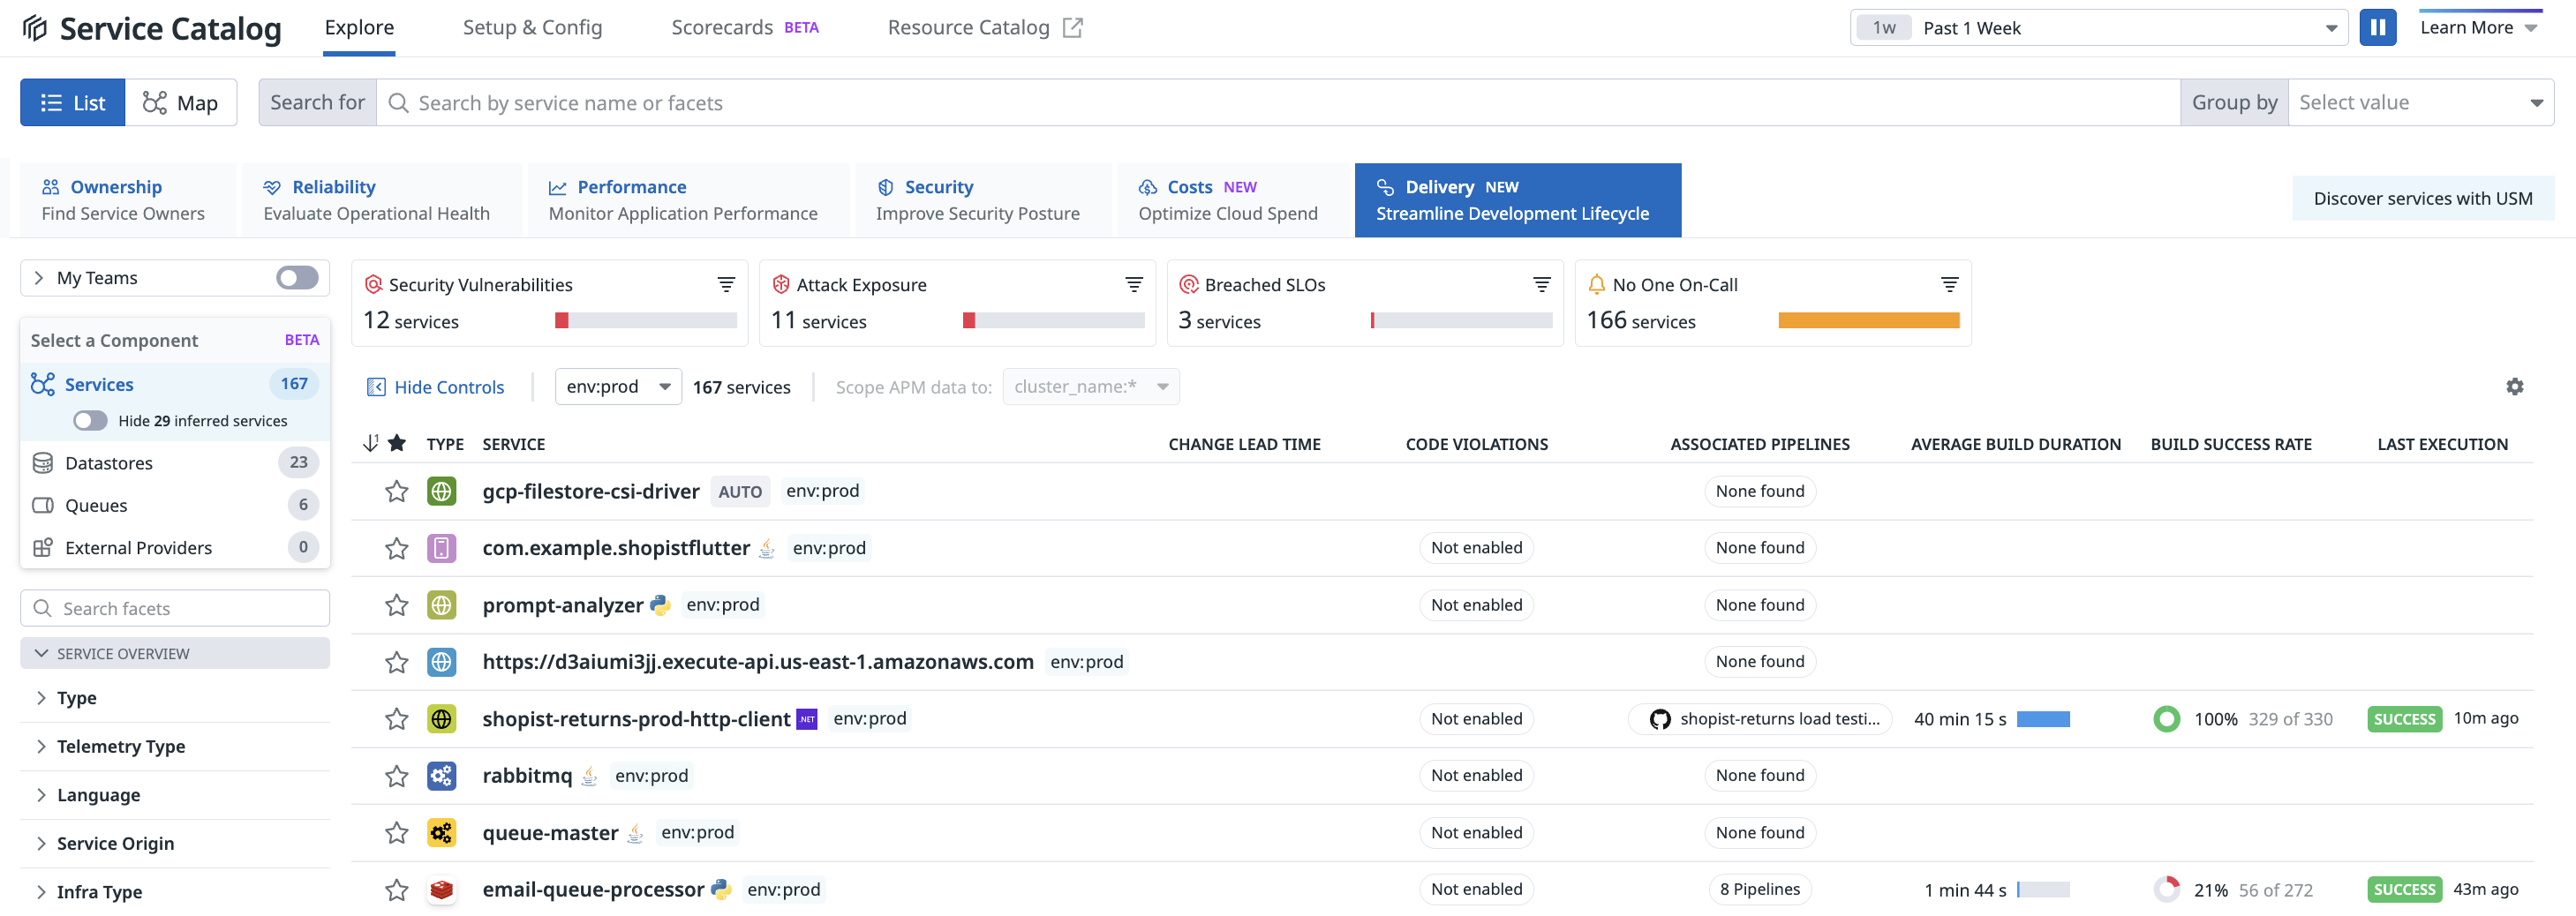
Investigate code violations associated with your services and code violations identified from Static Analysis to troubleshoot slowdowns and failures. Navigate to Service Management > Services > Service Catalog and click on the Delivery view to analyze the pre-production status of your services.
Click on a service to access information about CI pipelines from Pipeline Visibility, in addition to security vulnerabilities and code quality issues from Code Analysis on the Delivery tab of the side panel.
Linking services to code violations and libraries
Datadog associates code violations or libraries with relevant services by using the following mechanisms:
- Identifying the code location associated with a service using the Service Catalog.
- Detecting usage patterns of files within additional Datadog products.
- Searching for the service name in the file path or repository.
If one method succeeds, no further mapping attempts are made. Each mapping method is detailed below.
Identifying the code location in the Service Catalog
The schema version v3 and later of the Service Catalog allows you to add the mapping of your code location for your service. The codeLocations section specifies the location of the repository containing the code and its associated paths.
The paths attribute is a list of globs
that should match paths in the repository.
entity.datadog.yaml
apiVersion: v3
kind: service
metadata:
  name: my-service
datadog:
  codeLocations:
    - repositoryURL: https://github.com/myorganization/myrepo.git
      paths:
        - path/to/service/code/**
Detecting file usage patterns
Datadog detects file usage in additional products such as Error Tracking and associate
files with the runtime service. For example, if a service called foo has
a log entry or a stack trace containing a file with a path /modules/foo/bar.py,
it associates files /modules/foo/bar.py to service foo.
Detecting service name in paths and repository names
Datadog detects service names in paths and repository names, and associates the file with the service if a match is found.
For a repository match, if there is a service called myservice and
the repository URL is https://github.com/myorganization/myservice.git, then,
it associates myservice to all files in the repository.
If no repository match is found, Datadog attempts to find a match in the
path of the file. If there is a service named myservice, and the path is /path/to/myservice/foo.py, the file is associated with myservice because the service name is part of the path. If two services are present
in the path, the service name the closest to the filename is selected.
Linking teams to code violations and libraries
Datadog automatically associates the team attached to a service when a code violation or library issue is detected. For example, if the file domains/ecommerce/apps/myservice/foo.py
is associated with myservice, then the team myservice will be associated to any violation
detected in this file.
If no services or teams are found, Datadog uses the CODEOWNERS file
in your repository. The CODEOWNERS file determines which team owns a file in your Git provider.
Note: You must accurately map your Git provider teams to your Datadog teams for this feature to function properly.
Further Reading
Más enlaces, artículos y documentación útiles:
