- Esenciales
- Empezando
- Datadog
- Sitio web de Datadog
- DevSecOps
- Serverless para Lambda AWS
- Agent
- Integraciones
- Contenedores
- Dashboards
- Monitores
- Logs
- Rastreo de APM
- Generador de perfiles
- Etiquetas (tags)
- API
- Catálogo de servicios
- Session Replay
- Continuous Testing
- Monitorización Synthetic
- Gestión de incidencias
- Monitorización de bases de datos
- Cloud Security Management
- Cloud SIEM
- Application Security Management
- Workflow Automation
- CI Visibility
- Test Visibility
- Intelligent Test Runner
- Análisis de código
- Centro de aprendizaje
- Compatibilidad
- Glosario
- Atributos estándar
- Guías
- Agent
- Uso básico del Agent
- Arquitectura
- IoT
- Plataformas compatibles
- Recopilación de logs
- Configuración
- Configuración remota
- Automatización de flotas
- Actualizar el Agent
- Solucionar problemas
- Detección de nombres de host en contenedores
- Modo de depuración
- Flare del Agent
- Estado del check del Agent
- Problemas de NTP
- Problemas de permisos
- Problemas de integraciones
- Problemas del sitio
- Problemas de Autodiscovery
- Problemas de contenedores de Windows
- Configuración del tiempo de ejecución del Agent
- Consumo elevado de memoria o CPU
- Guías
- Seguridad de datos
- Integraciones
- OpenTelemetry
- Desarrolladores
- Autorización
- DogStatsD
- Checks personalizados
- Integraciones
- Crear una integración basada en el Agent
- Crear una integración API
- Crear un pipeline de logs
- Referencia de activos de integración
- Crear una oferta de mercado
- Crear un cuadro
- Crear un dashboard de integración
- Crear un monitor recomendado
- Crear una regla de detección Cloud SIEM
- OAuth para integraciones
- Instalar la herramienta de desarrollo de integraciones del Agente
- Checks de servicio
- Complementos de IDE
- Comunidad
- Guías
- API
- Aplicación móvil de Datadog
- CoScreen
- Cloudcraft
- En la aplicación
- Dashboards
- Notebooks
- Editor DDSQL
- Hojas
- Monitores y alertas
- Infraestructura
- Métricas
- Watchdog
- Bits AI
- Catálogo de servicios
- Catálogo de APIs
- Error Tracking
- Gestión de servicios
- Objetivos de nivel de servicio (SLOs)
- Gestión de incidentes
- De guardia
- Gestión de eventos
- Gestión de casos
- Workflow Automation
- App Builder
- Infraestructura
- Universal Service Monitoring
- Contenedores
- Serverless
- Monitorización de red
- Coste de la nube
- Rendimiento de las aplicaciones
- APM
- Términos y conceptos de APM
- Instrumentación de aplicación
- Recopilación de métricas de APM
- Configuración de pipelines de trazas
- Correlacionar trazas (traces) y otros datos de telemetría
- Trace Explorer
- Observabilidad del servicio
- Instrumentación dinámica
- Error Tracking
- Seguridad de los datos
- Guías
- Solucionar problemas
- Continuous Profiler
- Database Monitoring
- Gastos generales de integración del Agent
- Arquitecturas de configuración
- Configuración de Postgres
- Configuración de MySQL
- Configuración de SQL Server
- Configuración de Oracle
- Configuración de MongoDB
- Conexión de DBM y trazas
- Datos recopilados
- Explorar hosts de bases de datos
- Explorar métricas de consultas
- Explorar ejemplos de consulta
- Solucionar problemas
- Guías
- Data Streams Monitoring
- Data Jobs Monitoring
- Experiencia digital
- Real User Monitoring
- Monitorización del navegador
- Configuración
- Configuración avanzada
- Datos recopilados
- Monitorización del rendimiento de páginas
- Monitorización de signos vitales de rendimiento
- Monitorización del rendimiento de recursos
- Recopilación de errores del navegador
- Rastrear las acciones de los usuarios
- Señales de frustración
- Error Tracking
- Solucionar problemas
- Monitorización de móviles y TV
- Plataforma
- Session Replay
- Exploración de datos de RUM
- Feature Flag Tracking
- Error Tracking
- Guías
- Seguridad de los datos
- Monitorización del navegador
- Análisis de productos
- Pruebas y monitorización de Synthetics
- Continuous Testing
- Entrega de software
- CI Visibility
- CD Visibility
- Test Visibility
- Configuración
- Tests en contenedores
- Búsqueda y gestión
- Explorador
- Monitores
- Flujos de trabajo de desarrolladores
- Cobertura de código
- Instrumentar tests de navegador con RUM
- Instrumentar tests de Swift con RUM
- Detección temprana de defectos
- Reintentos automáticos de tests
- Correlacionar logs y tests
- Guías
- Solucionar problemas
- Intelligent Test Runner
- Code Analysis
- Quality Gates
- Métricas de DORA
- Seguridad
- Información general de seguridad
- Cloud SIEM
- Cloud Security Management
- Application Security Management
- Observabilidad de la IA
- Log Management
- Observability Pipelines
- Gestión de logs
- Administración
- Gestión de cuentas
- Seguridad de los datos
- Sensitive Data Scanner
- Ayuda
Kubernetes Resource Utilization
This page is not yet available in Spanish. We are working on its translation.
If you have any questions or feedback about our current translation project, feel free to reach out to us!
If you have any questions or feedback about our current translation project, feel free to reach out to us!
Datadog’s Kubernetes resource utilization view gives you insights into how your Kubernetes workloads are using your computing resources across your infrastructure. This helps you to understand resource usage and make better decisions about sizing and capacity planning, as well as reducing the amount of CPU or memory waste.
With a constantly-updated status of how well your resource requests and limits match your pods’ current usage, you can improve bin packing within your Kubernetes clusters.
Prerequisites
- Datadog Agent v7.45.0+
- Enable Orchestrator Explorer
Usage
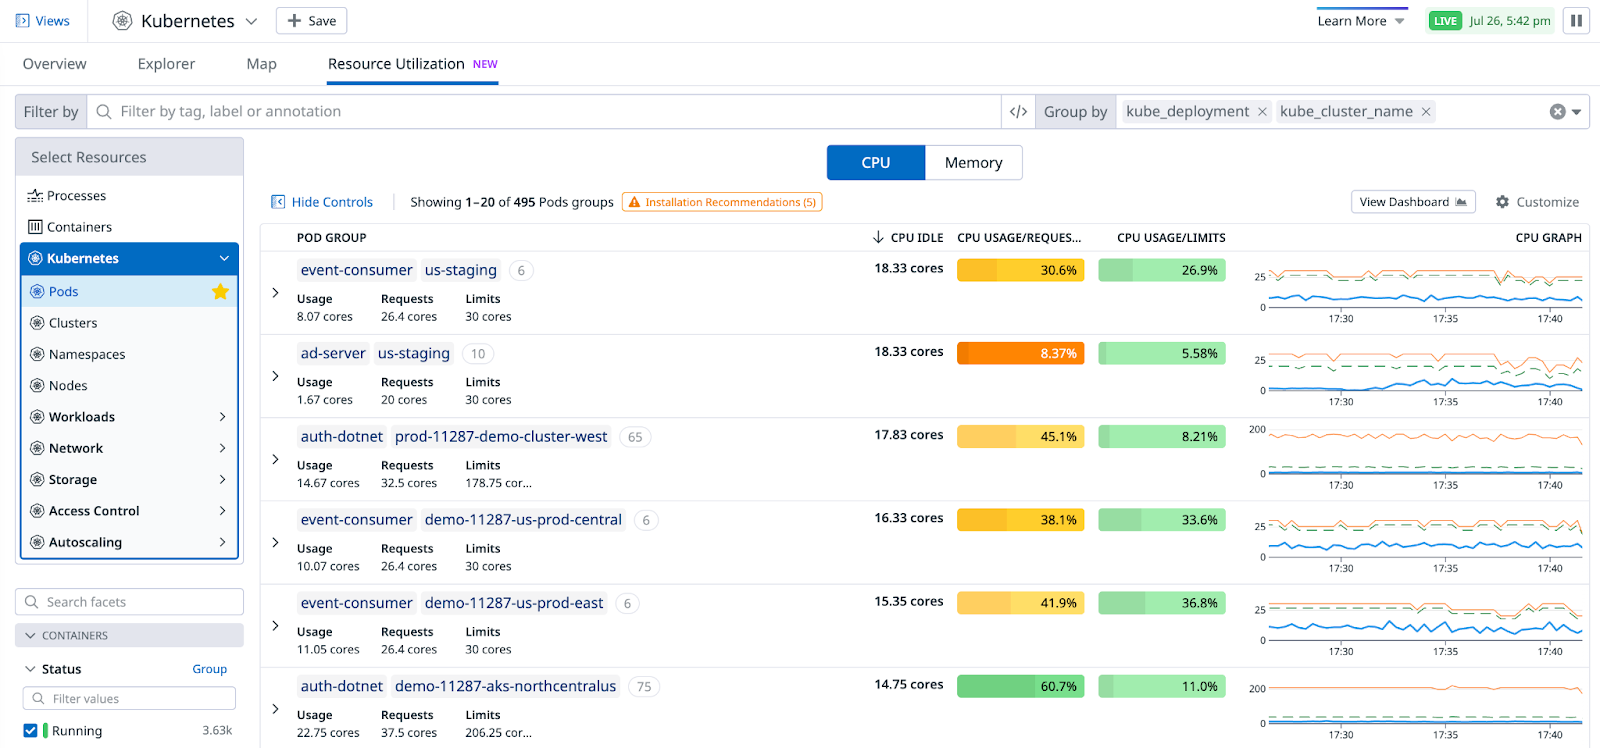
In Datadog, go to the Kubernetes Overview page and select the Resource Utilization tab.
The page opens on Pods, with a default grouping by kube_cluster_name, kube_namespace, and kube_deployment.
Optimizing the sizing for CPU and memory is typically done separately. Data in the table is split between a CPU and a Memory toggle.
Default columns
- Pod group: Represents deployments by default, but depends on what you specify in the Group by field in the upper right. This column includes the sum of usage, requests, and limits for the pods in each group.
- CPU idle: Amount of unused CPU, calculated as the sum of differences between usage and requests.
- CPU usage/requests: Sum of usage divided by sum of requests, as a percentage.
- CPU usage/limits: Sum of usage divided by sum of limits, as a percentage.
- CPU graph: A line graph displaying the evolution of usage, requests, and limits over time. Click on each row to see a longer timeframe.
- Pod group: Represents deployments by default, but depends on what you specify in the Group by field in the upper right. This column includes the sum of usage, requests, and limits for the pods in each group.
- Memory unused: Amount of unused memory, calculated as the sum of differences between usage and requests.
- Memory usage/requests: Sum of usage divided by sum of requests, as a percentage.
- Memory usage/limits: Sum of usage divided by sum of limits, as a percentage.
- Memory graph: A line graph displaying the evolution of usage, requests, and limits over time. Click on each row to see a longer timeframe.
Use the Customize button on the upper right to select other columns to view. Color coding reflects the degree of pod over/under provisioning.
Detailed view
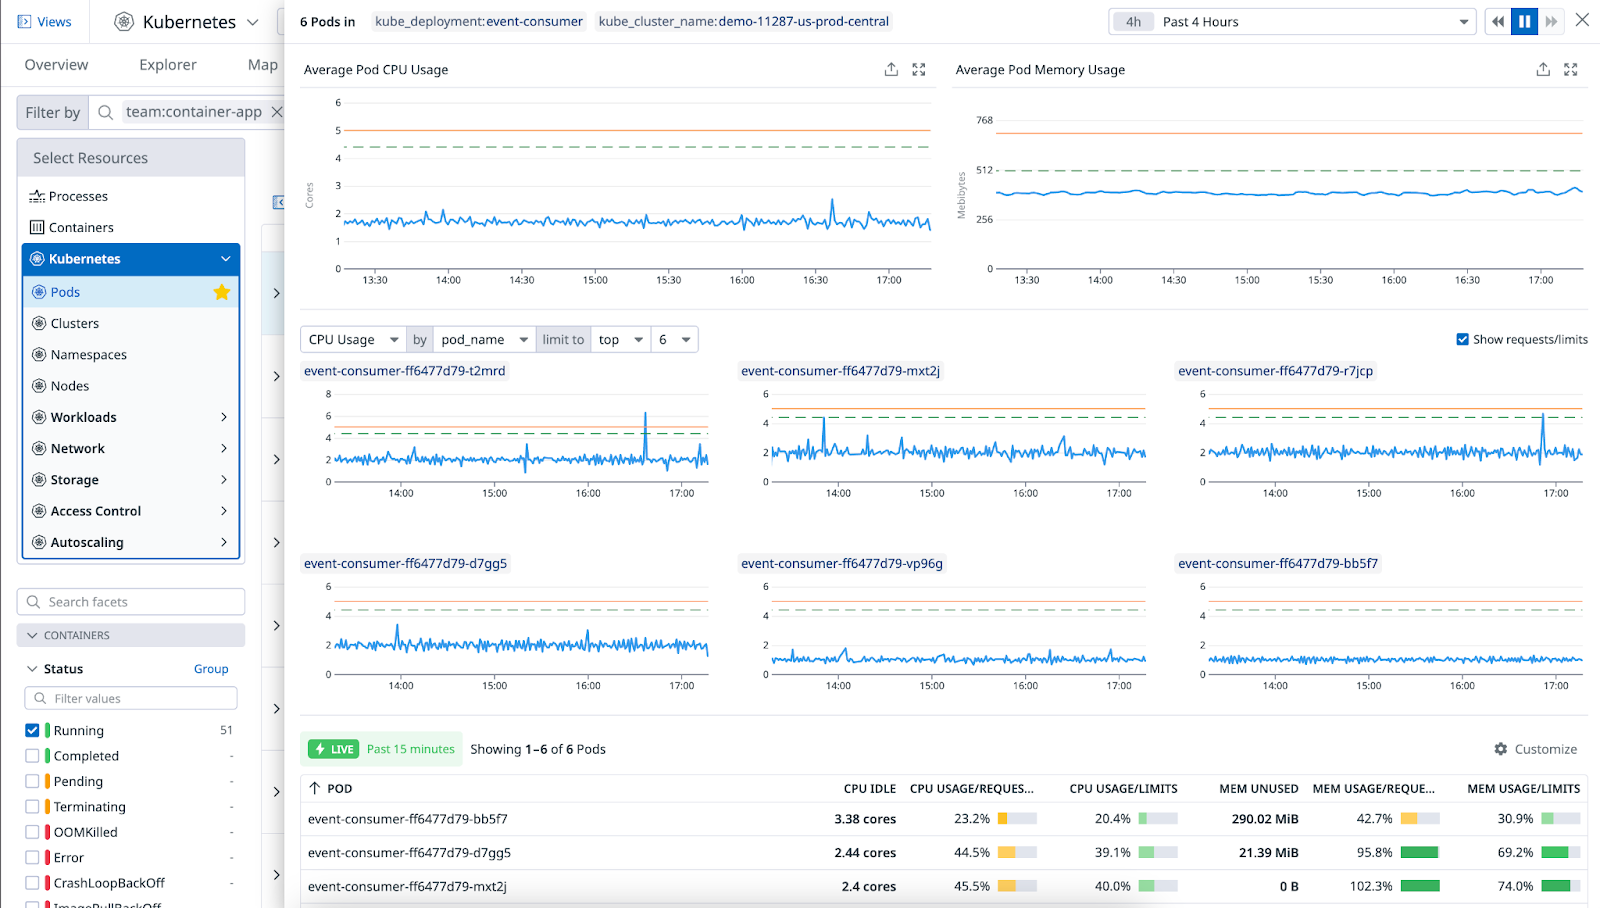
Clicking on a row opens a side panel with the combination of CPU and memory data for each group, with detailed graphs for each pod or container, and a top list of pods.
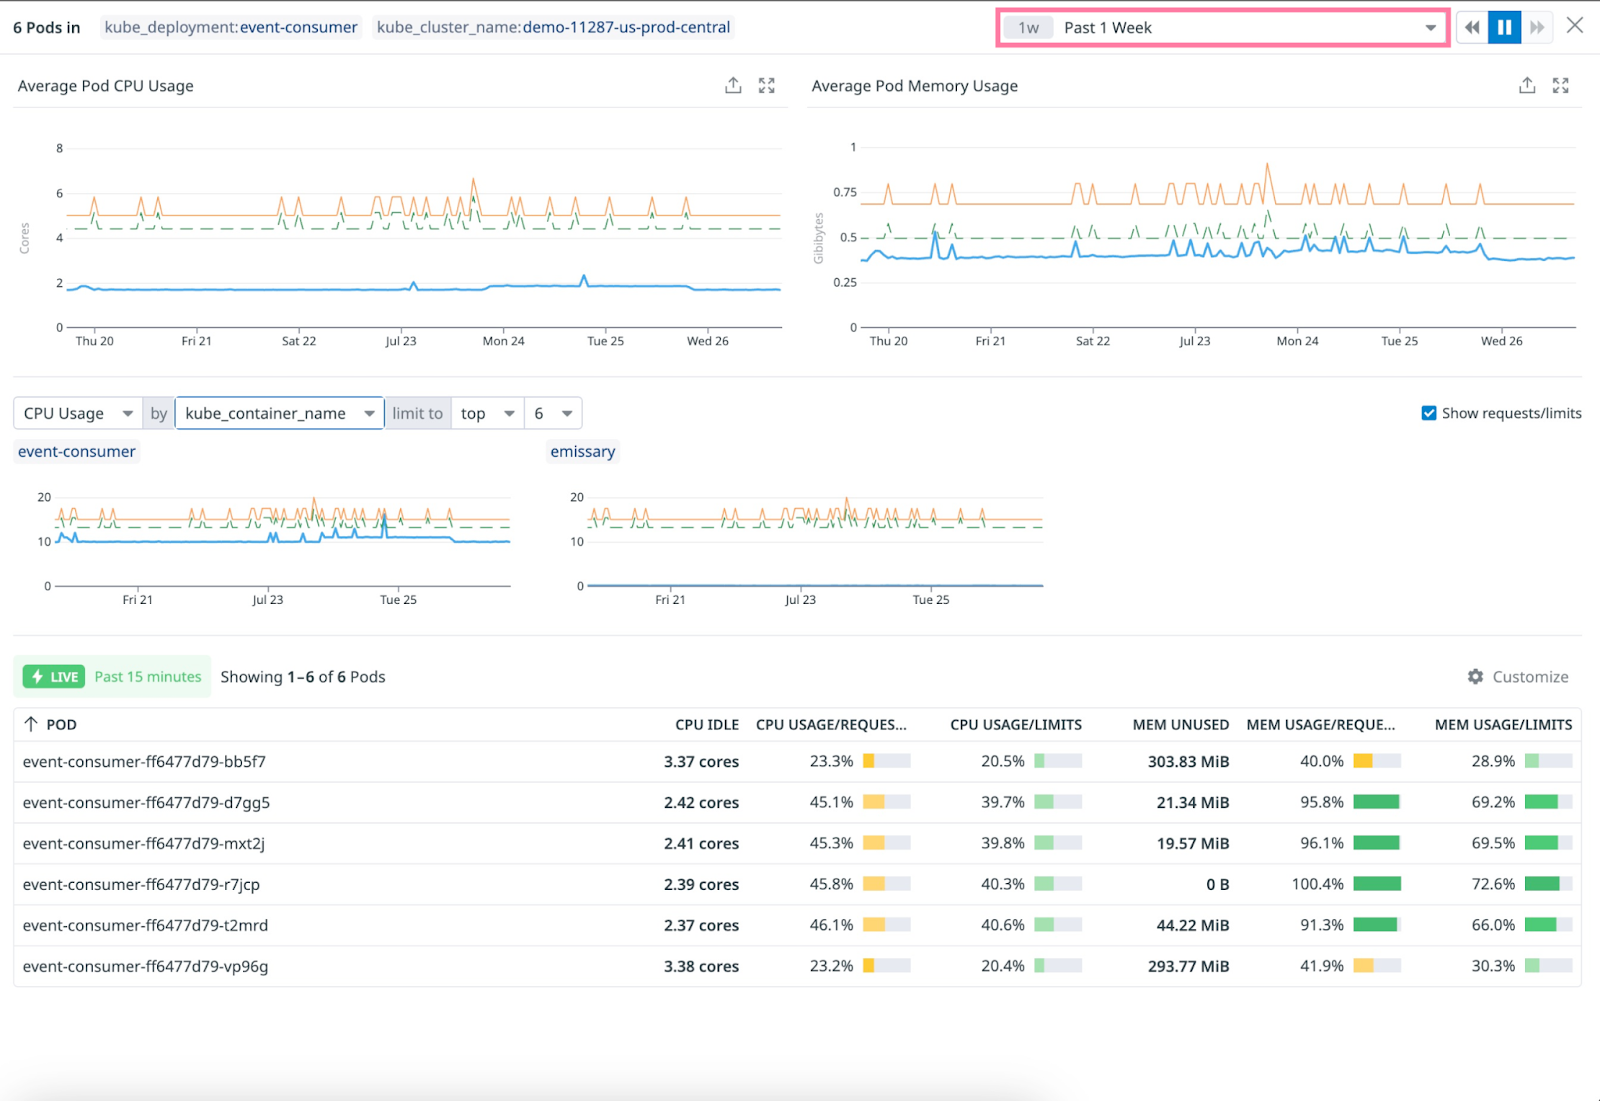
The individual pod or container graphs help you identify outliers that may impact the group in the case of load imbalance. By default, graphs are grouped by pod_name to show individual pods. You can change this to group by kube_container_name to identify which container(s) contribute the most to over/under provisioning in the case of multi-container pods.
Optimize idle resources
Idle CPU and memory are necessary to ensure that your application has room to grow without pods being immediately throttled or killed.
Too much idle CPU and memory can result in unnecessarily higher costs, but the alternative creates the risk of performance and reliability degradation if resource usage increases.
To help find this balance, adjust the graphs to look at a longer timespan, and avoid making resource sizing decisions based on the most recent usage only. These metrics are standard Kubernetes metrics, so you can query them like all Datadog metrics—for example, for the last 15 months, at full resolution if needed.
Known limitations
Metrics are not displayed for groups containing at least one pod with containers that do not set requests or limits, as Datadog cannot infer the usage percentage without them. These groups without metrics appear last, regardless of the sorting order.
The summation of resource requests and limits for a group is independent of the state of resources belonging to that group. These values may differ from the ones displayed on companion metric graphs.
Further Reading
Más enlaces, artículos y documentación útiles:


