- Esenciales
- Empezando
- Datadog
- Sitio web de Datadog
- DevSecOps
- Serverless para Lambda AWS
- Agent
- Integraciones
- Contenedores
- Dashboards
- Monitores
- Logs
- Rastreo de APM
- Generador de perfiles
- Etiquetas (tags)
- API
- Catálogo de servicios
- Session Replay
- Continuous Testing
- Monitorización Synthetic
- Gestión de incidencias
- Monitorización de bases de datos
- Cloud Security Management
- Cloud SIEM
- Application Security Management
- Workflow Automation
- CI Visibility
- Test Visibility
- Intelligent Test Runner
- Análisis de código
- Centro de aprendizaje
- Compatibilidad
- Glosario
- Atributos estándar
- Guías
- Agent
- Uso básico del Agent
- Arquitectura
- IoT
- Plataformas compatibles
- Recopilación de logs
- Configuración
- Configuración remota
- Automatización de flotas
- Actualizar el Agent
- Solucionar problemas
- Detección de nombres de host en contenedores
- Modo de depuración
- Flare del Agent
- Estado del check del Agent
- Problemas de NTP
- Problemas de permisos
- Problemas de integraciones
- Problemas del sitio
- Problemas de Autodiscovery
- Problemas de contenedores de Windows
- Configuración del tiempo de ejecución del Agent
- Consumo elevado de memoria o CPU
- Guías
- Seguridad de datos
- Integraciones
- OpenTelemetry
- Desarrolladores
- Autorización
- DogStatsD
- Checks personalizados
- Integraciones
- Crear una integración basada en el Agent
- Crear una integración API
- Crear un pipeline de logs
- Referencia de activos de integración
- Crear una oferta de mercado
- Crear un cuadro
- Crear un dashboard de integración
- Crear un monitor recomendado
- Crear una regla de detección Cloud SIEM
- OAuth para integraciones
- Instalar la herramienta de desarrollo de integraciones del Agente
- Checks de servicio
- Complementos de IDE
- Comunidad
- Guías
- API
- Aplicación móvil de Datadog
- CoScreen
- Cloudcraft
- En la aplicación
- Dashboards
- Notebooks
- Editor DDSQL
- Hojas
- Monitores y alertas
- Infraestructura
- Métricas
- Watchdog
- Bits AI
- Catálogo de servicios
- Catálogo de APIs
- Error Tracking
- Gestión de servicios
- Objetivos de nivel de servicio (SLOs)
- Gestión de incidentes
- De guardia
- Gestión de eventos
- Gestión de casos
- Workflow Automation
- App Builder
- Infraestructura
- Universal Service Monitoring
- Contenedores
- Serverless
- Monitorización de red
- Coste de la nube
- Rendimiento de las aplicaciones
- APM
- Términos y conceptos de APM
- Instrumentación de aplicación
- Recopilación de métricas de APM
- Configuración de pipelines de trazas
- Correlacionar trazas (traces) y otros datos de telemetría
- Trace Explorer
- Observabilidad del servicio
- Instrumentación dinámica
- Error Tracking
- Seguridad de los datos
- Guías
- Solucionar problemas
- Continuous Profiler
- Database Monitoring
- Gastos generales de integración del Agent
- Arquitecturas de configuración
- Configuración de Postgres
- Configuración de MySQL
- Configuración de SQL Server
- Configuración de Oracle
- Configuración de MongoDB
- Conexión de DBM y trazas
- Datos recopilados
- Explorar hosts de bases de datos
- Explorar métricas de consultas
- Explorar ejemplos de consulta
- Solucionar problemas
- Guías
- Data Streams Monitoring
- Data Jobs Monitoring
- Experiencia digital
- Real User Monitoring
- Monitorización del navegador
- Configuración
- Configuración avanzada
- Datos recopilados
- Monitorización del rendimiento de páginas
- Monitorización de signos vitales de rendimiento
- Monitorización del rendimiento de recursos
- Recopilación de errores del navegador
- Rastrear las acciones de los usuarios
- Señales de frustración
- Error Tracking
- Solucionar problemas
- Monitorización de móviles y TV
- Plataforma
- Session Replay
- Exploración de datos de RUM
- Feature Flag Tracking
- Error Tracking
- Guías
- Seguridad de los datos
- Monitorización del navegador
- Análisis de productos
- Pruebas y monitorización de Synthetics
- Continuous Testing
- Entrega de software
- CI Visibility
- CD Visibility
- Test Visibility
- Configuración
- Tests en contenedores
- Búsqueda y gestión
- Explorador
- Monitores
- Flujos de trabajo de desarrolladores
- Cobertura de código
- Instrumentar tests de navegador con RUM
- Instrumentar tests de Swift con RUM
- Detección temprana de defectos
- Reintentos automáticos de tests
- Correlacionar logs y tests
- Guías
- Solucionar problemas
- Intelligent Test Runner
- Code Analysis
- Quality Gates
- Métricas de DORA
- Seguridad
- Información general de seguridad
- Cloud SIEM
- Cloud Security Management
- Application Security Management
- Observabilidad de la IA
- Log Management
- Observability Pipelines
- Gestión de logs
- Administración
- Gestión de cuentas
- Seguridad de los datos
- Sensitive Data Scanner
- Ayuda
Network Analytics
This page is not yet available in Spanish. We are working on its translation.
If you have any questions or feedback about our current translation project, feel free to reach out to us!
If you have any questions or feedback about our current translation project, feel free to reach out to us!
Overview
The Network Analytics page provides insights into your overall network health and shows recommended queries at the top of the page. These recommended queries enable you to run common queries and see snapshots of relevant metrics, so that you can see changes in throughput, latency, DNS errors, and more. Clicking on a recommended query automatically populates the search bar, group bys, and summary graphs to provide you with relevant insights into your network.
Queries
To refine your search to traffic between particular endpoints, aggregate and filter your network connections with tags. Tags from Datadog integrations or Unified Service Tagging can be used for aggregating and filtering automatically. When utilizing tagging in Network Monitoring, you can take advantage of how network traffic flows across availability zones for a particular service or for your entire infrastructure. Grouping by client and server tags visualizes the network flow between those two sets of tags.
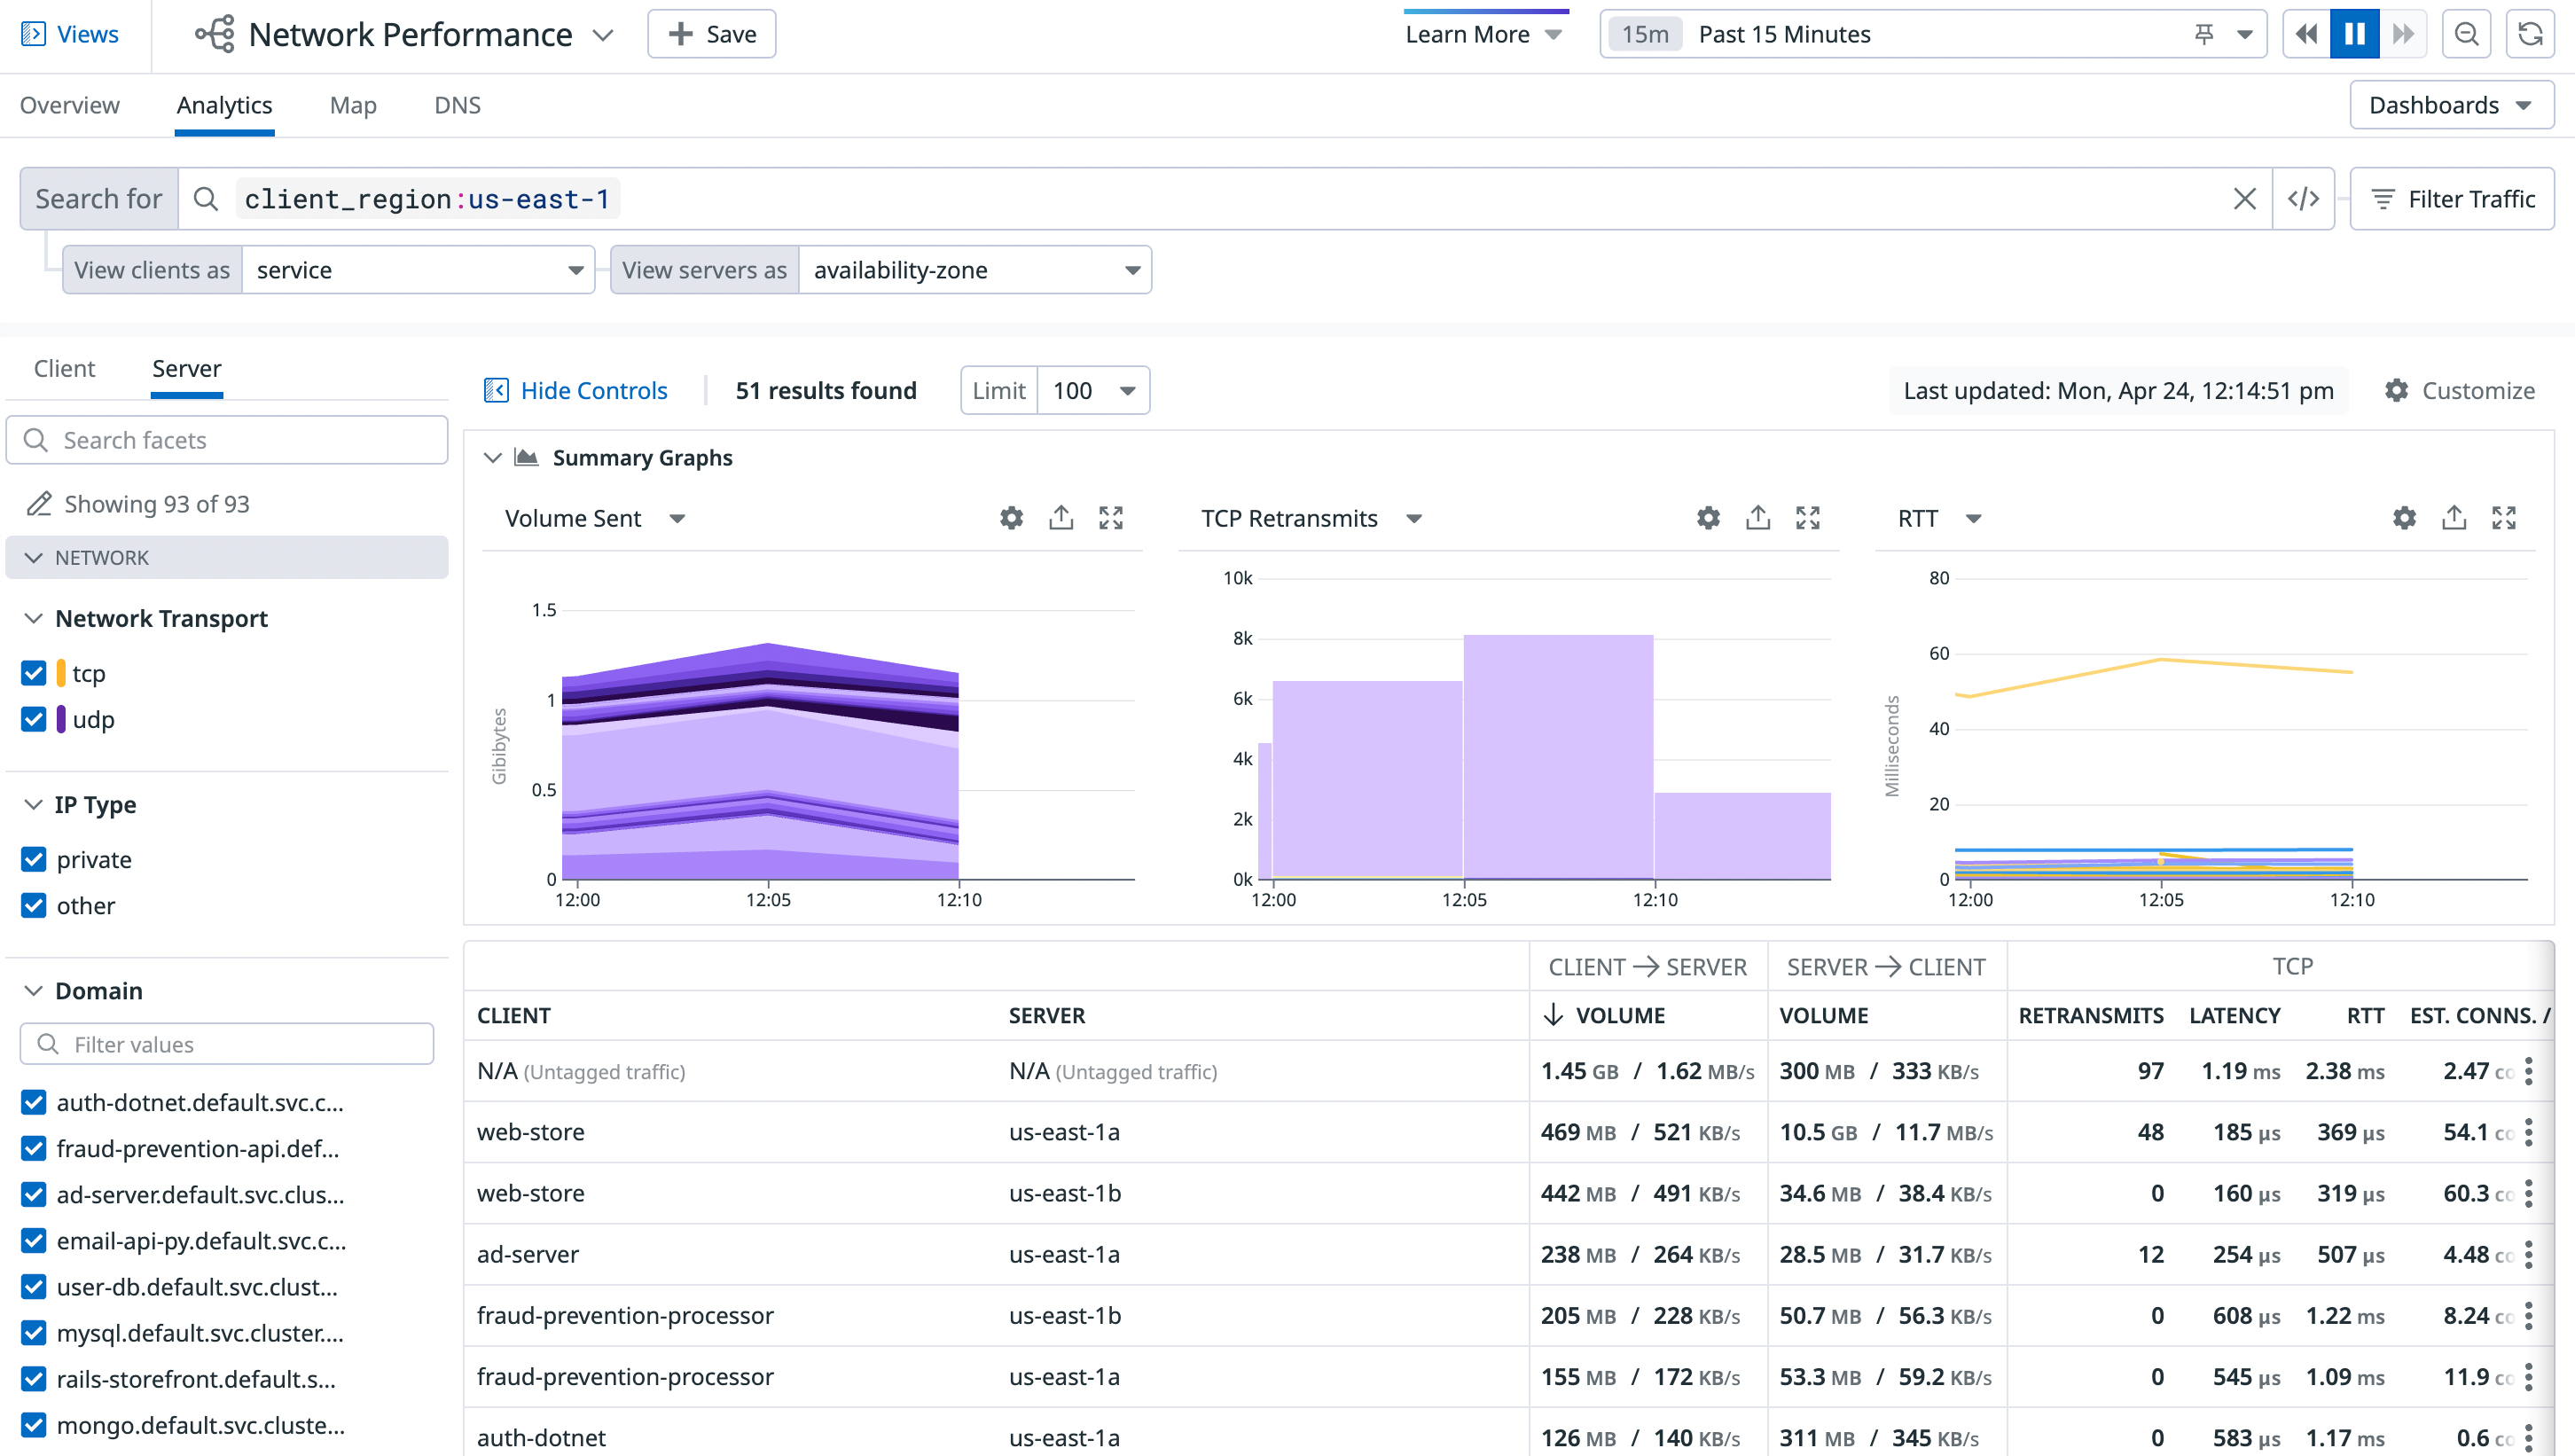
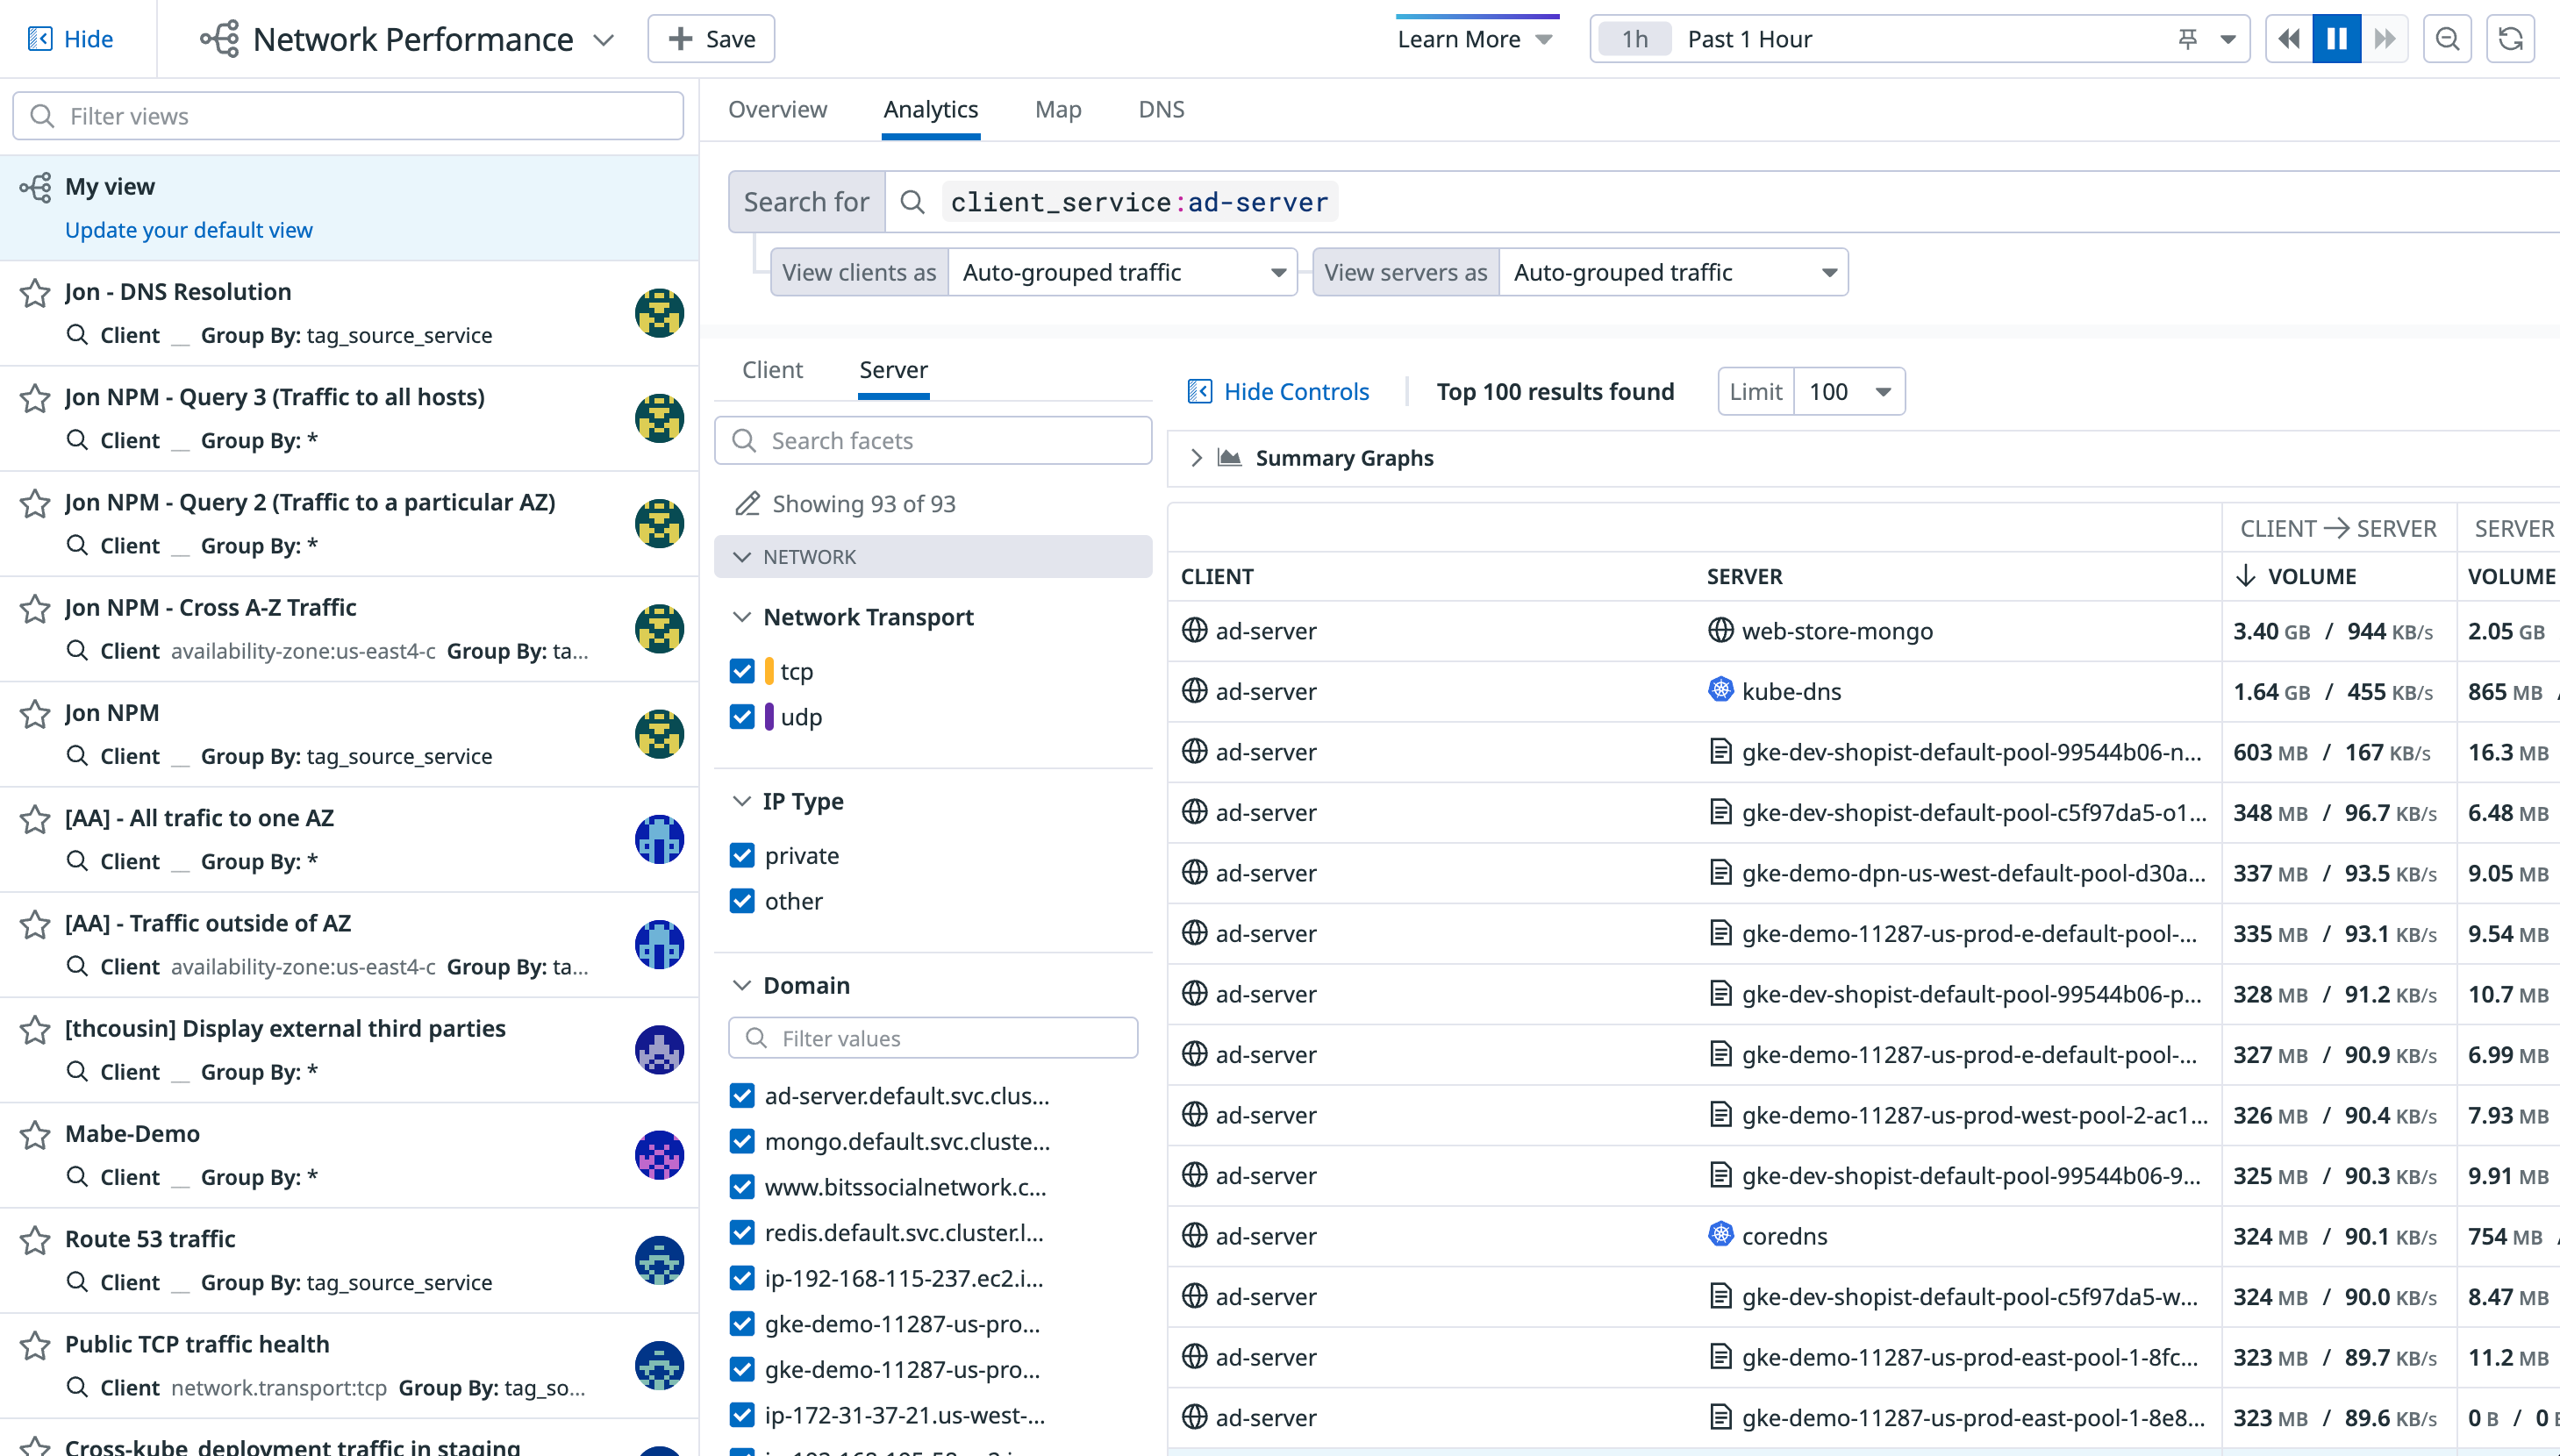
For example, if you want to see network traffic between your client ordering service called orders-app and all of your availability zones, use client_service:orders-app in the search bar, add the service tag in the View clients as drop-down, then use the availability-zone tag in the View servers as drop-down to visualize the traffic flow between these two sets of tags:
For information on NA/Untagged traffic paths, see Unresolved traffic.
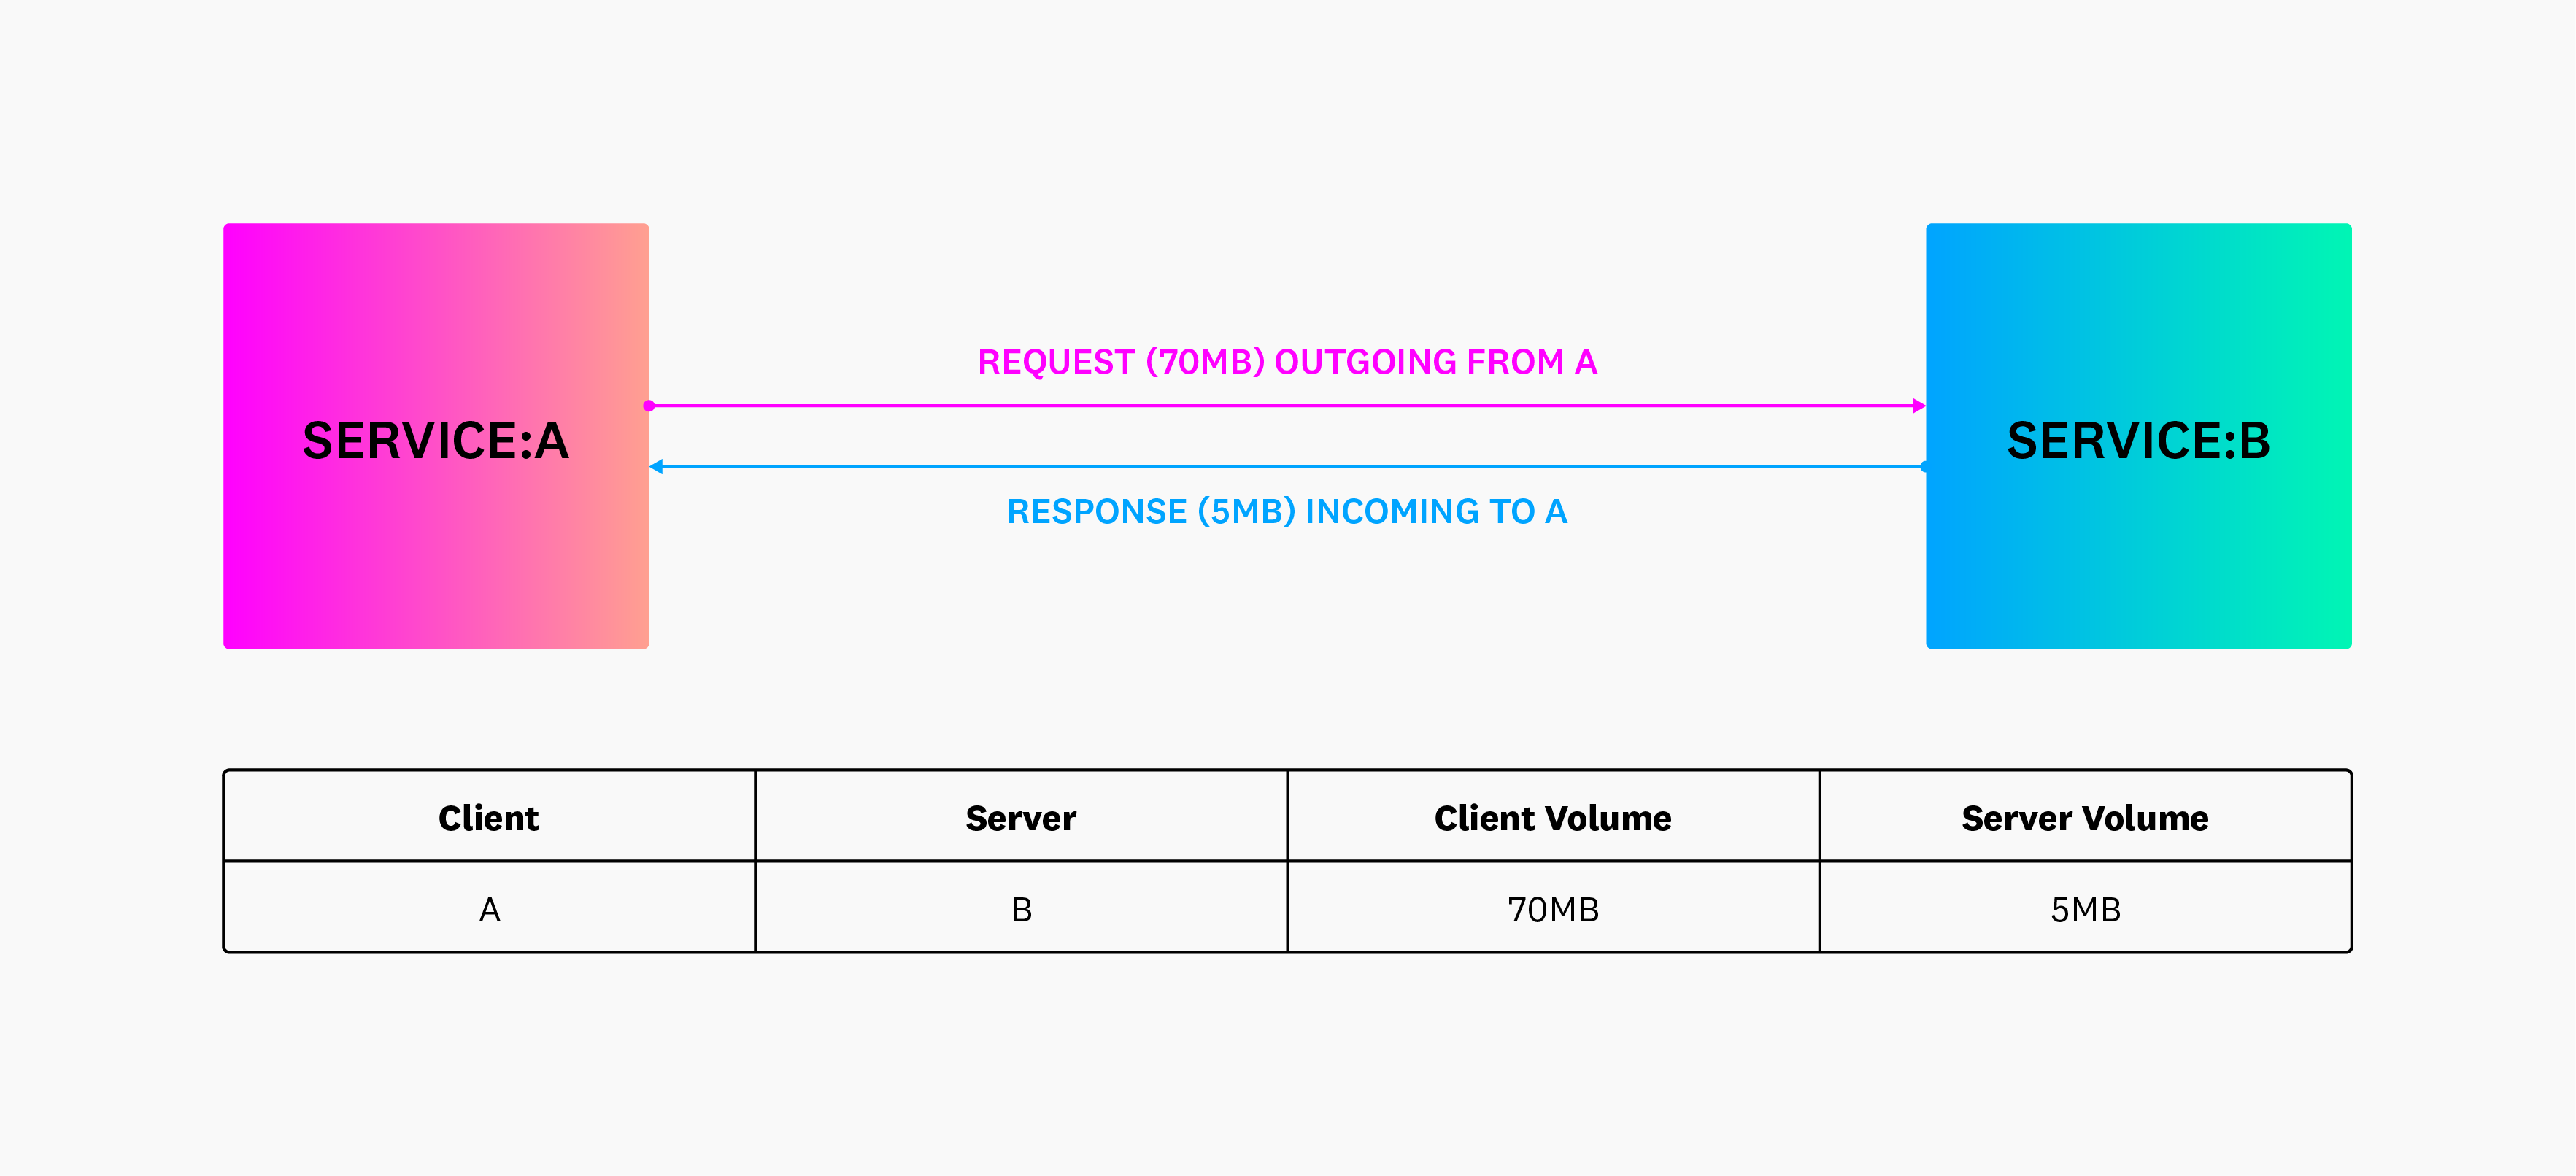
Additionally, the following diagram illustrates inbound and outbound requests when grouping by client and server tags. The client is where the connection originated, and the server is where the connection terminated.
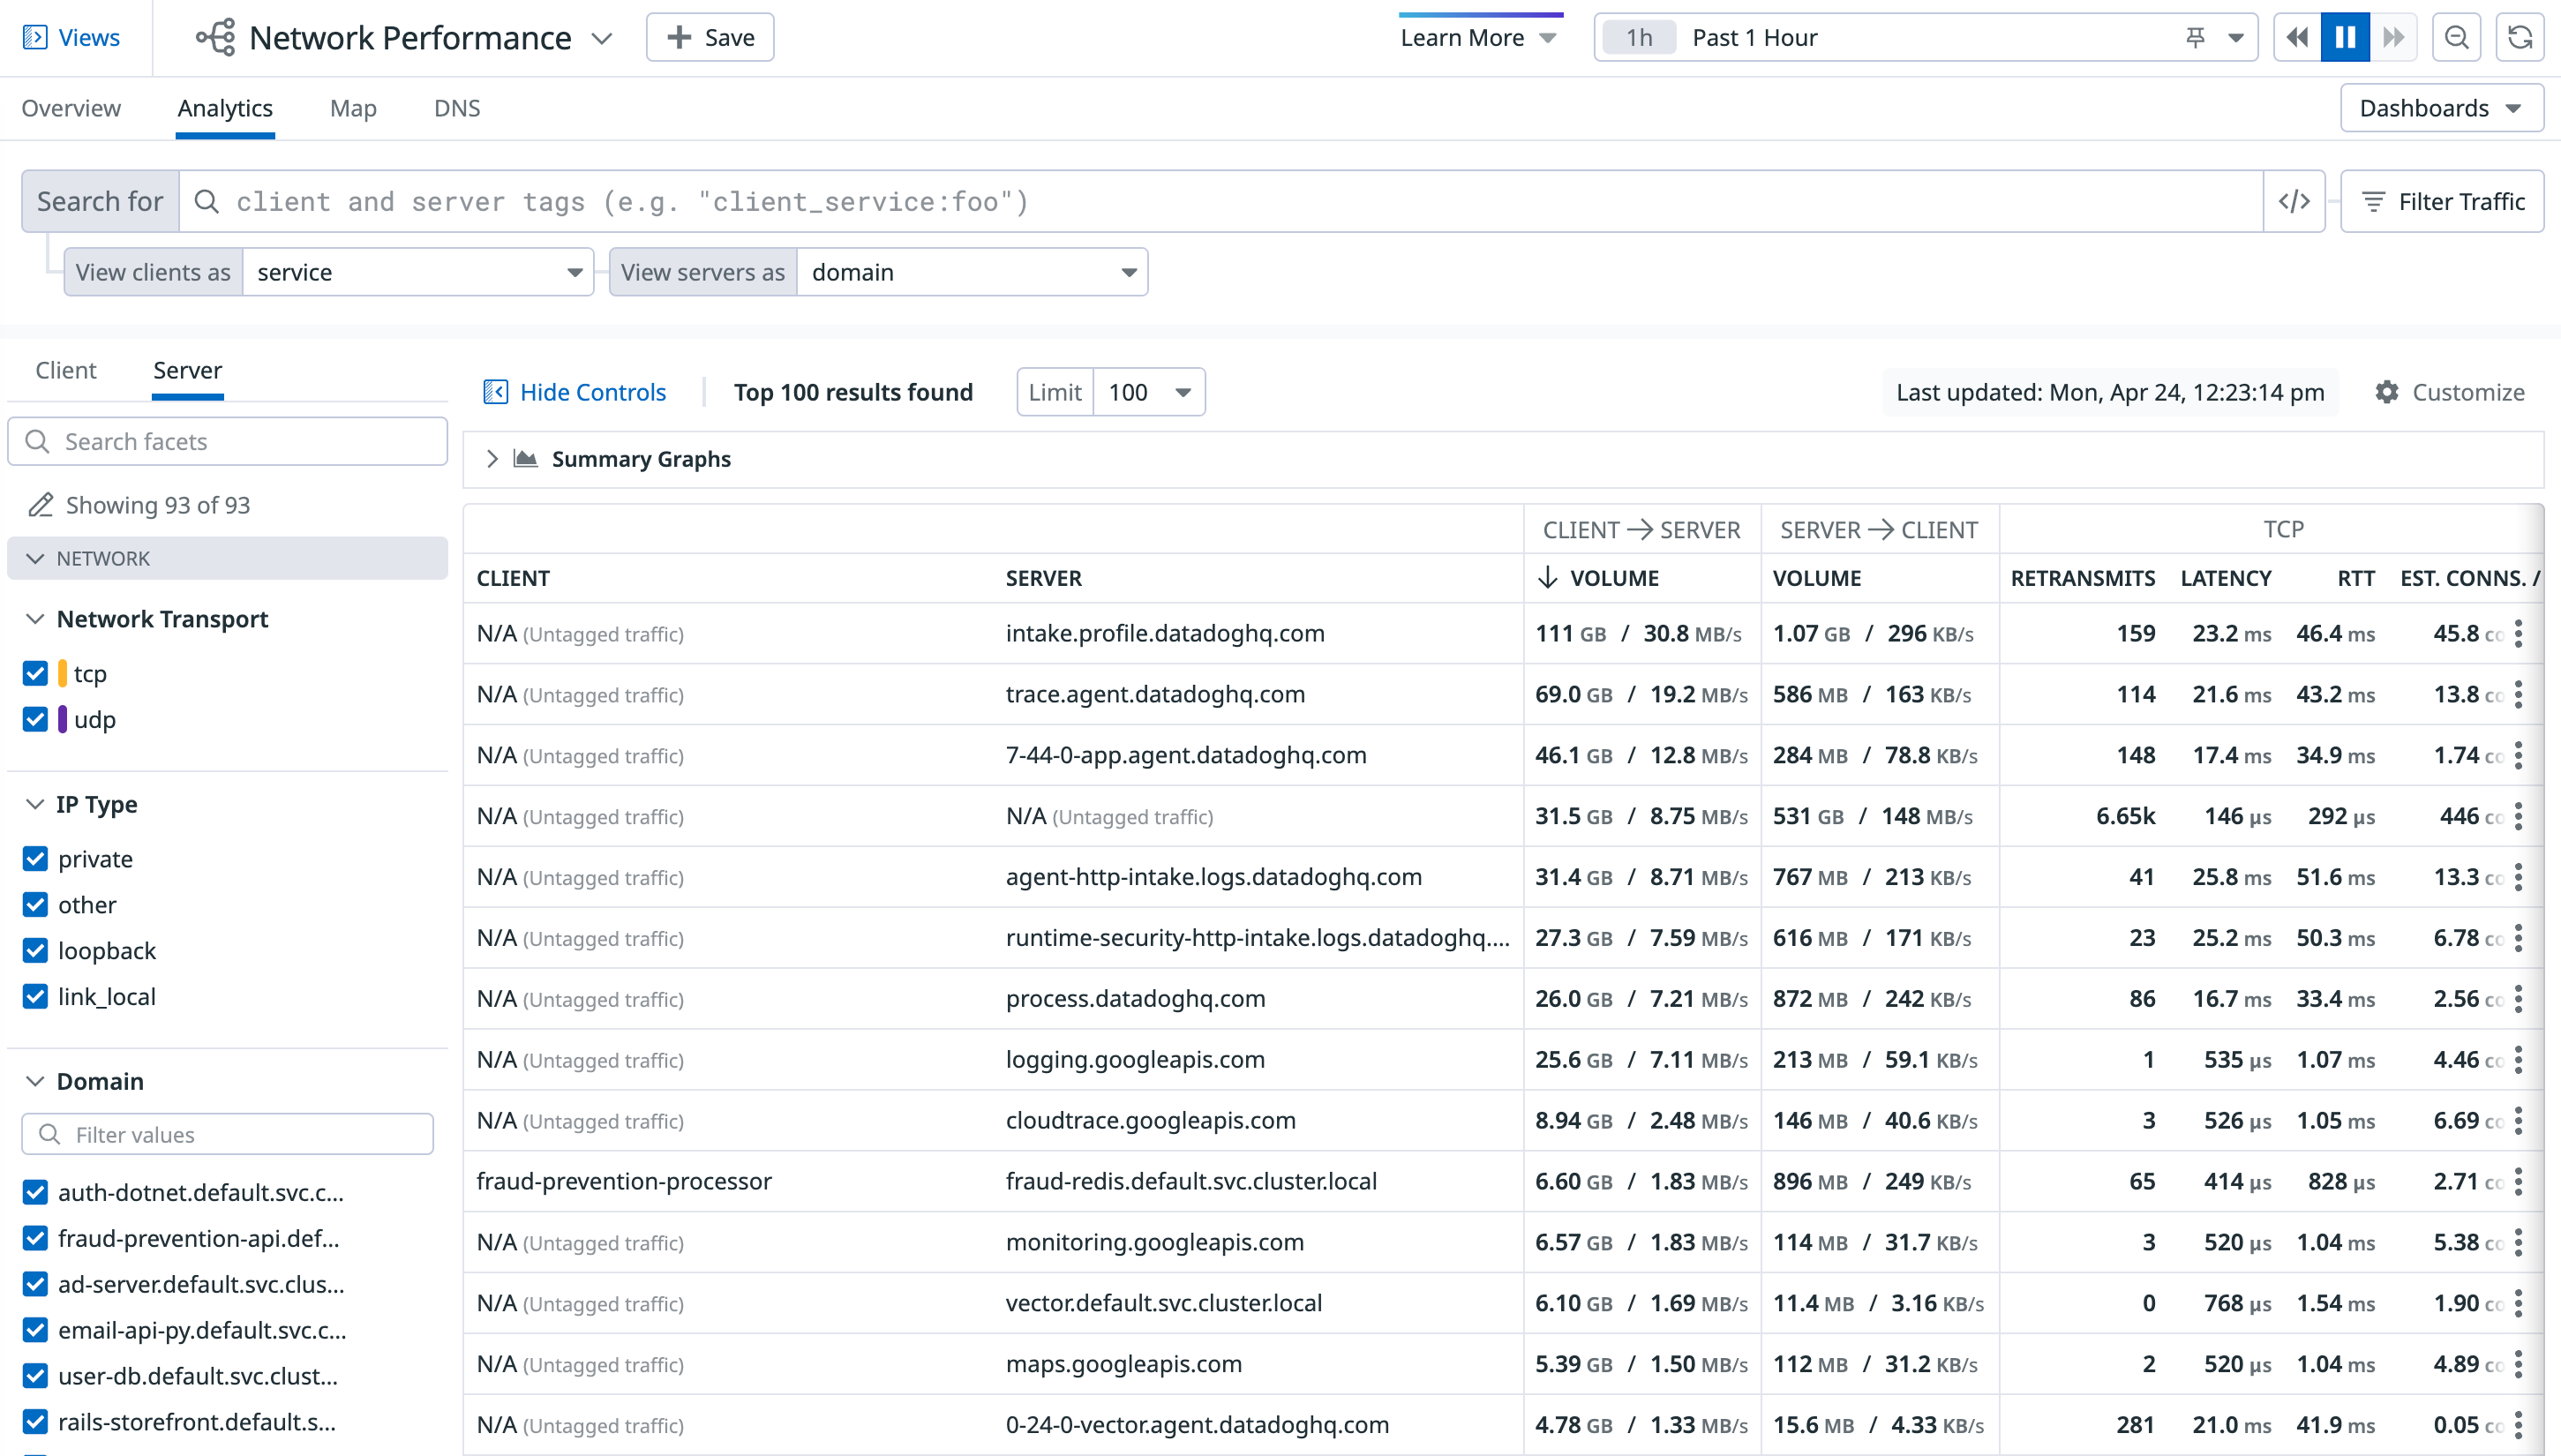
The following screenshot shows the default view, which aggregates the client and server by the service tag. Accordingly, each row in the table represents service-to-service aggregate connections when aggregated over a one hour time period. Select “Auto-grouped traffic” to see traffic bucketed into several commonly used tags such as service, kube_service, short_image, and container_name.
The next example shows all aggregate connections from IP addresses representing services in region us-east-1 to availability zones:
You can further aggregate to isolate to traffic where the client or server matches a CIDR using CIDR(network.client.ip, 10.0.0.0/8) or CIDR(network.server.ip, 10.0.0.0/8).
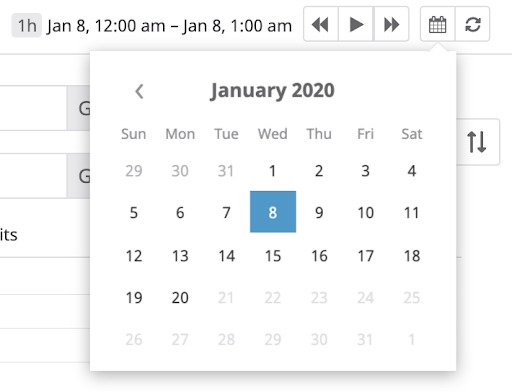
Additionally, set the timeframe over which traffic is aggregated using the time selector at the top right of the page:
Recommended queries
Recommended queries allow you to begin investigating into your network—whether you’re troubleshooting a specific issue or gaining a better overall understanding of your network. The recommended queries help you quickly find relevant network information without needing to search for or group the traffic. For example, the recommended query Find dependencies of service: web-store populates the search bar with the query client_service: web-store and displays the top services that the service web-store is sending traffic to within the network, and therefore its downstream dependencies.
Any available recommended queries are provided at the top of the Analytics page, and there are three recommended queries at the top of the DNS page. Use these queries to access commonly used data, and see any changes in that data in the last hour.
To run a recommended query, click on the tile. Hovering over the tile displays a description and summary of the data the query returns.
Facet panels
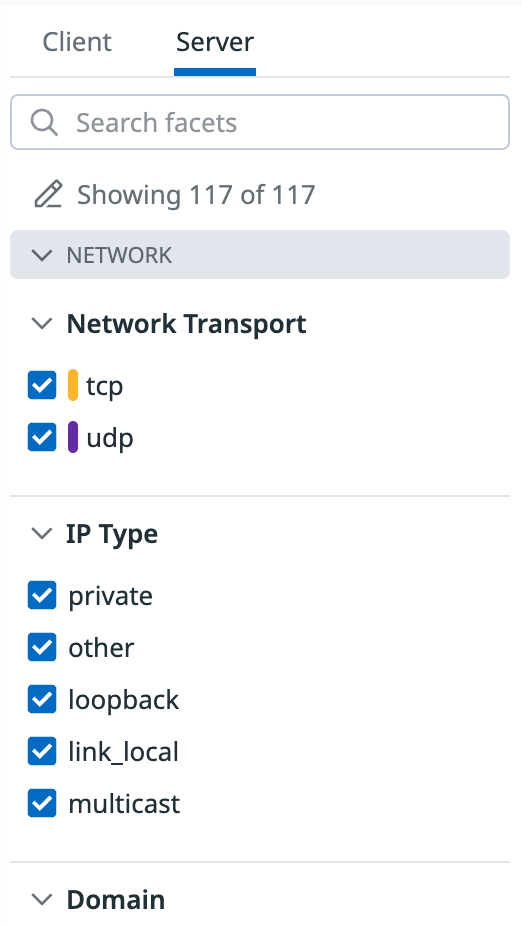
You can use the facet panels to browse through all of the tags available on your flows, or filter traffic when you don’t remember the exact tags you were looking for. Facet panels mirror the tags in your search bar query. Switch between the facet panels with the Client and Server tabs on top:
Custom facets
Aggregate and filter your traffic data by any tags in Datadog network page. An include list of tags is provided by default, which you can find in the search bar dropdown menu:
Include listed tags are service, availability zone, env, environment, pod, host, ip, and port, among others. If you want to aggregate or filter traffic by a tag that is not already in the menu, add it as a custom Facet:
- Select the
+button on the top right of the facet panels. - Enter the relevant tag you want to create a custom facet upon.
- Click
Create.
Once the custom facet is created, use this tag to filter and aggregate traffic in the network page and map. All custom facets can be viewed in the bottom Custom section of the facet panels.
Wildcard search
To perform a multi-character wildcard search, use the * symbol as follows:
client_service:web*matches all client services that start with webclient_service:*webmatches all client services that end with webclient_service:*web*matches all client services that contain the string web
Wildcard searches work within facets with this syntax. This query returns all the client services that end with the string “mongo”:
client_service:*mongo
To learn more, see the search syntax documentation.
Group by
Groups allow you to group your data by a given tag’s value. For example, if you select a grouping such as host, results are grouped by individual hosts. You can also choose to view all your data in a single group using the Ungrouped traffic option. Additionally, you may have large chunks of data that are not tagged by the grouping you’re interested in. In these situations, you can use Auto-grouped traffic to group data by whichever tags are available.
Summary graphs
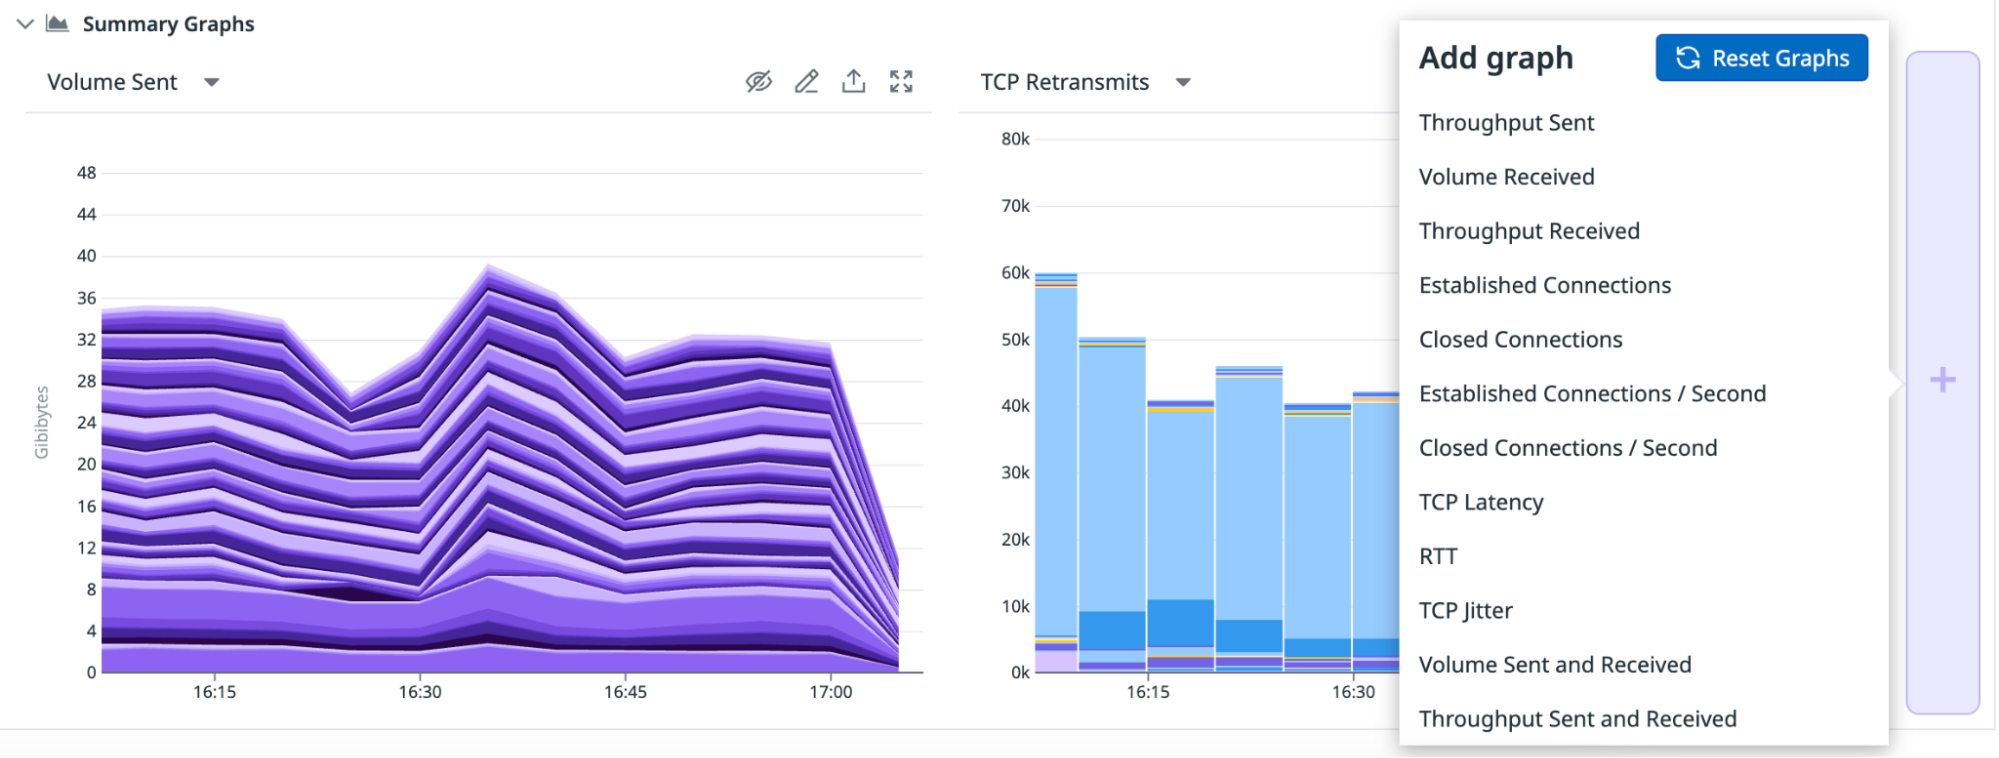
The summary graphs are a condensed view of your network, which you can modify to display volume, throughput, connections, or latency as needed. Display up to three summary graphs at a time, and change the data and visualization type to suit your organization. To update a graph’s data source, click on the graph’s title and make a selection from the dropdown menu.
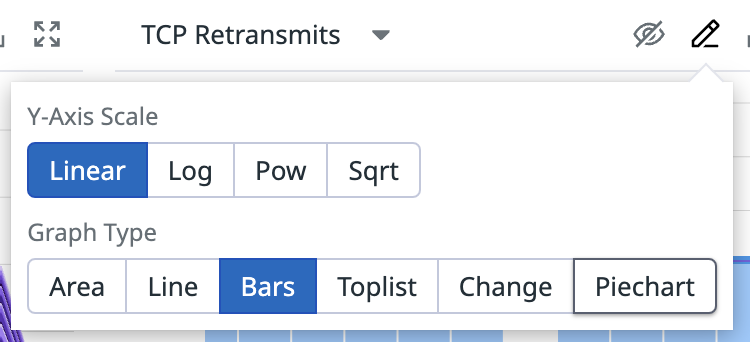
To change the visualization type, click on the pencil icon in the top right corner of the graph. Select from the options available, as shown in the screenshot below.
To hide a specific graph, click on the hide icon next to the pencil icon. You can display as little as one graph or as many as three graphs. To add graphs, click on the plus icon + on the right side of the summary graph and select the graph to add. You can also reset the graphs to the default graphs when adding a new graph.
Network data
Your network metrics are displayed through the graphs and the associated table. All sent and received metrics are displayed from the perspective of the source:
- Sent metrics: measure the value of something from the source to the destination from the source’s perspective.
- Received metrics: measure the value of something from the destination to the source from the source’s perspective.
Values displayed might be different for sent_metric(source to destination) and received_metric(destination to source) if there is a large number of packet drops. In this case, if the destination sends a lot of bytes to the source, the aggregate connections that originate at destination include those bytes, but the aggregate connections that originate at source do not see them as received.
Note: Data is collected every 30 seconds, aggregated in five minute buckets, and retained for 14 days.
Metrics
Network load
The following network load metrics are available:
| Metric | Description |
|---|---|
| Volume | The number of bytes sent or received over a period. Measured in bytes (or orders of magnitude thereof) bidirectional. |
| Throughput | The rate of bytes sent or received over a period. Measured in bytes per second, bidirectional. |
TCP
TCP is a connection-oriented protocol that guarantees in-order delivery of packets.
The following TCP metrics are available:
| Metric | Description |
|---|---|
| TCP Retransmits | TCP Retransmits represent detected failures that are retransmitted to ensure delivery. Measured in count of retransmits from the client. |
| TCP Latency | Measured as TCP smoothed round-trip time, that is, the time between a TCP frame being sent and acknowledged. |
| TCP Jitter | Measured as TCP smoothed round-trip time variance. |
| Established Connections | The number of TCP connections in an established state. Measured in connections per second from the client. |
| Closed Connections | The number of TCP connections in a closed state. Measured in connections per second from the client. |
All metrics are instrumented from the perspective of the client side of the connection when available, or the server if not.
Cloud service autodetection
If you’re relying on managed cloud services like S3 or Kinesis, you can monitor the performance of traffic to those services from your internal applications. Scope your view to a particular AWS, Google Cloud, or Azure dependency to pinpoint latency, assess database performance, and visualize your network more completely.
For instance, you can:
- Visualize data flow from your internal Kubernetes cluster to
server_service:aws.s3in the Network Map. - Pivot to the Network Page to isolate which pods are establishing the most connections to that service, and
- Validate that their request is successful by analyzing S3 performance metrics, which are correlated with traffic performance directly in the side panel for a given dependency, under the Integration Metrics tab.
NPM automatically maps:
- Network calls to S3 (which can broken down by
s3_bucket), RDS (which can be broken down byrds_instance_type), Kinesis, ELB, Elasticache, and other AWS services. - API calls to AppEngine, Google DNS, Gmail, and other Google Cloud services.
To monitor other endpoints where an Agent cannot be installed (such as public APIs), group the destination in the Network Overview by the domain tag. Or, see the section below for cloud service resolution.
Cloud service enhanced resolution
If you have setup enhanced resolution for AWS or Azure, NPM can filter and group network traffic with several resources collected from these cloud providers. Depending on the cloud provider and resource, you have different sets of tags available to query with. Datadog applies the tags defined below in addition to the user-defined tags.
Amazon Web Services
- name
- loadbalancer
- load_balancer_arn
- dns_name (format loadbalancer/dns:)
- region
- account_id
- scheme
- custom (user-defined) tags applied to AWS Loadbalancers
- gateway_id
- gateway_type
- aws_nat_gateway_id
- aws_nat_gateway_public_ip
- aws_account
- availability-zone
- region
- custom (user) tags applied to AWS Nat Gateways
- gateway_id
- gateway_type
- aws_internet_gateway_id
- aws_account
- region
- custom (user) tags applied to VPC Internet Gateways
- gateway_id
- gateway_type
- aws_vpc_endpoint_id
- custom (user) tags applied to VPC Internet Endpoints
Azure
Loadbalancers and Application Gateways
- name
- loadbalancer
- cloud_provider
- region
- type
- resource_group
- tenant_name
- subscription_name
- subscription_id
- sku_name
- custom (user-defined) tags applied to Azure Loadbalancers and Application Gateways
Domain resolution
Starting with Agent 7.17+, the Agent resolves IPs to human-readable domain names for external and internal traffic. Domain allows you to monitor cloud provider endpoints where a Datadog Agent cannot be installed, such as S3 buckets, application load balancers, and APIs. Unrecognizable domain names such as DGA domains from C&C servers may point to network security threats. domain is encoded as a tag in Datadog, so you can use it in search bar queries and the facet panel to aggregate and filter traffic.
Note: DNS resolution is supported for hosts where the system probe is running on the root network namespace, which is usually caused by running the system-probe in a container without using the host network.
Network Address Translation (NAT)
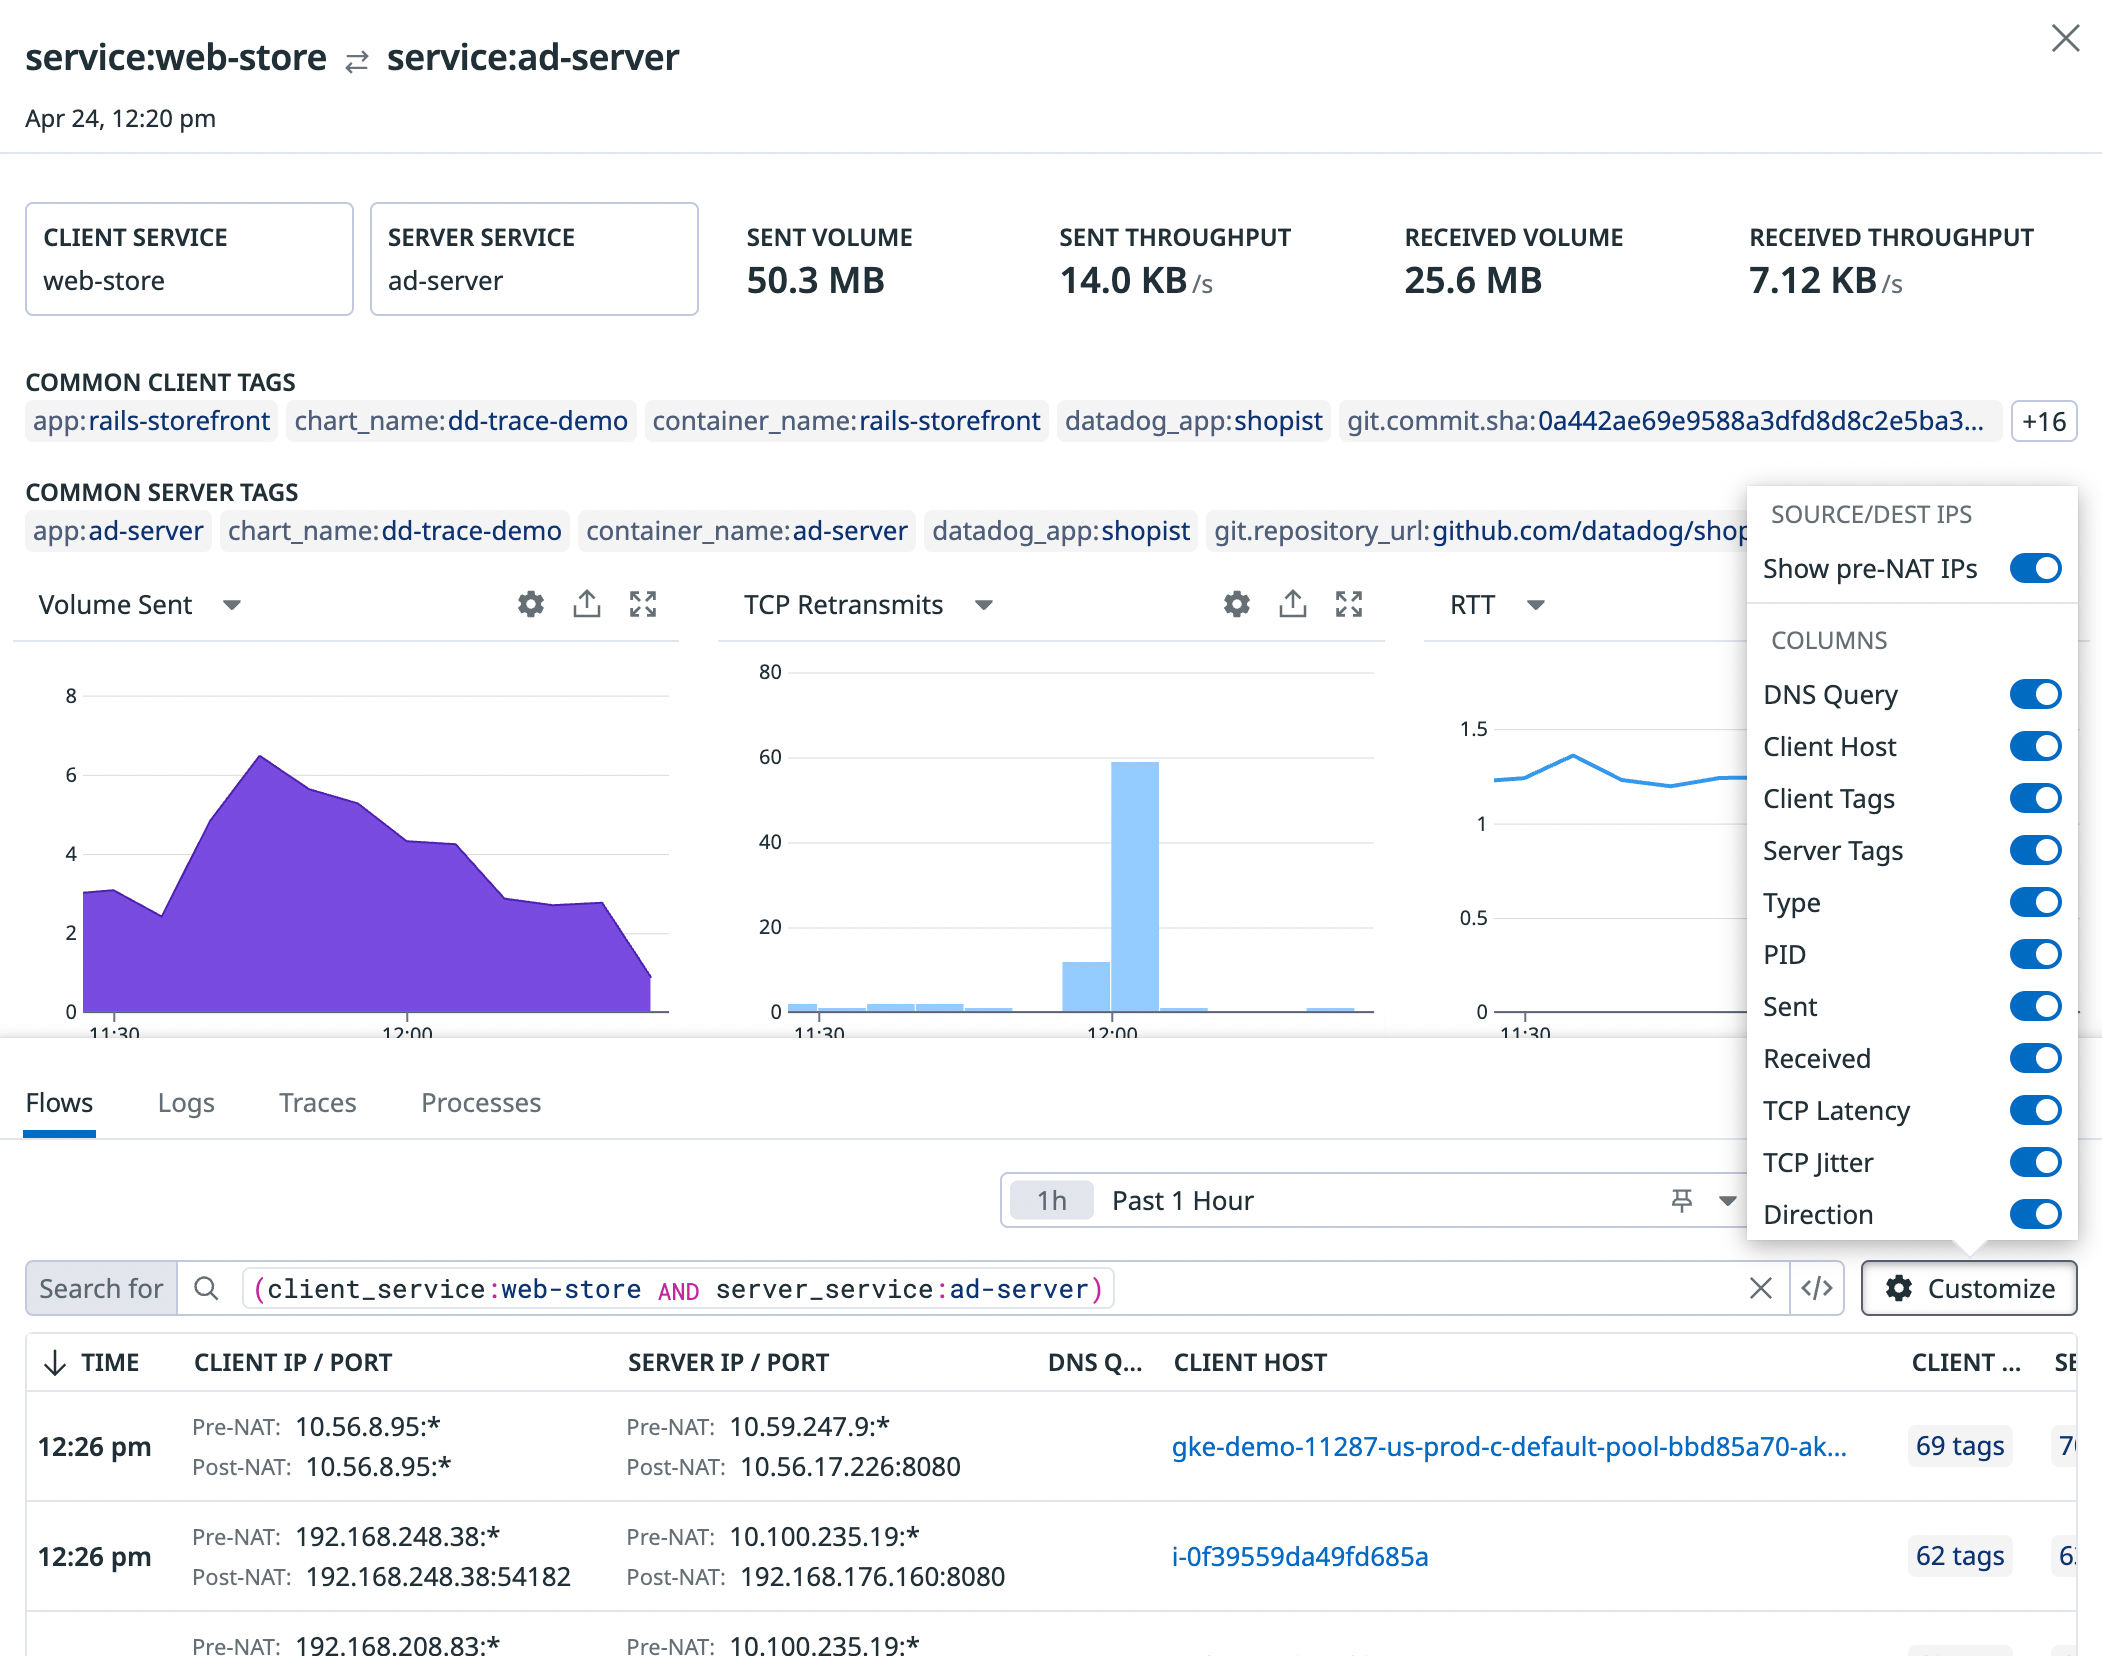
NAT is a tool used by Kubernetes and other systems to route traffic between containers. When investigating a specific dependency (for example, service to service), you can use the presence or absence of pre-NAT IPs to distinguish between Kubernetes-native services, which do their own routing, and services that rely on external clients for routing. This feature does not currently include resolution of NAT gateways.
To view pre-NAT and post-NAT IPs, use the Show pre-NAT IPs toggle in the table settings. When this setting is toggled off, IPs shown in the Client IP and Server IP columns are by default post-NAT IPs. In cases where you have multiple pre-NAT IPs for one post-NAT IP, the top 5 most common pre-NAT IPs are displayed. pre_nat.ip is a tag like any other in the product, so you can use it to aggregate and filter traffic.
Network ID
NPM users may configure their networks to have overlapping IP spaces. For instance, you may want to deploy in multiple VPCs (virtual private clouds) which have overlapping address ranges and communicate only through load balancers or cloud gateways.
To correctly classify traffic destinations, NPM uses the concept of a network ID, which is represented as a tag. A network ID is an alphanumeric identifier for a set of IP addresses that can communicate with one another. When an IP address mapping to several hosts with different network IDs is detected, this identifier is used to determine the particular host network traffic is going to or coming from.
In AWS and Google Cloud, the network ID is automatically set to the VPC ID. For other environments, the network ID may be set manually, either in datadog.yaml as shown below, or by adding the DD_NETWORK_ID to the process and core Agent containers.
network:
   Id: <your-network-id>
Saved views
Organize and share views of traffic data. Saved Views make debugging faster and empower collaboration. For instance, you can create a view, save it for the future for common queries, and copy its link to share network data with your teammates.
- To save a view: click the + Save button and name the view to record your current query, table configuration, and graph metric selections.
- To load a view: click Views at the top left to see your Saved Views and select a view from the list.
- To rename a view: hover over a view in the Saved Views list and click the gear icon to Edit name.
- To share a view: hover over a view in the Saved Views list and click the link icon to Copy permalink.
To learn more, see the Saved Views documentation.
Table
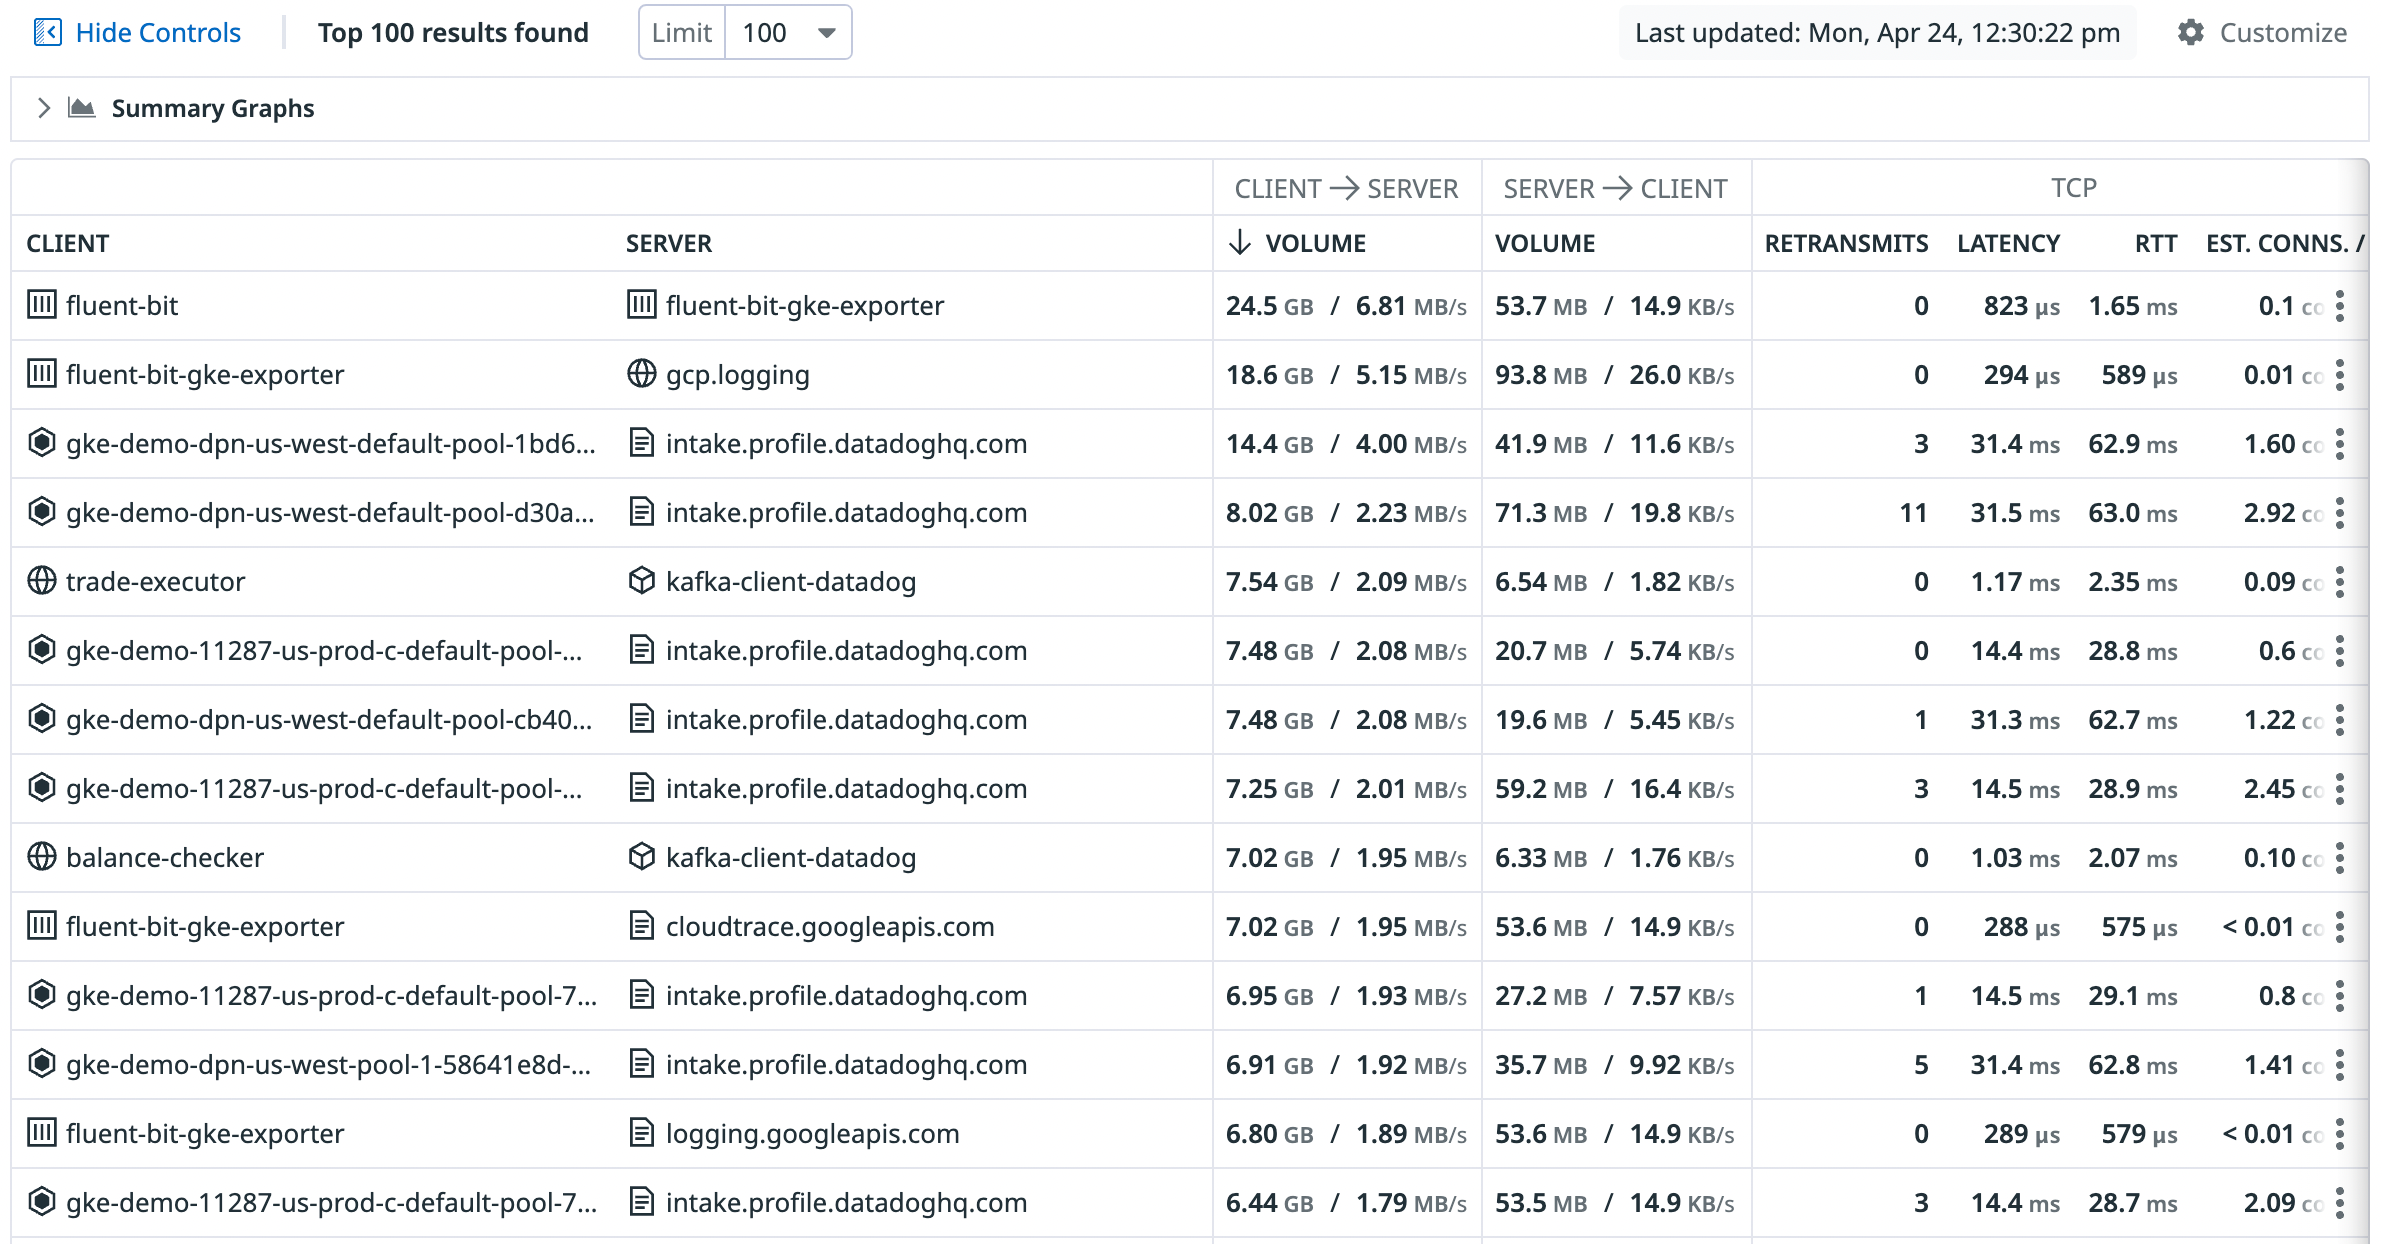
The network table breaks down the Volume, Throughput, TCP Retransmits, Round-trip Time (RTT), and RTT variance metrics between each source and destination defined by your query.
You can configure the columns in your table using the Customize button at the top right of the table.
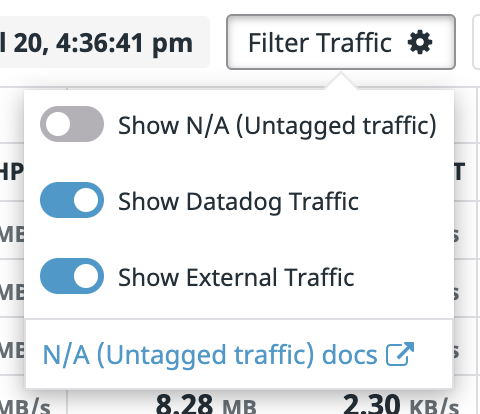
Configure the traffic shown with the Filter Traffic button.
External traffic (to public IPs) and Datadog Agent traffic is shown by default. To narrow down your view, you can choose to toggle off the Show Datadog Traffic and Show External Traffic toggles.
Unresolved traffic
Unresolved client and server tags are marked as N/A. A traffic client or server endpoint may be unresolved because:
- The host or container client or server IPs are not tagged with the client or server tags used for traffic aggregation.
- The endpoint is outside of your private network, and accordingly is not tagged by the Datadog Agent.
- The endpoint is a firewall, service mesh or other entity where a Datadog Agent cannot be installed.
Use the Show N/A (Unresolved Traffic) toggle in the upper right corner of the data table to filter out aggregate connections with unresolved (N/A) clients or servers.
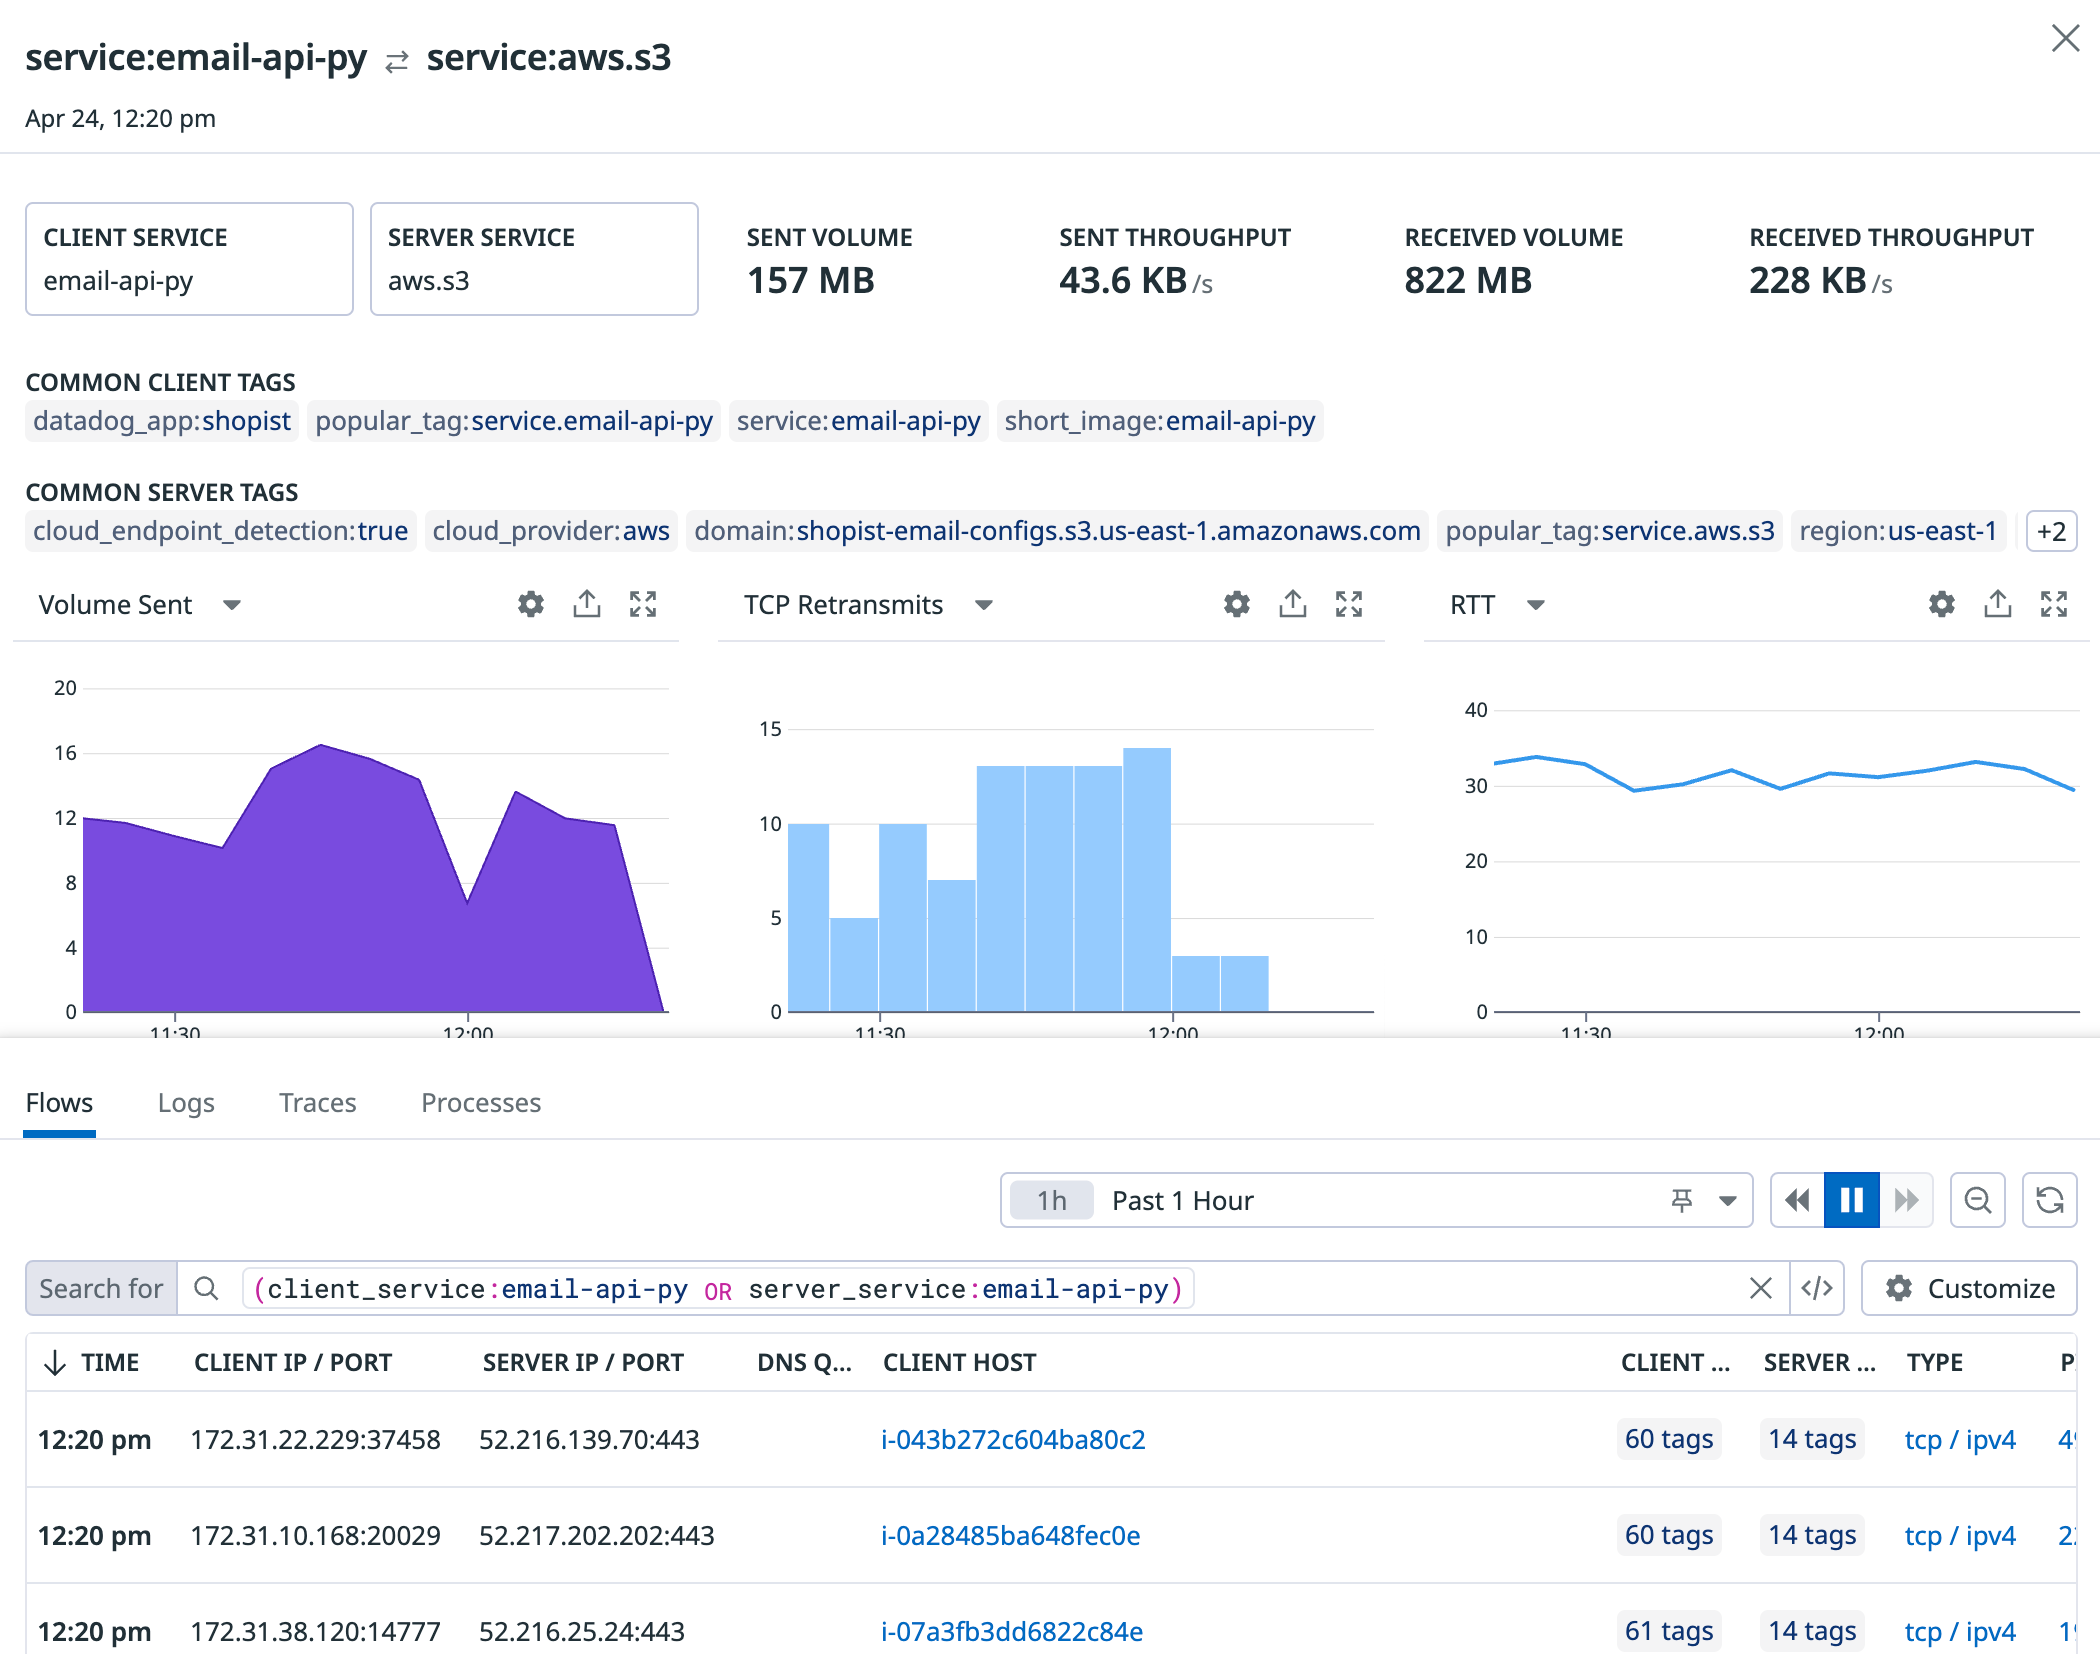
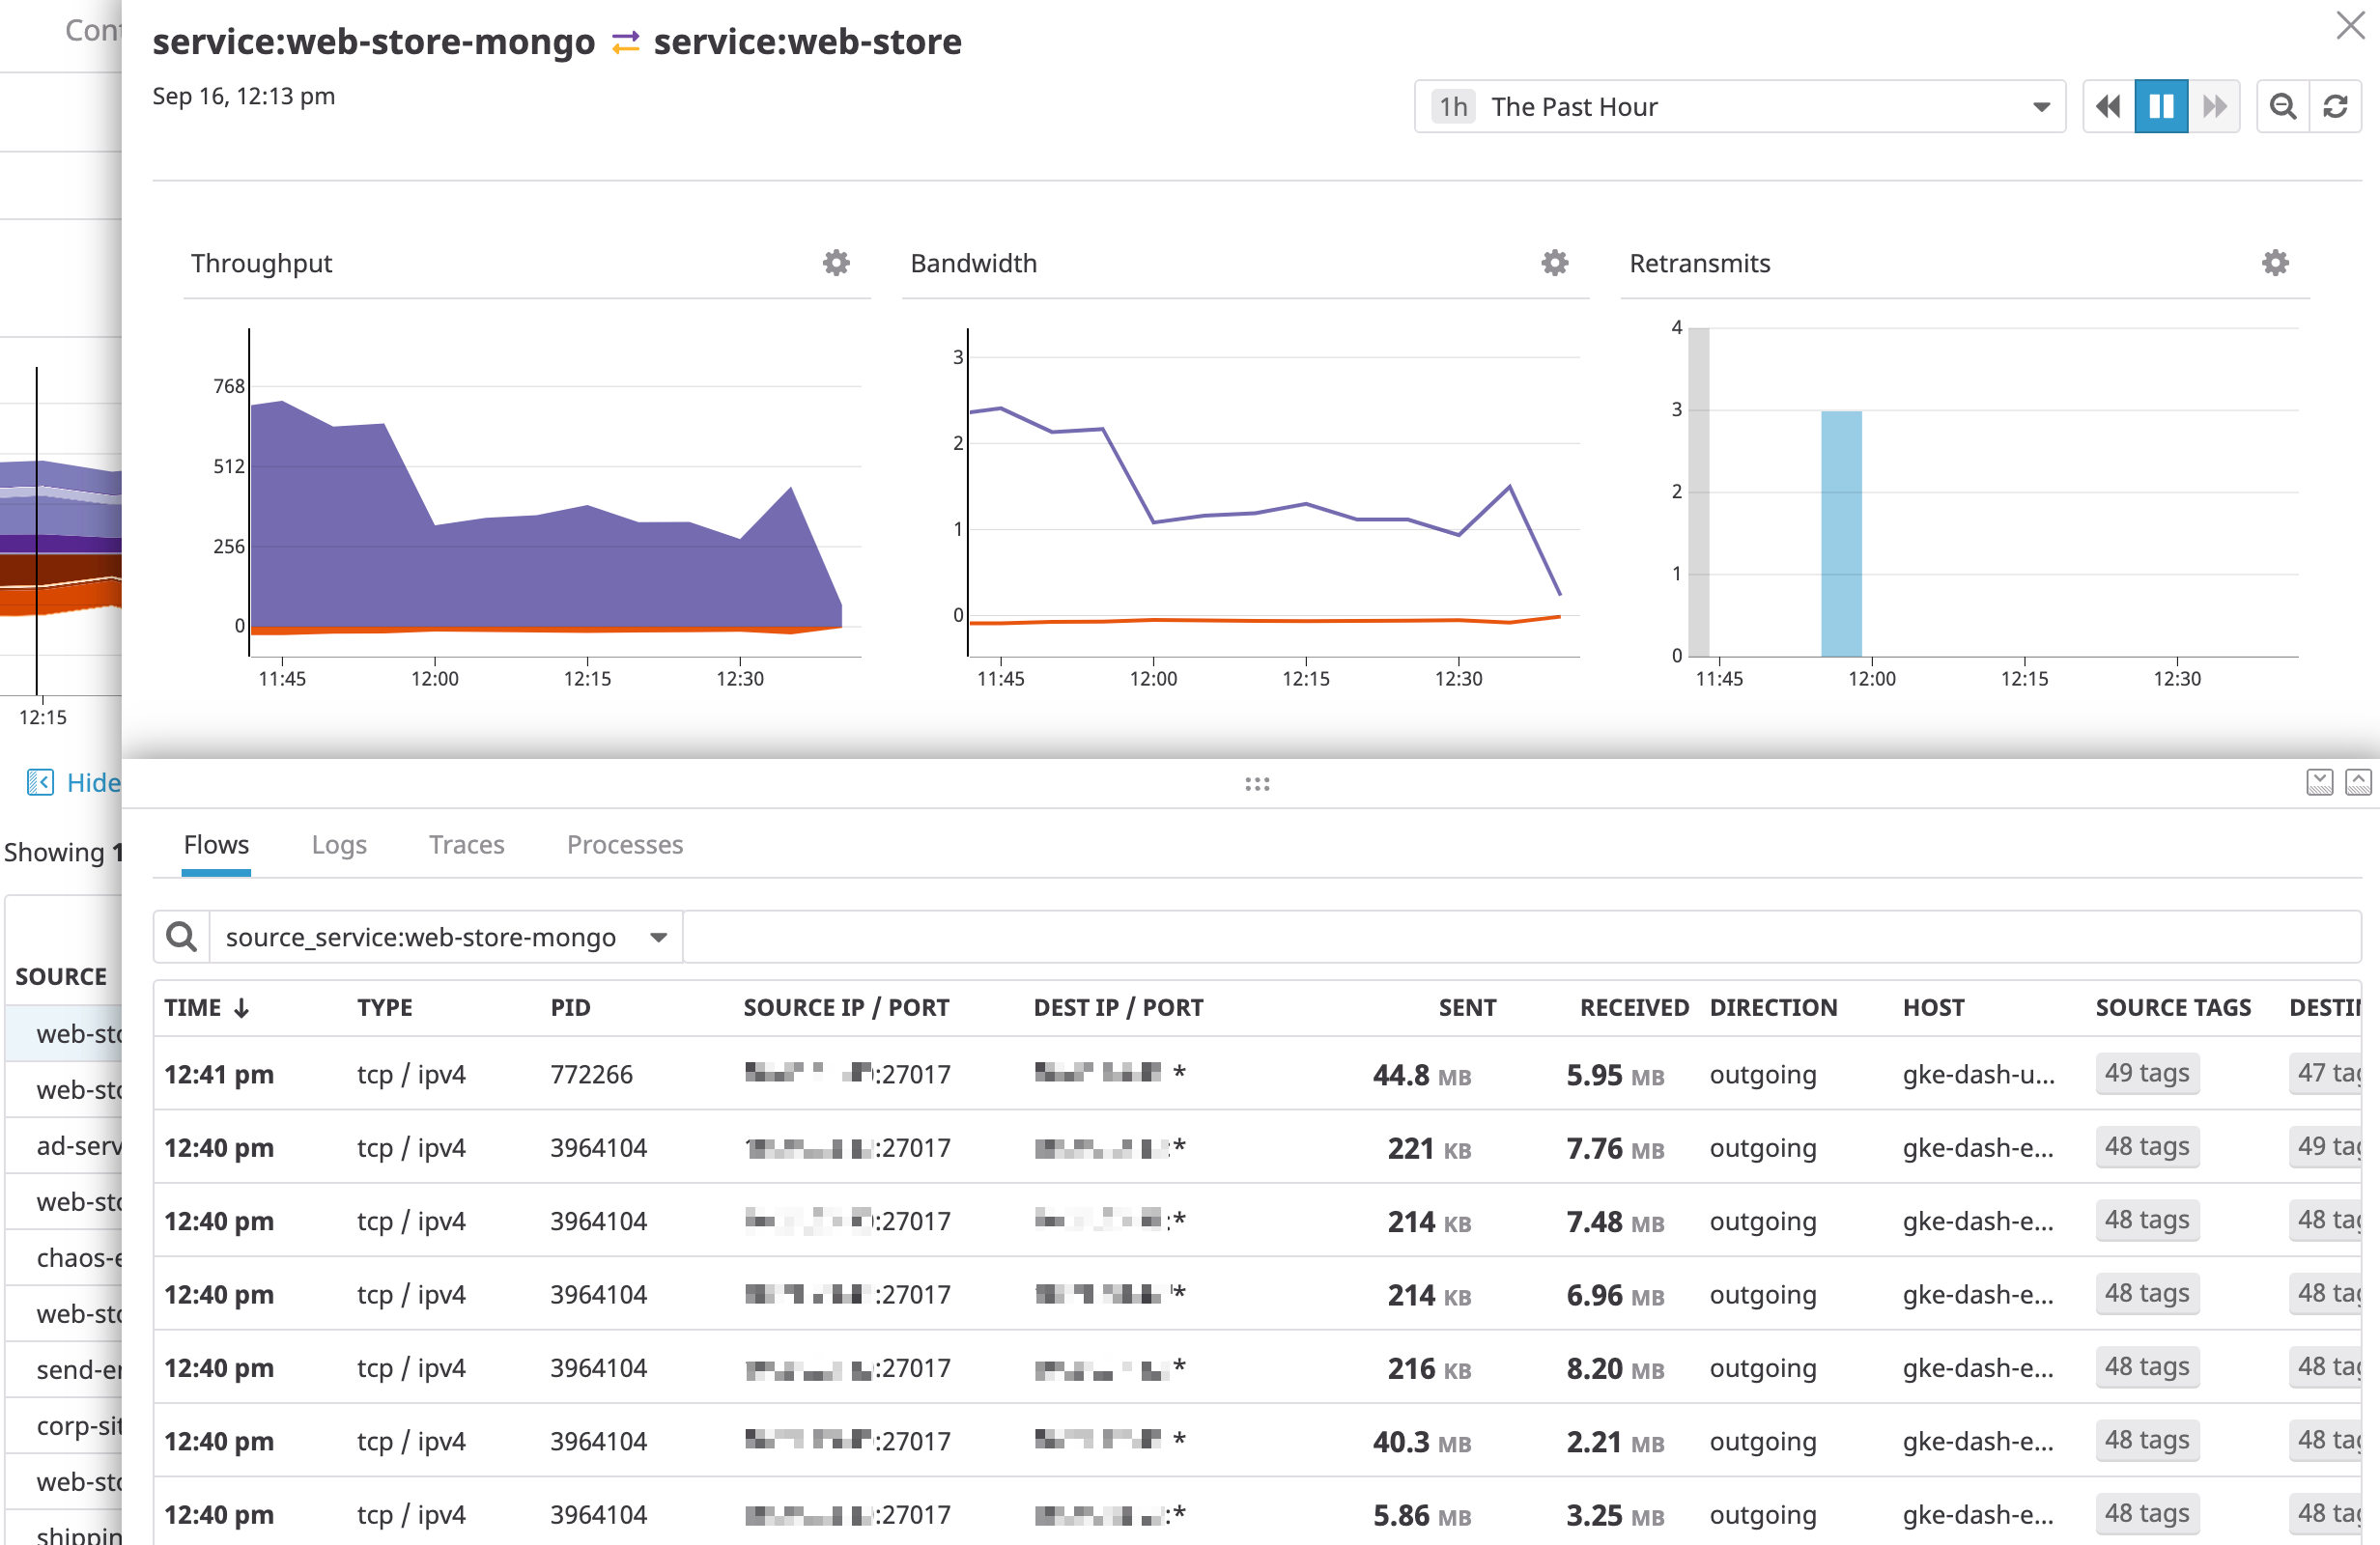
Select any row from the data table to see associated logs, traces, and processes for a given client <=> server aggregate connection:
Pivot to network path
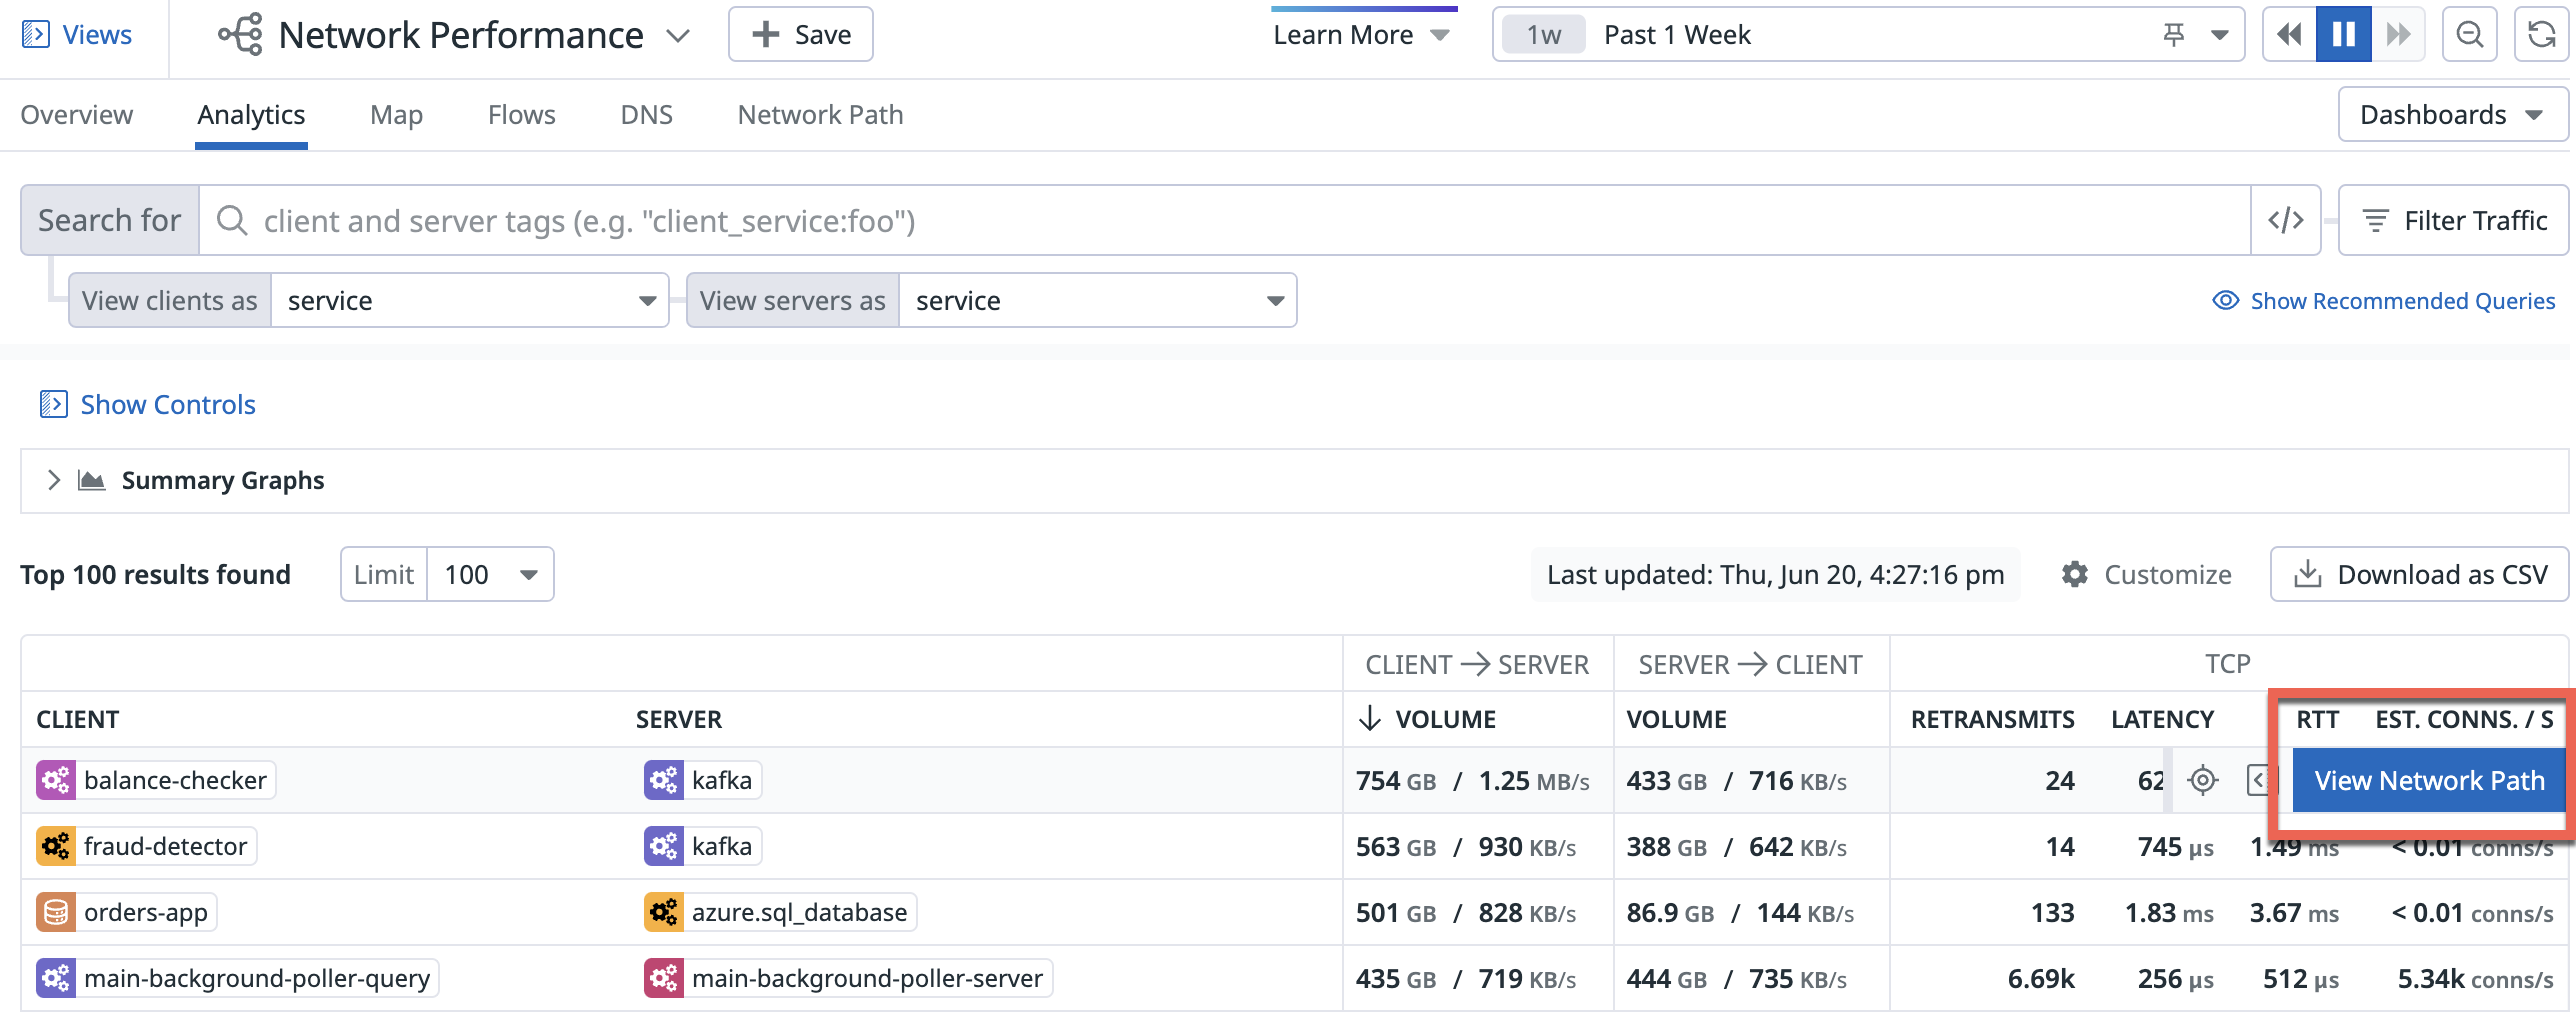
Hover over a row in the analytics table to pivot to network path and see the paths between the source and destination specified in NPM.
Sidepanel
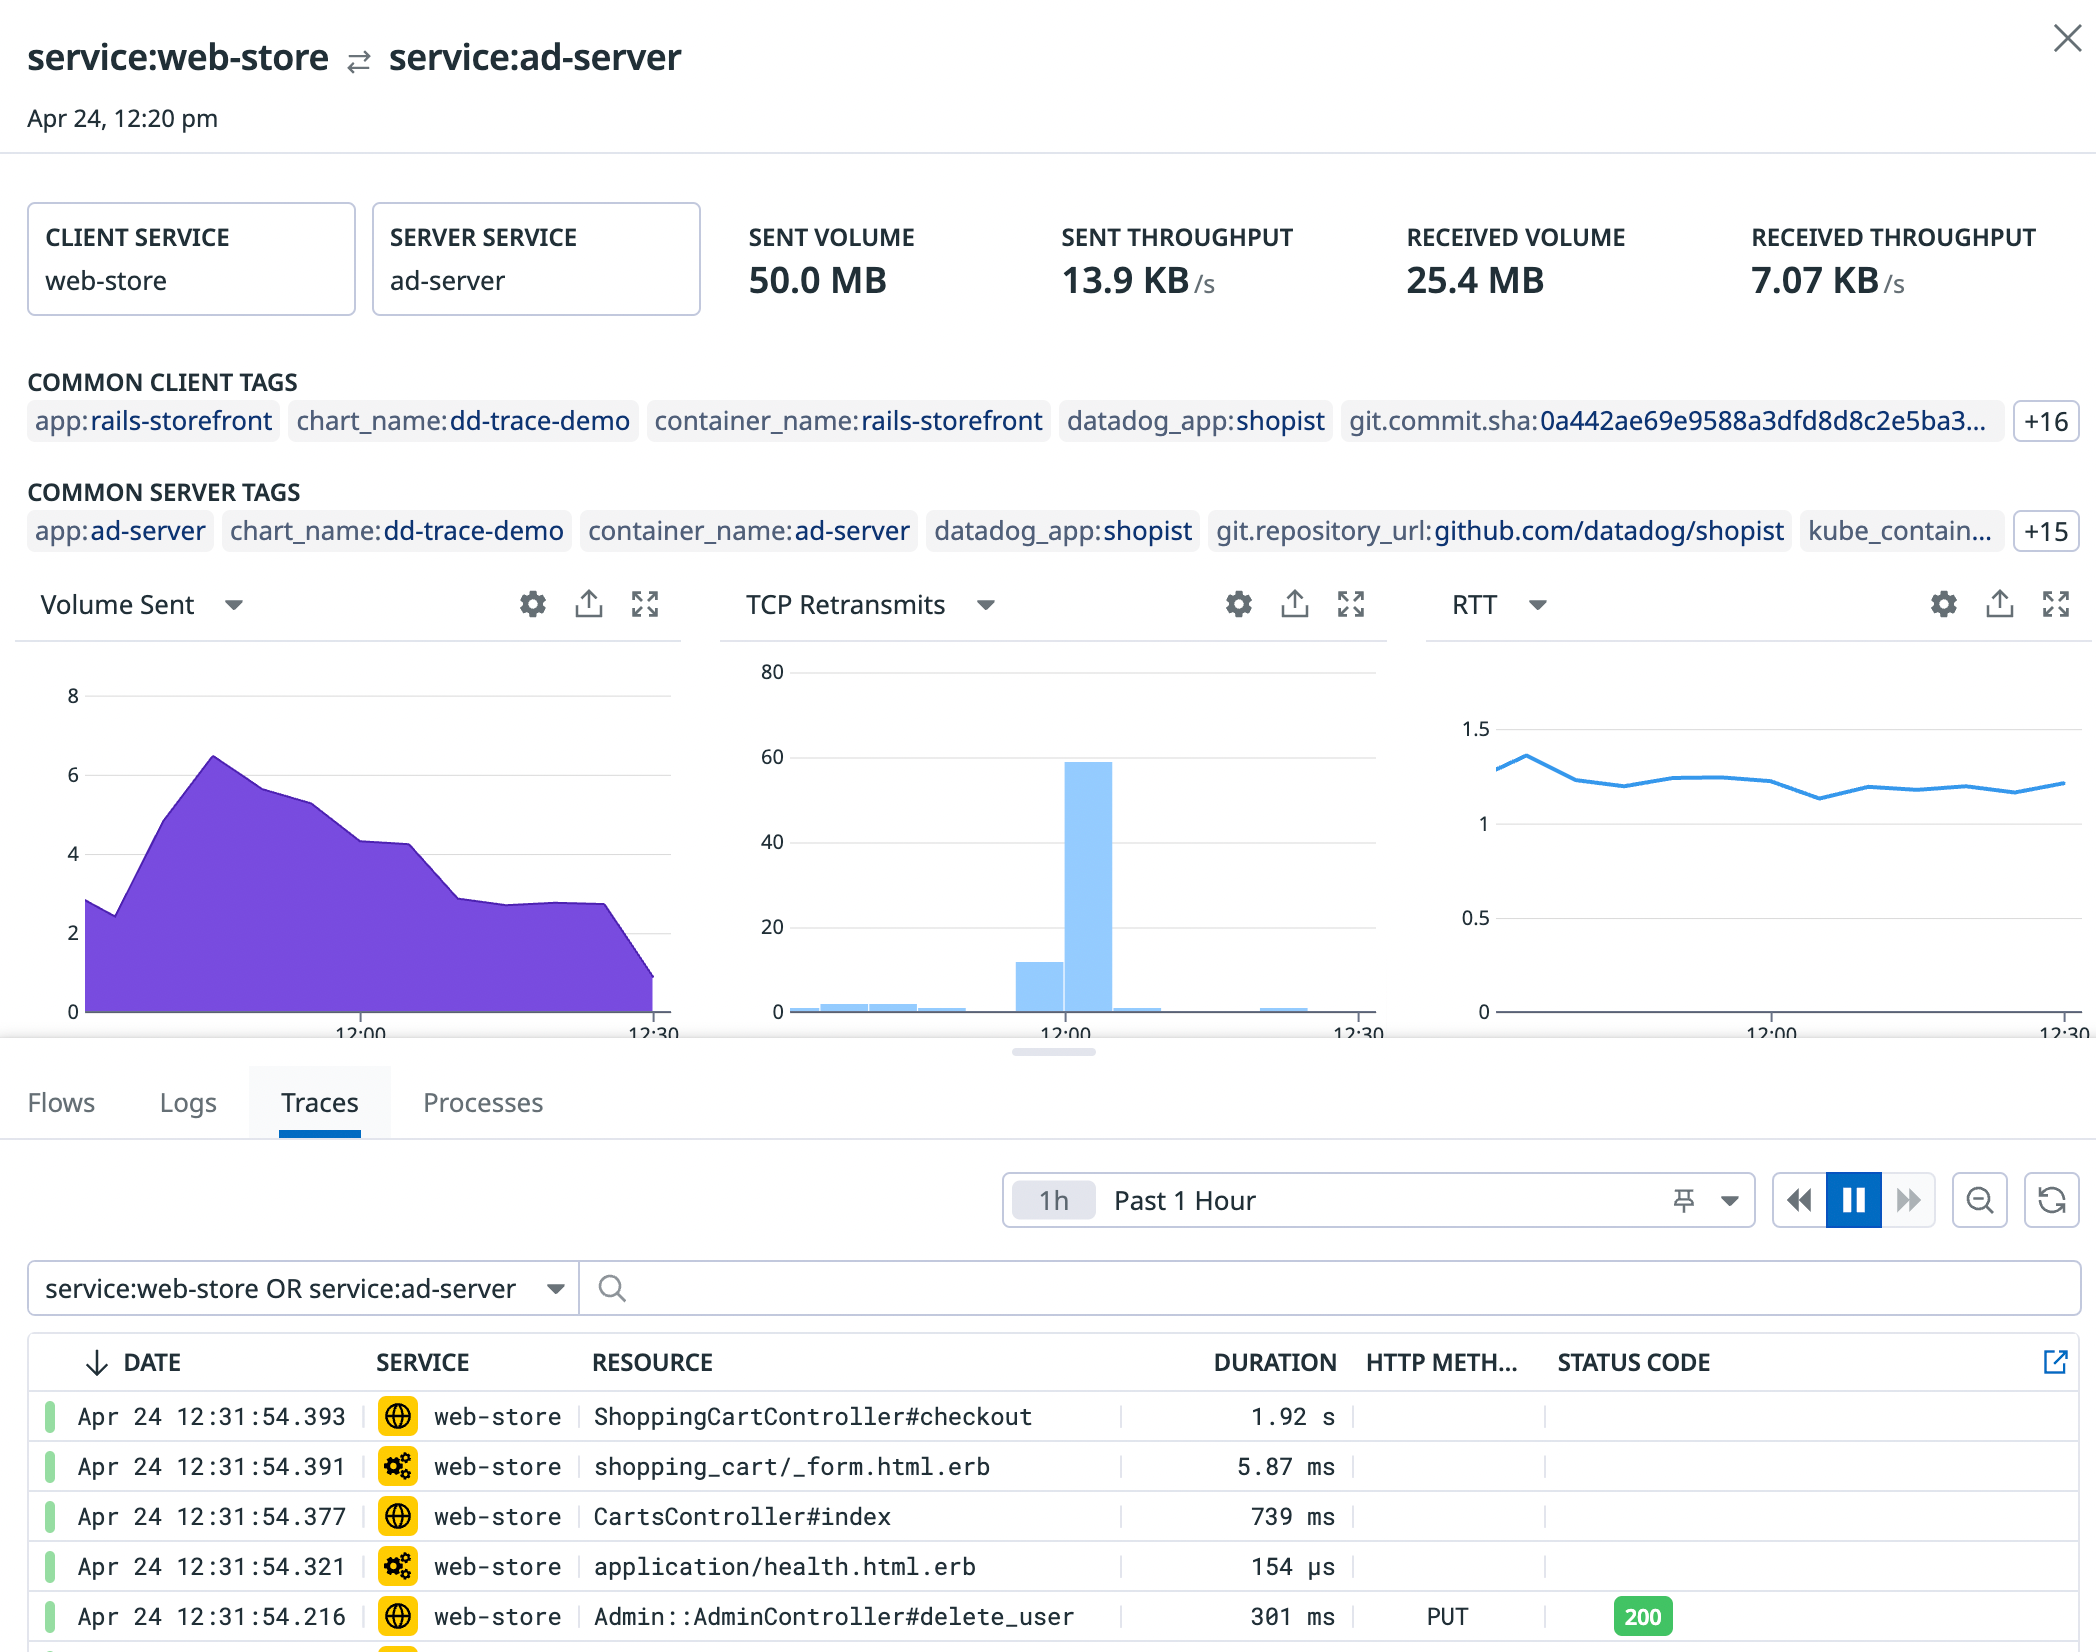
The sidepanel provides contextual telemetry to help you debug network dependencies. Use the Flows, Logs, Traces, and Processes tabs to determine whether a high retransmit count or latency in traffic between two endpoints is due to:
- A spike in traffic volume from a particular port or IP.
- Heavy processes consuming the CPU or memory of the destination endpoint.
- Application errors in the code of the client endpoint.
Common tags
The top of the sidepanel displays common client and server tags shared by the inspected dependency’s most recent connections. Use common tags to gain additional context into a faulty endpoint. For instance, when troubleshooting latent communication to a particular service, common destination tags surface the following:
- Granular context such as the container, task, or host to which traffic is flowing.
- Wider context such as the availability zone, cloud provider account, or deployment in which the service runs.
Security
The Security tab highlights potential network threats and findings detected by Cloud Security Management Threats and Cloud Security Management Misconfigurations. These signals are generated when Datadog detects network activity that matches a detection or compliance rule, or if there are other threats and misconfigurations related to the selected network flow.


