- Esenciales
- Empezando
- Datadog
- Sitio web de Datadog
- DevSecOps
- Serverless para Lambda AWS
- Agent
- Integraciones
- Contenedores
- Dashboards
- Monitores
- Logs
- Rastreo de APM
- Generador de perfiles
- Etiquetas (tags)
- API
- Catálogo de servicios
- Session Replay
- Continuous Testing
- Monitorización Synthetic
- Gestión de incidencias
- Monitorización de bases de datos
- Cloud Security Management
- Cloud SIEM
- Application Security Management
- Workflow Automation
- CI Visibility
- Test Visibility
- Intelligent Test Runner
- Análisis de código
- Centro de aprendizaje
- Compatibilidad
- Glosario
- Atributos estándar
- Guías
- Agent
- Uso básico del Agent
- Arquitectura
- IoT
- Plataformas compatibles
- Recopilación de logs
- Configuración
- Configuración remota
- Automatización de flotas
- Actualizar el Agent
- Solucionar problemas
- Detección de nombres de host en contenedores
- Modo de depuración
- Flare del Agent
- Estado del check del Agent
- Problemas de NTP
- Problemas de permisos
- Problemas de integraciones
- Problemas del sitio
- Problemas de Autodiscovery
- Problemas de contenedores de Windows
- Configuración del tiempo de ejecución del Agent
- Consumo elevado de memoria o CPU
- Guías
- Seguridad de datos
- Integraciones
- OpenTelemetry
- Desarrolladores
- Autorización
- DogStatsD
- Checks personalizados
- Integraciones
- Crear una integración basada en el Agent
- Crear una integración API
- Crear un pipeline de logs
- Referencia de activos de integración
- Crear una oferta de mercado
- Crear un cuadro
- Crear un dashboard de integración
- Crear un monitor recomendado
- Crear una regla de detección Cloud SIEM
- OAuth para integraciones
- Instalar la herramienta de desarrollo de integraciones del Agente
- Checks de servicio
- Complementos de IDE
- Comunidad
- Guías
- API
- Aplicación móvil de Datadog
- CoScreen
- Cloudcraft
- En la aplicación
- Dashboards
- Notebooks
- Editor DDSQL
- Hojas
- Monitores y alertas
- Infraestructura
- Métricas
- Watchdog
- Bits AI
- Catálogo de servicios
- Catálogo de APIs
- Error Tracking
- Gestión de servicios
- Objetivos de nivel de servicio (SLOs)
- Gestión de incidentes
- De guardia
- Gestión de eventos
- Gestión de casos
- Workflow Automation
- App Builder
- Infraestructura
- Universal Service Monitoring
- Contenedores
- Serverless
- Monitorización de red
- Coste de la nube
- Rendimiento de las aplicaciones
- APM
- Términos y conceptos de APM
- Instrumentación de aplicación
- Recopilación de métricas de APM
- Configuración de pipelines de trazas
- Correlacionar trazas (traces) y otros datos de telemetría
- Trace Explorer
- Observabilidad del servicio
- Instrumentación dinámica
- Error Tracking
- Seguridad de los datos
- Guías
- Solucionar problemas
- Continuous Profiler
- Database Monitoring
- Gastos generales de integración del Agent
- Arquitecturas de configuración
- Configuración de Postgres
- Configuración de MySQL
- Configuración de SQL Server
- Configuración de Oracle
- Configuración de MongoDB
- Conexión de DBM y trazas
- Datos recopilados
- Explorar hosts de bases de datos
- Explorar métricas de consultas
- Explorar ejemplos de consulta
- Solucionar problemas
- Guías
- Data Streams Monitoring
- Data Jobs Monitoring
- Experiencia digital
- Real User Monitoring
- Monitorización del navegador
- Configuración
- Configuración avanzada
- Datos recopilados
- Monitorización del rendimiento de páginas
- Monitorización de signos vitales de rendimiento
- Monitorización del rendimiento de recursos
- Recopilación de errores del navegador
- Rastrear las acciones de los usuarios
- Señales de frustración
- Error Tracking
- Solucionar problemas
- Monitorización de móviles y TV
- Plataforma
- Session Replay
- Exploración de datos de RUM
- Feature Flag Tracking
- Error Tracking
- Guías
- Seguridad de los datos
- Monitorización del navegador
- Análisis de productos
- Pruebas y monitorización de Synthetics
- Continuous Testing
- Entrega de software
- CI Visibility
- CD Visibility
- Test Visibility
- Configuración
- Tests en contenedores
- Búsqueda y gestión
- Explorador
- Monitores
- Flujos de trabajo de desarrolladores
- Cobertura de código
- Instrumentar tests de navegador con RUM
- Instrumentar tests de Swift con RUM
- Detección temprana de defectos
- Reintentos automáticos de tests
- Correlacionar logs y tests
- Guías
- Solucionar problemas
- Intelligent Test Runner
- Code Analysis
- Quality Gates
- Métricas de DORA
- Seguridad
- Información general de seguridad
- Cloud SIEM
- Cloud Security Management
- Application Security Management
- Observabilidad de la IA
- Log Management
- Observability Pipelines
- Gestión de logs
- Administración
- Gestión de cuentas
- Seguridad de los datos
- Sensitive Data Scanner
- Ayuda
(LEGACY) Deployment Design and Principles
This page is not yet available in Spanish. We are working on its translation.
If you have any questions or feedback about our current translation project, feel free to reach out to us!
If you have any questions or feedback about our current translation project, feel free to reach out to us!
Observability Pipelines is not available on the US1-FED Datadog site.
If you upgrade your OP Workers version 1.8 or below to version 2.0 or above, your existing pipelines will break. Do not upgrade your OP Workers if you want to continue using OP Workers version 1.8 or below. If you want to use OP Worker 2.0 or above, you must migrate your OP Worker 1.8 or earlier pipelines to OP Worker 2.x.
Datadog recommends that you update to OP Worker versions 2.0 or above. Upgrading to a major OP Worker version and keeping it updated is the only supported way to get the latest OP Worker functionality, fixes, and security updates.
Datadog recommends that you update to OP Worker versions 2.0 or above. Upgrading to a major OP Worker version and keeping it updated is the only supported way to get the latest OP Worker functionality, fixes, and security updates.
Overview
When you start deploying Observability Pipelines Worker into your infrastructure, you may run into questions such as:
- Where should the Observability Pipelines Worker be deployed within the network?
- How should the data be collected?
- Where should the data be processed?
This guide walks you through what to consider when designing your Observability Pipelines Worker architecture, specifically these topics:
Networking
The first step to architecting your Observability Pipelines Worker deployment is understanding where Observability Pipelines Worker fits within your network and where to deploy it.
Working with network boundaries
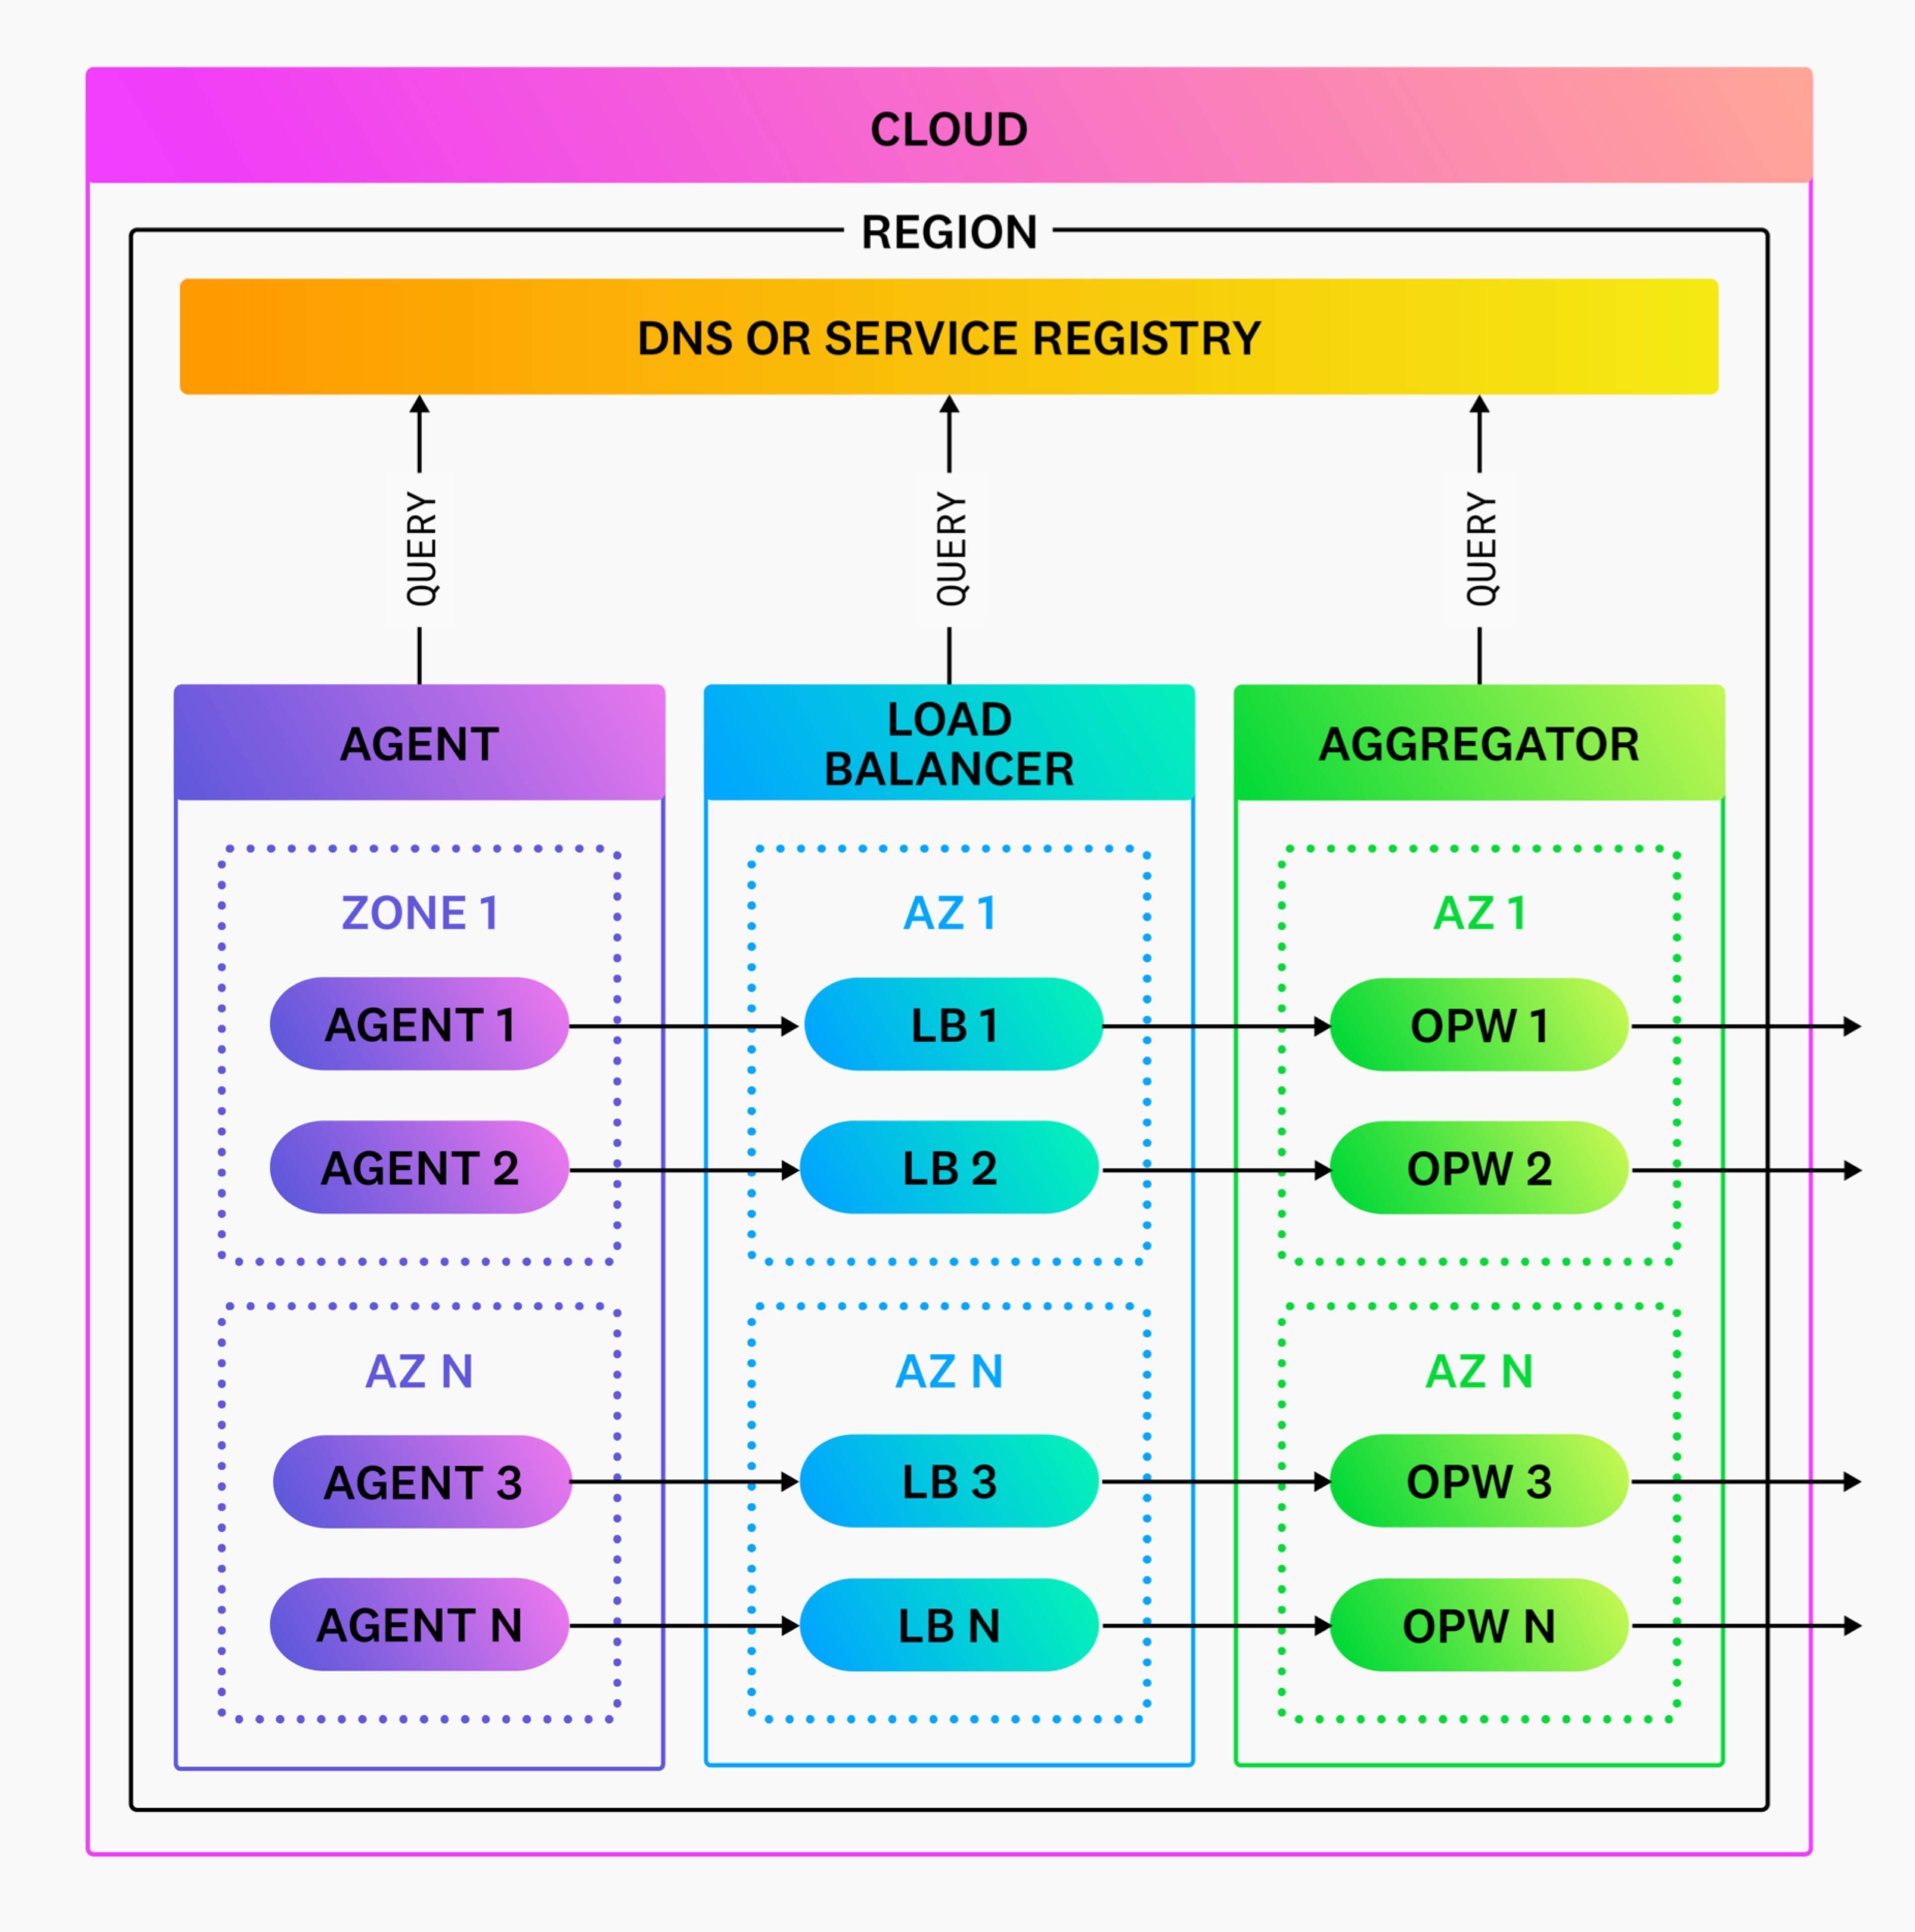
Because Observability Pipelines Worker is deployed as an aggregrator, it should be deployed within your network boundaries to minimize egress costs. Ingress into the Observability Pipelines Worker should never travel over the public internet. Therefore, Datadog recommends starting with one aggregator per region to keep things simple.
Using firewalls and proxies
When using firewalls, restrict agent communication to your aggregators and restrict aggregator communication to your configured sources and sinks.
If you prefer to use a HTTP proxy, Observability Pipelines Worker offers a global proxy option to route all Observability Pipelines Worker HTTP traffic through a proxy.
Using DNS and service discovery
Discovery of your Observability Pipelines Worker aggregators and services should resolve through DNS or service discovery. This strategy facilitates routing and load balancing of your traffic, and is how your agents and load balancers discover your aggregators. For proper separation of concerns, the Observability Pipelines Worker does not resolve DNS queries and, instead, delegates this to a system-level resolver (for example, Linux resolving).
Choosing protocols
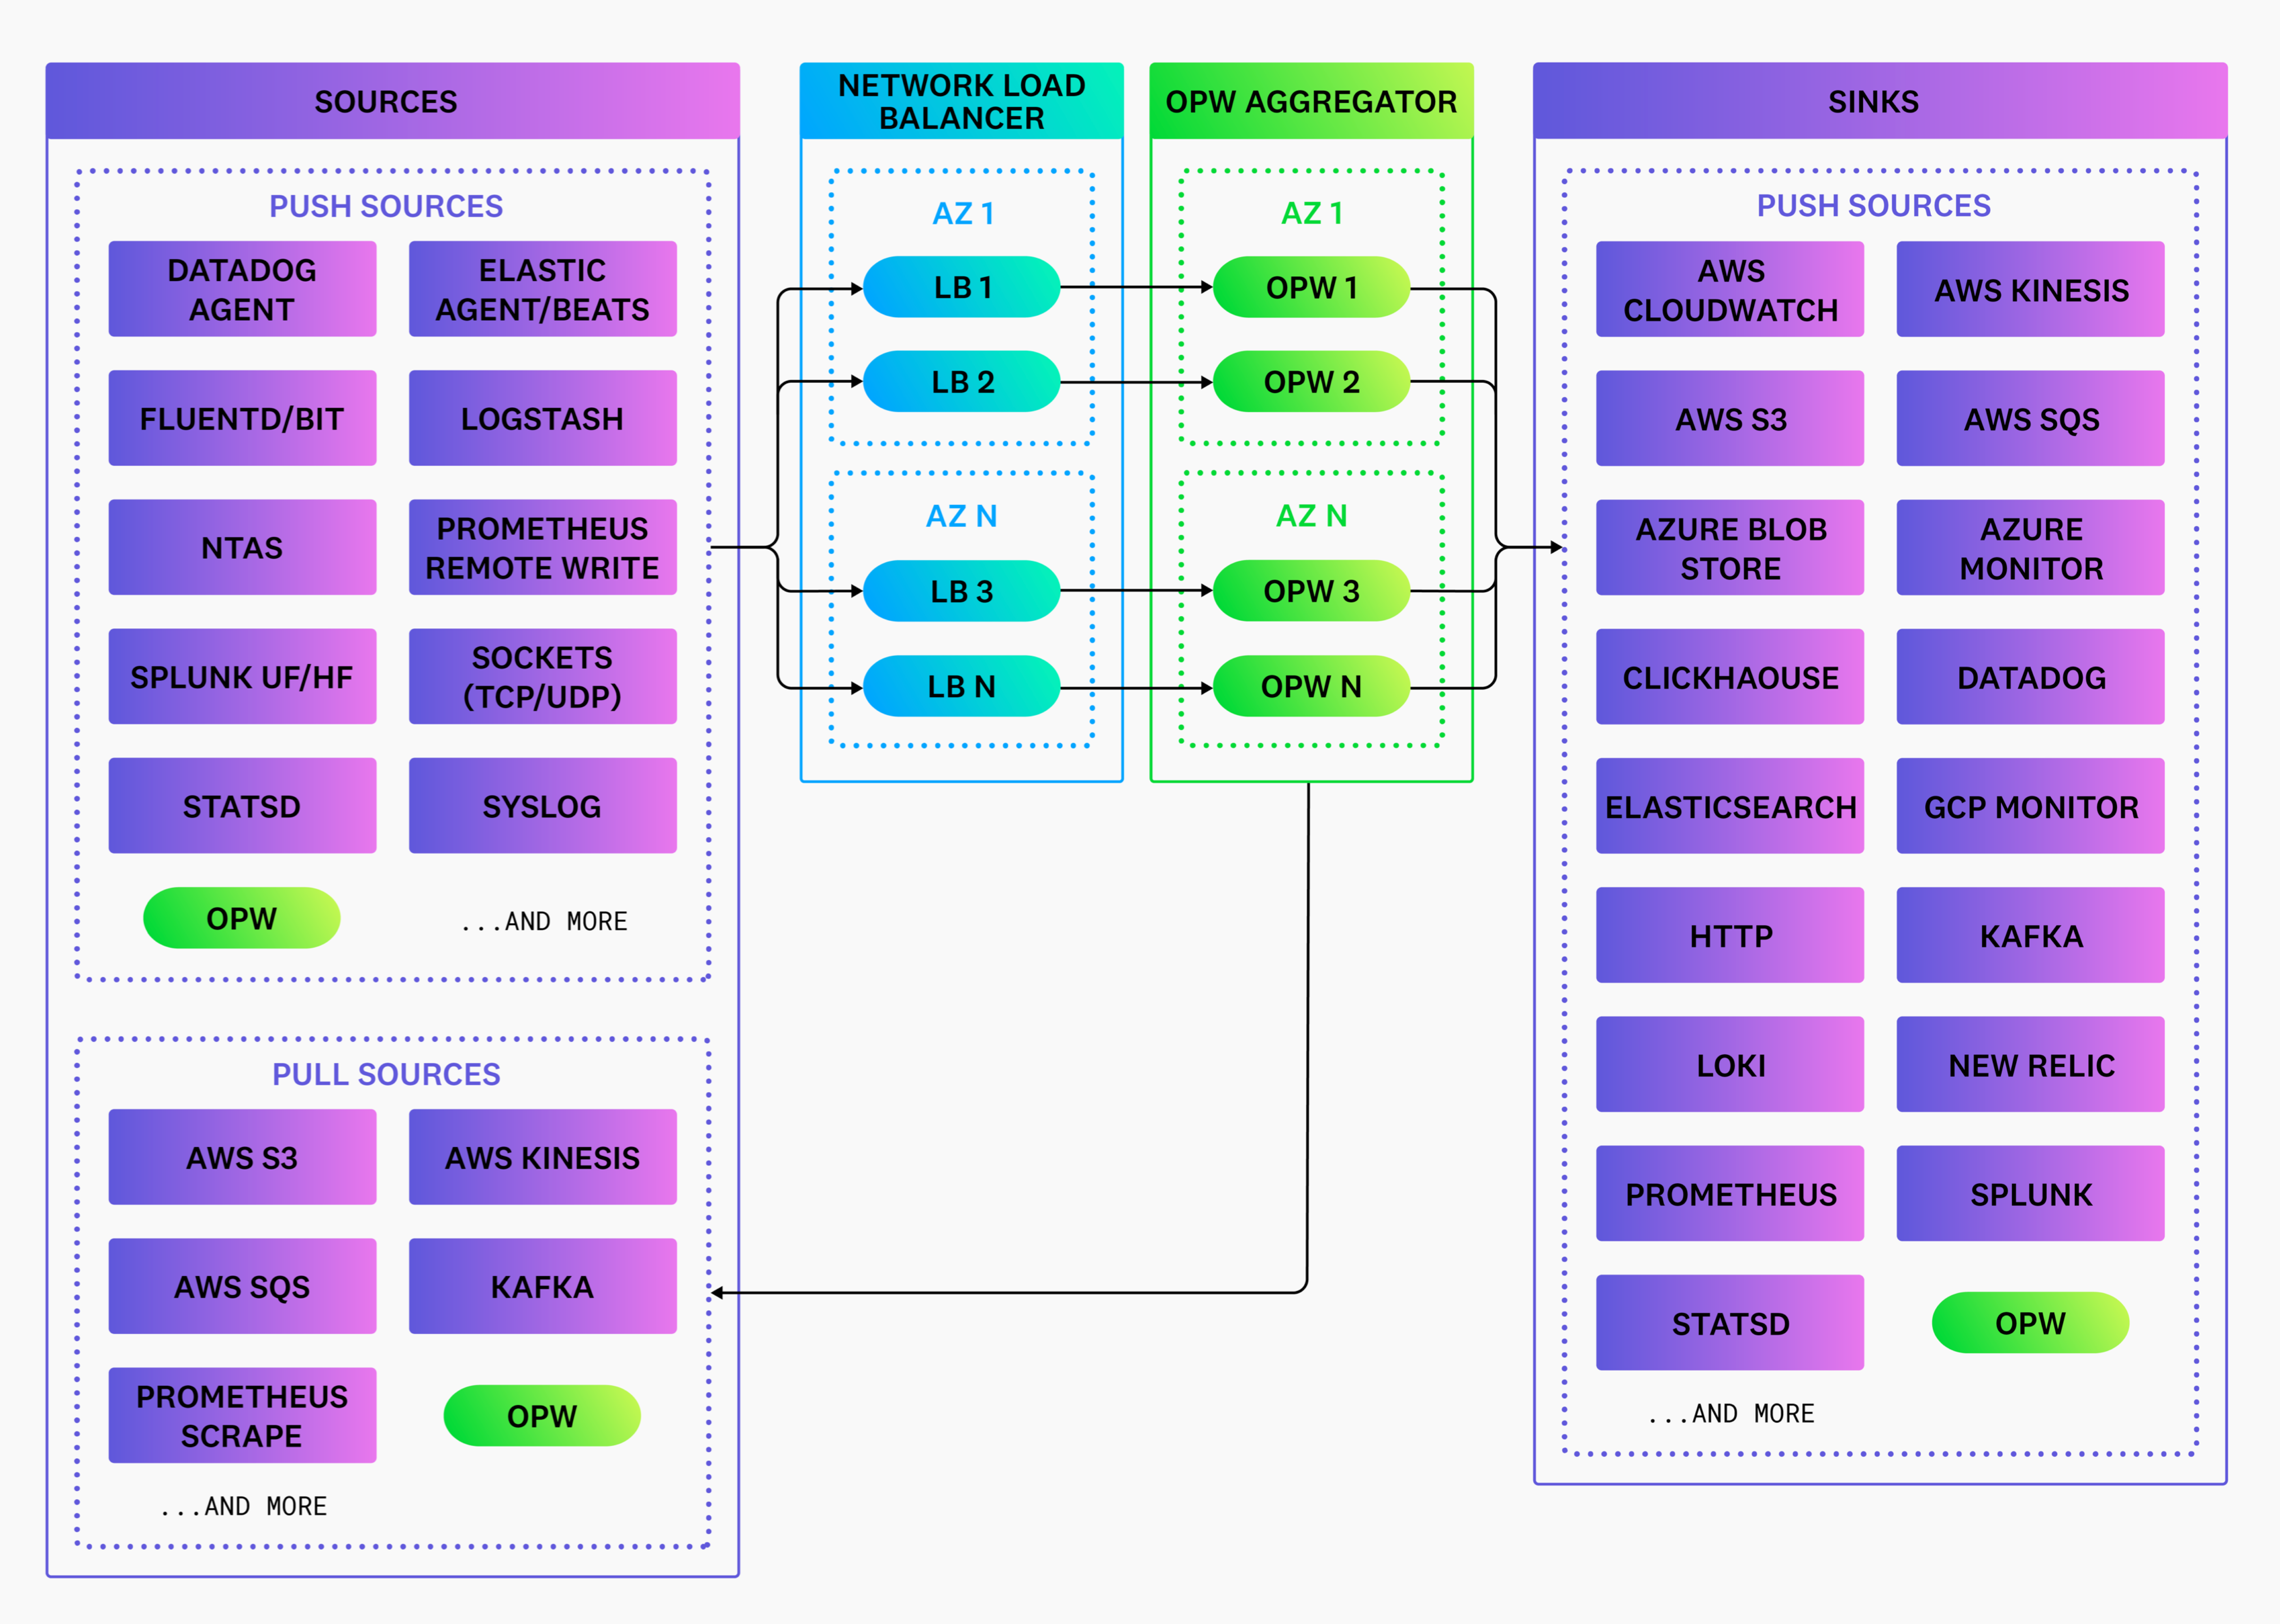
When sending data to the Observability Pipelines Worker, Datadog recommends choosing a protocol that allows easy load-balancing and application-level delivery acknowledgment. HTTP and gRPC are preferred due to their ubiquitous nature and the amount of available tools and documentation to help operate HTTP/gRPC-based services effectively and efficiently.
Choose the source that aligns with your protocol. Each Observability Pipelines Worker source implements different protocols. For example, Observability Pipelines Worker sources and sinks use gRPC for inter-Observability Pipelines Worker communication, and the HTTP source allows you to receive data over HTTP. See Sources for their respective protocols.
Collecting data
Your pipeline begins with data collection. Your services and systems generate data* that can be collected and sent downstream to your destinations. Data collection is achieved with agents, and understanding which agents to use ensures you are collecting the data you want.
Choosing agents
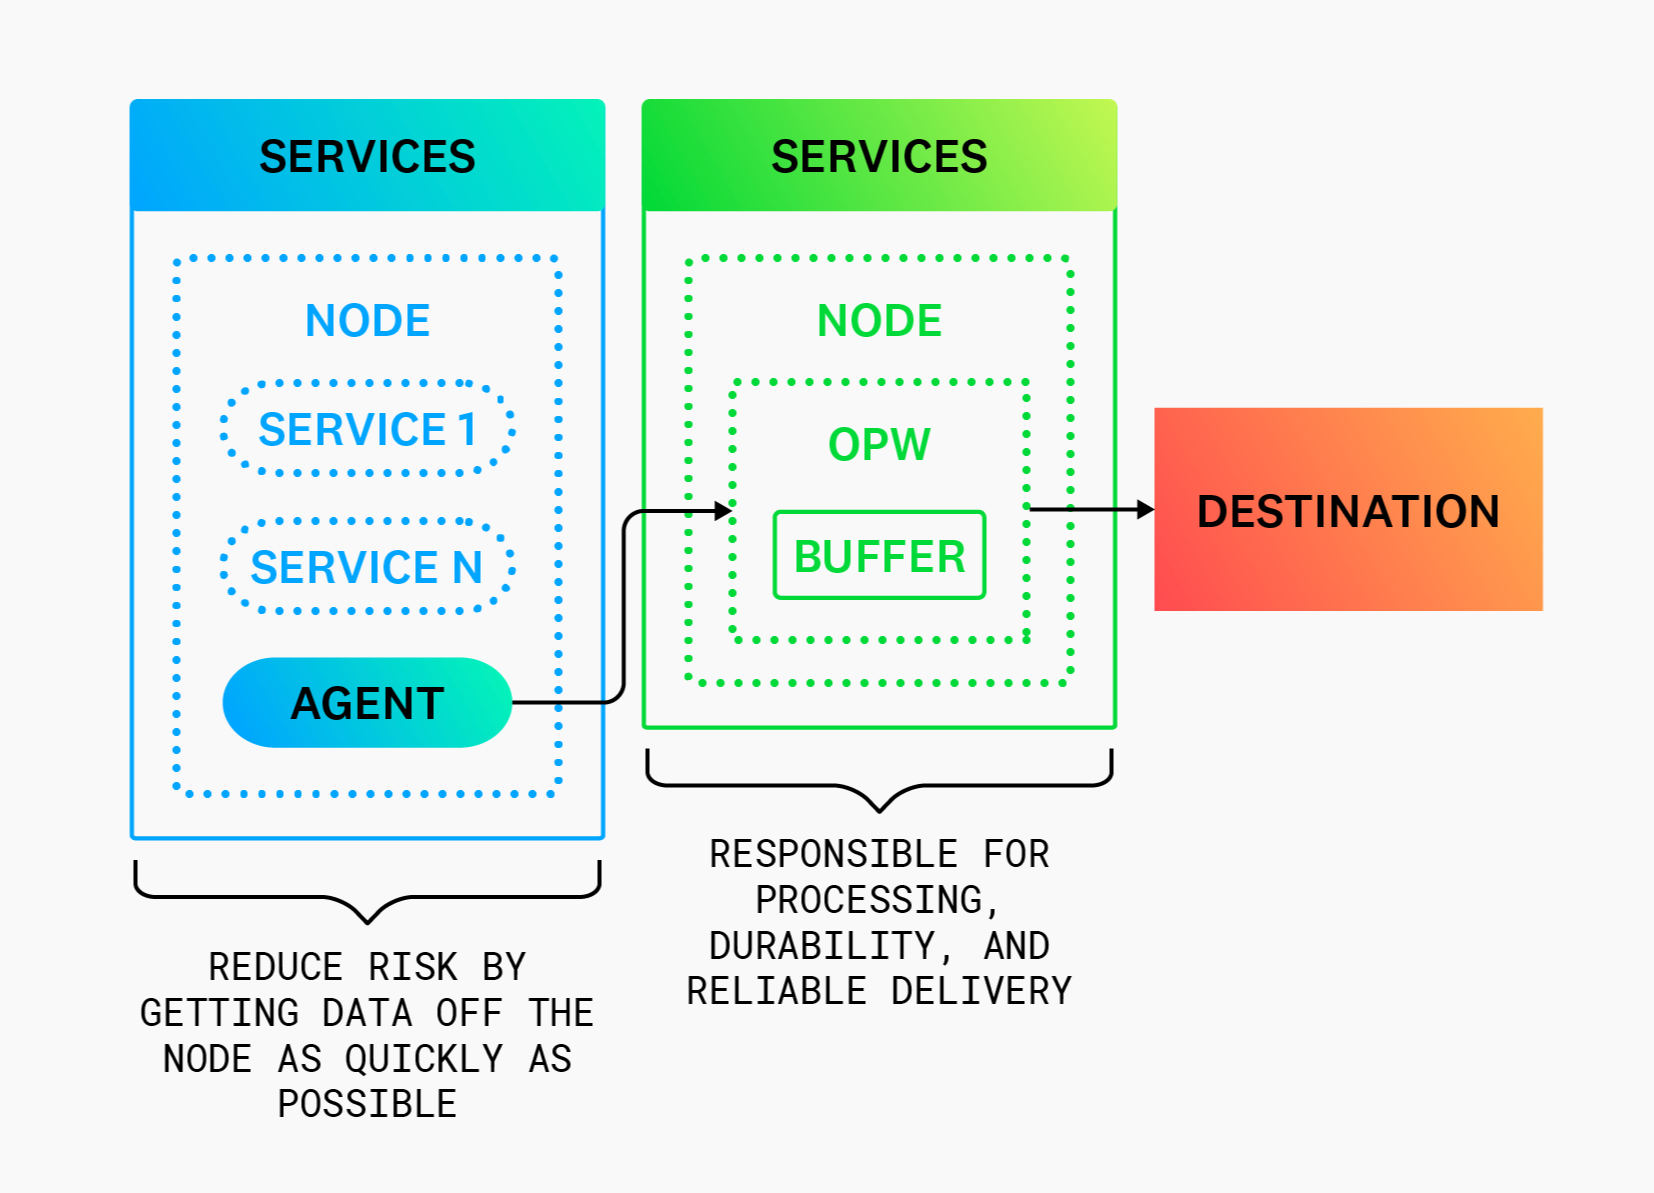
You should choose the agent that optimizes your engineering team’s ability to monitor their systems. Therefore, integrate Observability Pipelines Worker with the best agent for the job and deploy the Observability Pipelines Worker on separate nodes as an aggregator.
For example, Datadog Network Performance Monitoring integrates the Datadog Agent with vendor-specific systems and produces vendor-specific data. Therefore, the Datadog Agent should collect the data and send it directly to Datadog, since the data is not a supported data type in the Observability Pipelines Worker.
As another example, the Datadog Agent collects service metrics and enriches them with vendor-specific Datadog tags. In this case, the Datadog Agent should send the metrics directly to Datadog or route them through the Observability Pipelines Worker. The Observability Pipelines Worker should not replace the Datadog Agent because the data being produced is enriched in a vendor-specific way.
When you integrate with an agent, configure the Observability Pipelines Worker to receive data directly from the agent over the local network, routing data through the Observability Pipelines Worker. Use source components such as the datadog_agent or open_telemetry to receive data from your agents.
Reducing agent risk
When integrating with an agent, configure the agent to be a simple data forwarder and route supported data types through the Observability Pipelines Worker. This reduces the risk of data loss and service disruption by minimizing the agent’s responsibilities.
Processing data
If you want to design an efficient pipeline between your Observability Pipelines Worker’s sources and sinks, it helps to understand which types of data to process and where to process it.
Choosing which data to process
You can use Observability Pipelines Worker to process data*. However, real-time, vendor-specific data, such as continuous profiling data, is not interoperable and typically does not benefit from processing.
Remote processing
For remote processing, the Observability Pipelines Worker can be deployed on separate nodes as an aggregator.
Data processing is shifted off your nodes and onto remote aggregator nodes. Remote processing is recommended for environments that require high durability and high availability (most environments). In addition, this is easier to set up since it does not require the infrastructure restructuring necessary when adding an agent.
See Aggregator Architecture for more details.
Buffering data
Where and how you buffer your data can also affect the efficiency of your pipeline.
Choosing where to buffer data
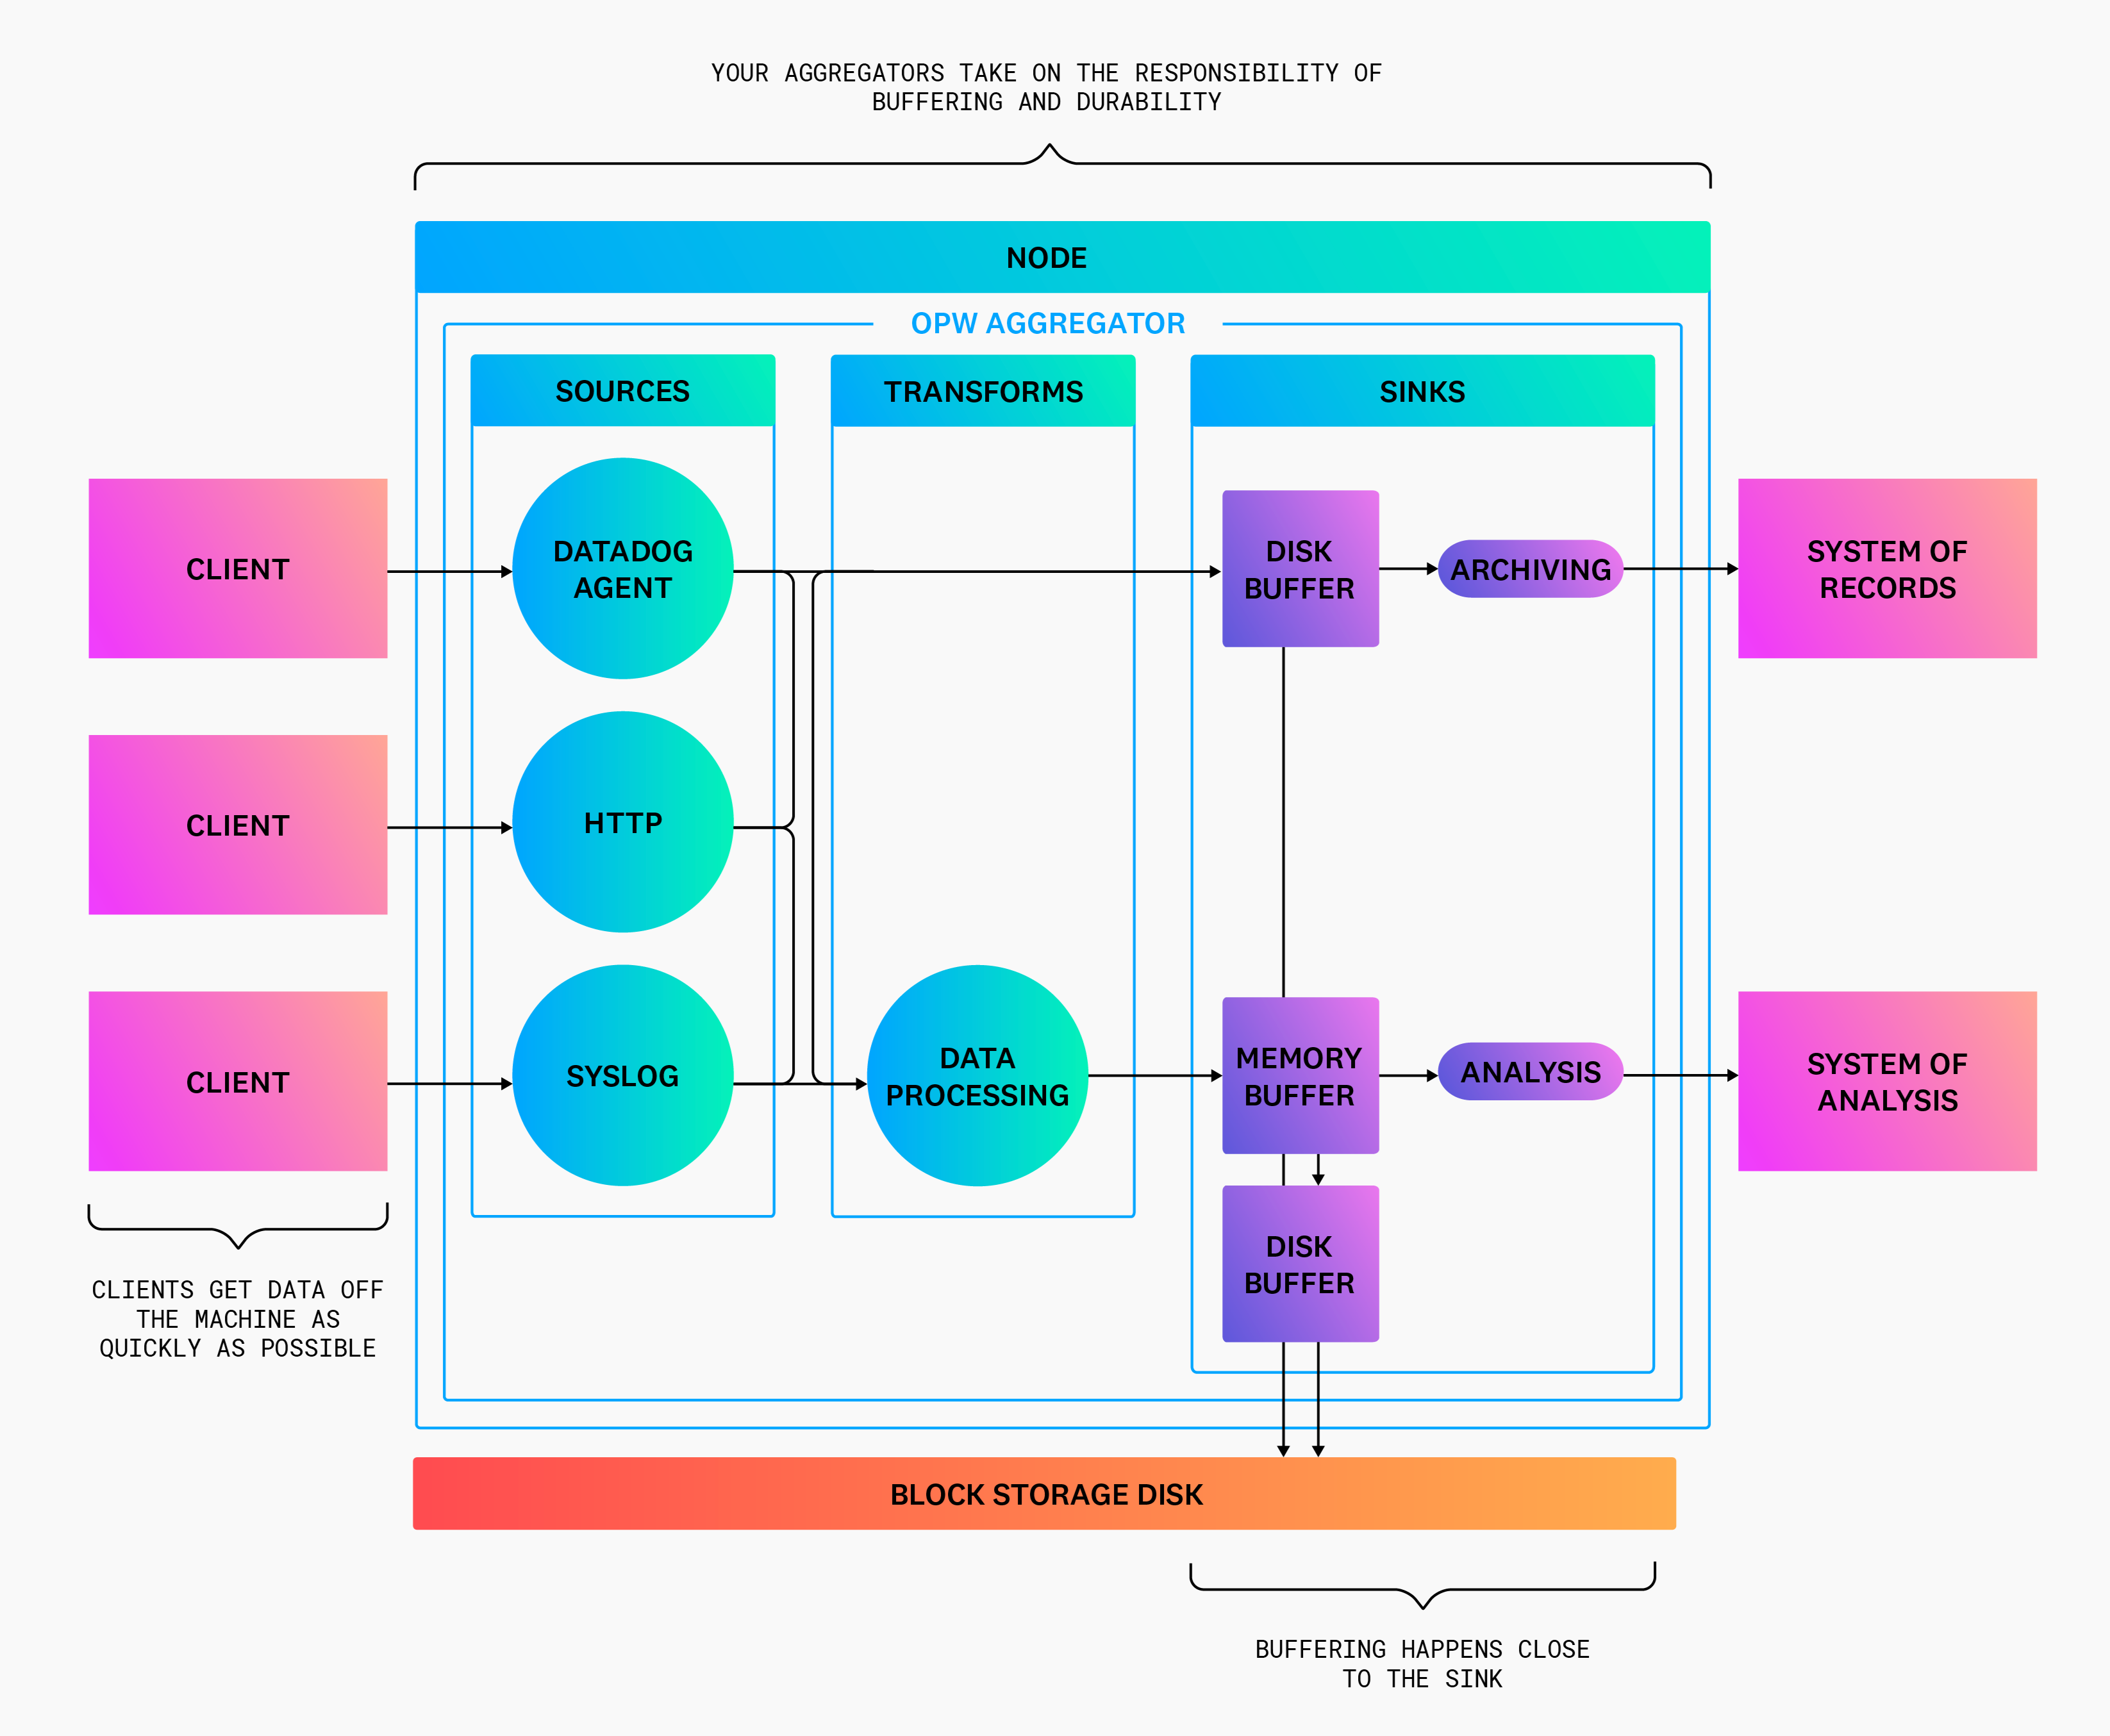
Buffering should happen close to your destinations, and each destination should have its own isolated buffer, which offers the following benefits:
- Each destination can configure its buffer to meet the sink’s requirements. See Choosing how to buffer data for more details.
- Isolating buffers for each destination prevents one misbehaving destination from halting the entire pipeline until the buffer reaches the configured capacity.
For these reasons, the Observability Pipelines Worker couples buffers with its sinks.
Choosing how to buffer data
Observability Pipelines Worker’s built-in buffers simplify operation and eliminate the need for complex external buffers.
When choosing an Observability Pipelines Worker buffer type, select the type that is optimal for the destination’s purpose. For example, your system of record should use disk buffers for high durability, and your system of analysis should use memory buffers for low latency. Additionally, both buffers can overflow to another buffer to prevent back pressure from propagating to your clients.
Routing data
Routing data, so that your aggregators send data to the proper destination, is the final piece in your pipeline design. Use aggregators to route data flexibly to the best system for your team(s).
Separating systems of record and analysis
Separate your system of record from your system of analysis to optimize cost without making trade-offs that affect their purpose. For example, your system of record can batch large amounts of data over time and compress it to minimize cost while ensuring high durability for all data. And your system of analysis can sample and clean data to reduce cost while keeping latency low for real-time analysis.
Routing to your systems of record (Archiving)
Optimize your system of record for durability while minimizing costs by doing the following:
- Only write to your archive from the aggregator role to reduce data loss due to node restarts and software failures.
- Front the sink with a disk buffer.
- Enable end-to-end acknowledgments on all sources.
- Set
batch.max_bytesto ≥ 5MiB,batch.timeout_secsto ≥ 5 minutes, and enable compression (the default for archiving sinks, such as theaws_s3sink). - Archive raw, unprocessed data to allow for data replay and reduce the risk of accidental data corruption during processing.
Routing to your system of analysis
Optimize your system of analysis for analysis while reducing costs by doing the following:
- Front the sink with a memory buffer.
- Set
batch.timeout_secto ≤ 5 seconds (the default for analytical sinks, such asdatadog_logs). - Use the
remaptransform to remove attributes not used for analysis. - Filter events not used for analysis
- Consider sampling logs with
levelinfoor lower to reduce their volume
* Observability Pipelines support logs. Support for metrics is in beta.


