- Principales informations
- Getting Started
- Datadog
- Site Datadog
- DevSecOps
- Serverless for AWS Lambda
- Agent
- Intégrations
- Conteneurs
- Dashboards
- Monitors
- Logs
- Tracing
- Profileur
- Tags
- API
- Service Catalog
- Session Replay
- Continuous Testing
- Surveillance Synthetic
- Incident Management
- Database Monitoring
- Cloud Security Management
- Cloud SIEM
- Application Security Management
- Workflow Automation
- CI Visibility
- Test Visibility
- Intelligent Test Runner
- Code Analysis
- Learning Center
- Support
- Glossary
- Standard Attributes
- Guides
- Agent
- Intégrations
- OpenTelemetry
- Développeurs
- Authorization
- DogStatsD
- Checks custom
- Intégrations
- Create an Agent-based Integration
- Create an API Integration
- Create a Log Pipeline
- Integration Assets Reference
- Build a Marketplace Offering
- Create a Tile
- Create an Integration Dashboard
- Create a Recommended Monitor
- Create a Cloud SIEM Detection Rule
- OAuth for Integrations
- Install Agent Integration Developer Tool
- Checks de service
- IDE Plugins
- Communauté
- Guides
- API
- Application mobile
- CoScreen
- Cloudcraft
- In The App
- Dashboards
- Notebooks
- DDSQL Editor
- Alertes
- Infrastructure
- Métriques
- Watchdog
- Bits AI
- Service Catalog
- API Catalog
- Error Tracking
- Service Management
- Infrastructure
- Universal Service Monitoring
- Conteneurs
- Sans serveur
- Surveillance réseau
- Cloud Cost
- Application Performance
- APM
- Profileur en continu
- Database Monitoring
- Agent Integration Overhead
- Setup Architectures
- Configuration de Postgres
- Configuration de MySQL
- Configuration de SQL Server
- Setting Up Oracle
- Setting Up MongoDB
- Connecting DBM and Traces
- Données collectées
- Exploring Database Hosts
- Explorer les métriques de requête
- Explorer des échantillons de requêtes
- Dépannage
- Guides
- Data Streams Monitoring
- Data Jobs Monitoring
- Digital Experience
- RUM et Session Replay
- Product Analytics
- Surveillance Synthetic
- Continuous Testing
- Software Delivery
- CI Visibility
- CD Visibility
- Test Visibility
- Exécuteur de tests intelligent
- Code Analysis
- Quality Gates
- DORA Metrics
- Securité
- Security Overview
- Cloud SIEM
- Cloud Security Management
- Application Security Management
- AI Observability
- Log Management
- Pipelines d'observabilité
- Log Management
- Administration
Schema Tracking
Cette page n'est pas encore disponible en français, sa traduction est en cours.
Si vous avez des questions ou des retours sur notre projet de traduction actuel, n'hésitez pas à nous contacter.
Si vous avez des questions ou des retours sur notre projet de traduction actuel, n'hésitez pas à nous contacter.
Data Streams Monitoring is not available for the site.
Schema tracking is in beta for Java services using Protobuf and Avro. If you're interested in other languages and schemas, reach out here.
Data Streams Monitoring provides visibility into schemas used by producers and consumers, and how schema issues impact downstream services. You can track new schemas added, schemas with errors, and schema evolutions to manage schema migrations and identify issues.
Changing a schema produced by a service without updating the consumer can lead to the consumer struggling to process payloads, blocking further data flow downstream. Understanding schema changes ensures data compatibility between producers and consumers, and ultimately prevents issues.
Prerequisites
You must have Data Streams Monitoring installed on your Java producer and consumer services.
Schema tracking requires version v1.36.0+ of dd-trace-java for Protobuf or Avro tracking.
View schemas
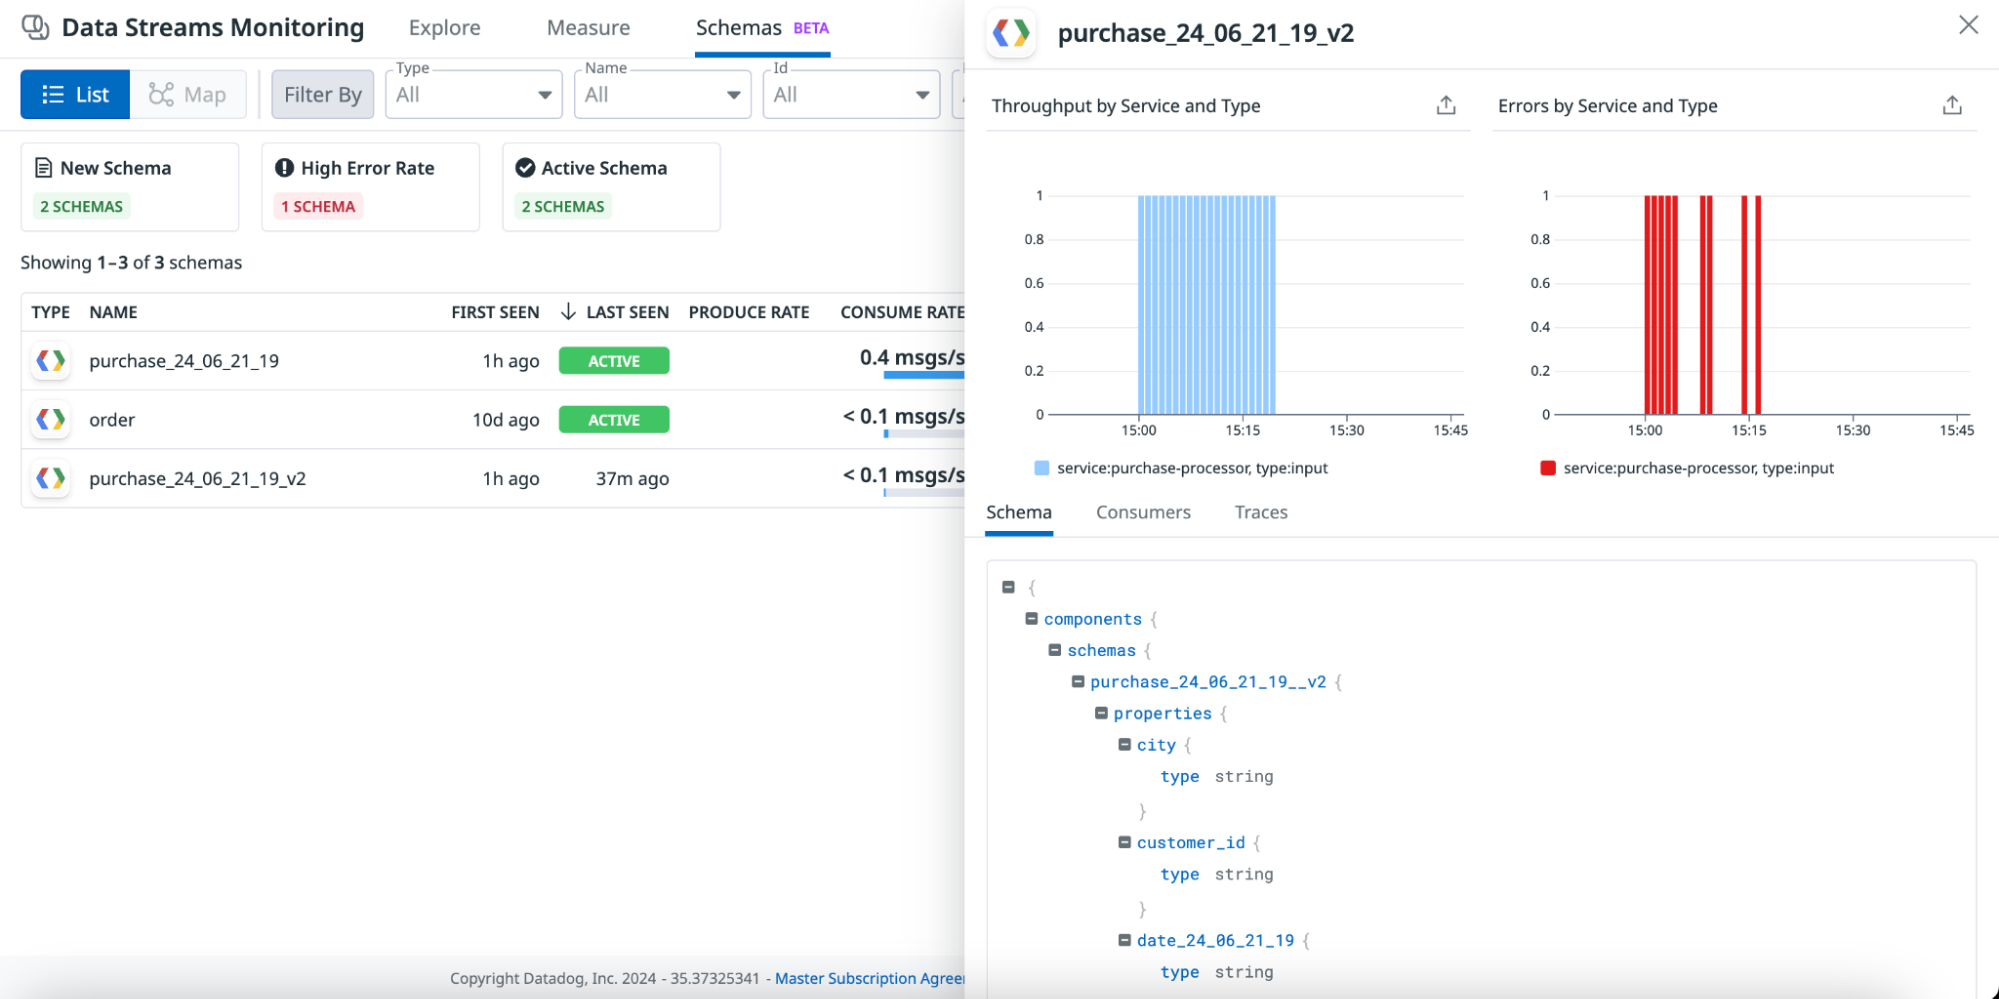
Schema list
In the schema list, you can view all schemas used across your pipelines.
For each schema, the table shows the following:
- Type
- Name
- First and last seen
- Produce rate, consume rate, and error rate in the selected time frame
- All producers and consumers of the schema
- Consumer lag: the max Kafka lag for all consumers of a specific schema
Selecting a schema from the list displays the throughput of the schema by service, errors by service, and the full schema.
Use the following steps to view detailed information about a schema:
- Navigate to Data Streams Monitoring.
- Click the Schemas tab.
- Select the time frame.
- Use the quick filters to filter for new schemas (first seen within the last 3 hours), schemas with high error rates, or active schemas.
- Select a schema. A side panel opens with detailed information for that schema.
At the service level
For each service you track in Data Streams Monitoring, you can see information about the schemas that it uses.
To view schema information at the service level:
- Navigate to Data Streams Monitoring.
- Ensure the Explore tab is selected.
- Click on a service. The service detail side panel appears.
- Select the Schemas tab.
On the schemas tab, you can:
- View input throughput by schema.
- View a list of all schemas detected within the selected time frame, along with when it was first and last seen, its type (input or output schema), error rate, and throughput.
- Expand a schema to view all of its fields.


