- Principales informations
- Getting Started
- Datadog
- Site Datadog
- DevSecOps
- Serverless for AWS Lambda
- Agent
- Intégrations
- Conteneurs
- Dashboards
- Monitors
- Logs
- Tracing
- Profileur
- Tags
- API
- Service Catalog
- Session Replay
- Continuous Testing
- Surveillance Synthetic
- Incident Management
- Database Monitoring
- Cloud Security Management
- Cloud SIEM
- Application Security Management
- Workflow Automation
- CI Visibility
- Test Visibility
- Intelligent Test Runner
- Code Analysis
- Learning Center
- Support
- Glossary
- Standard Attributes
- Guides
- Agent
- Intégrations
- OpenTelemetry
- Développeurs
- Authorization
- DogStatsD
- Checks custom
- Intégrations
- Create an Agent-based Integration
- Create an API Integration
- Create a Log Pipeline
- Integration Assets Reference
- Build a Marketplace Offering
- Create a Tile
- Create an Integration Dashboard
- Create a Recommended Monitor
- Create a Cloud SIEM Detection Rule
- OAuth for Integrations
- Install Agent Integration Developer Tool
- Checks de service
- IDE Plugins
- Communauté
- Guides
- API
- Application mobile
- CoScreen
- Cloudcraft
- In The App
- Dashboards
- Notebooks
- DDSQL Editor
- Alertes
- Infrastructure
- Métriques
- Watchdog
- Bits AI
- Service Catalog
- API Catalog
- Error Tracking
- Service Management
- Infrastructure
- Universal Service Monitoring
- Conteneurs
- Sans serveur
- Surveillance réseau
- Cloud Cost
- Application Performance
- APM
- Profileur en continu
- Database Monitoring
- Agent Integration Overhead
- Setup Architectures
- Configuration de Postgres
- Configuration de MySQL
- Configuration de SQL Server
- Setting Up Oracle
- Setting Up MongoDB
- Connecting DBM and Traces
- Données collectées
- Exploring Database Hosts
- Explorer les métriques de requête
- Explorer des échantillons de requêtes
- Dépannage
- Guides
- Data Streams Monitoring
- Data Jobs Monitoring
- Digital Experience
- RUM et Session Replay
- Product Analytics
- Surveillance Synthetic
- Continuous Testing
- Software Delivery
- CI Visibility
- CD Visibility
- Test Visibility
- Exécuteur de tests intelligent
- Code Analysis
- Quality Gates
- DORA Metrics
- Securité
- Security Overview
- Cloud SIEM
- Cloud Security Management
- Application Security Management
- AI Observability
- Log Management
- Pipelines d'observabilité
- Log Management
- Administration
Getting Started with Service Catalog
Cette page n'est pas encore disponible en français, sa traduction est en cours.
Si vous avez des questions ou des retours sur notre projet de traduction actuel, n'hésitez pas à nous contacter.
Si vous avez des questions ou des retours sur notre projet de traduction actuel, n'hésitez pas à nous contacter.
Overview
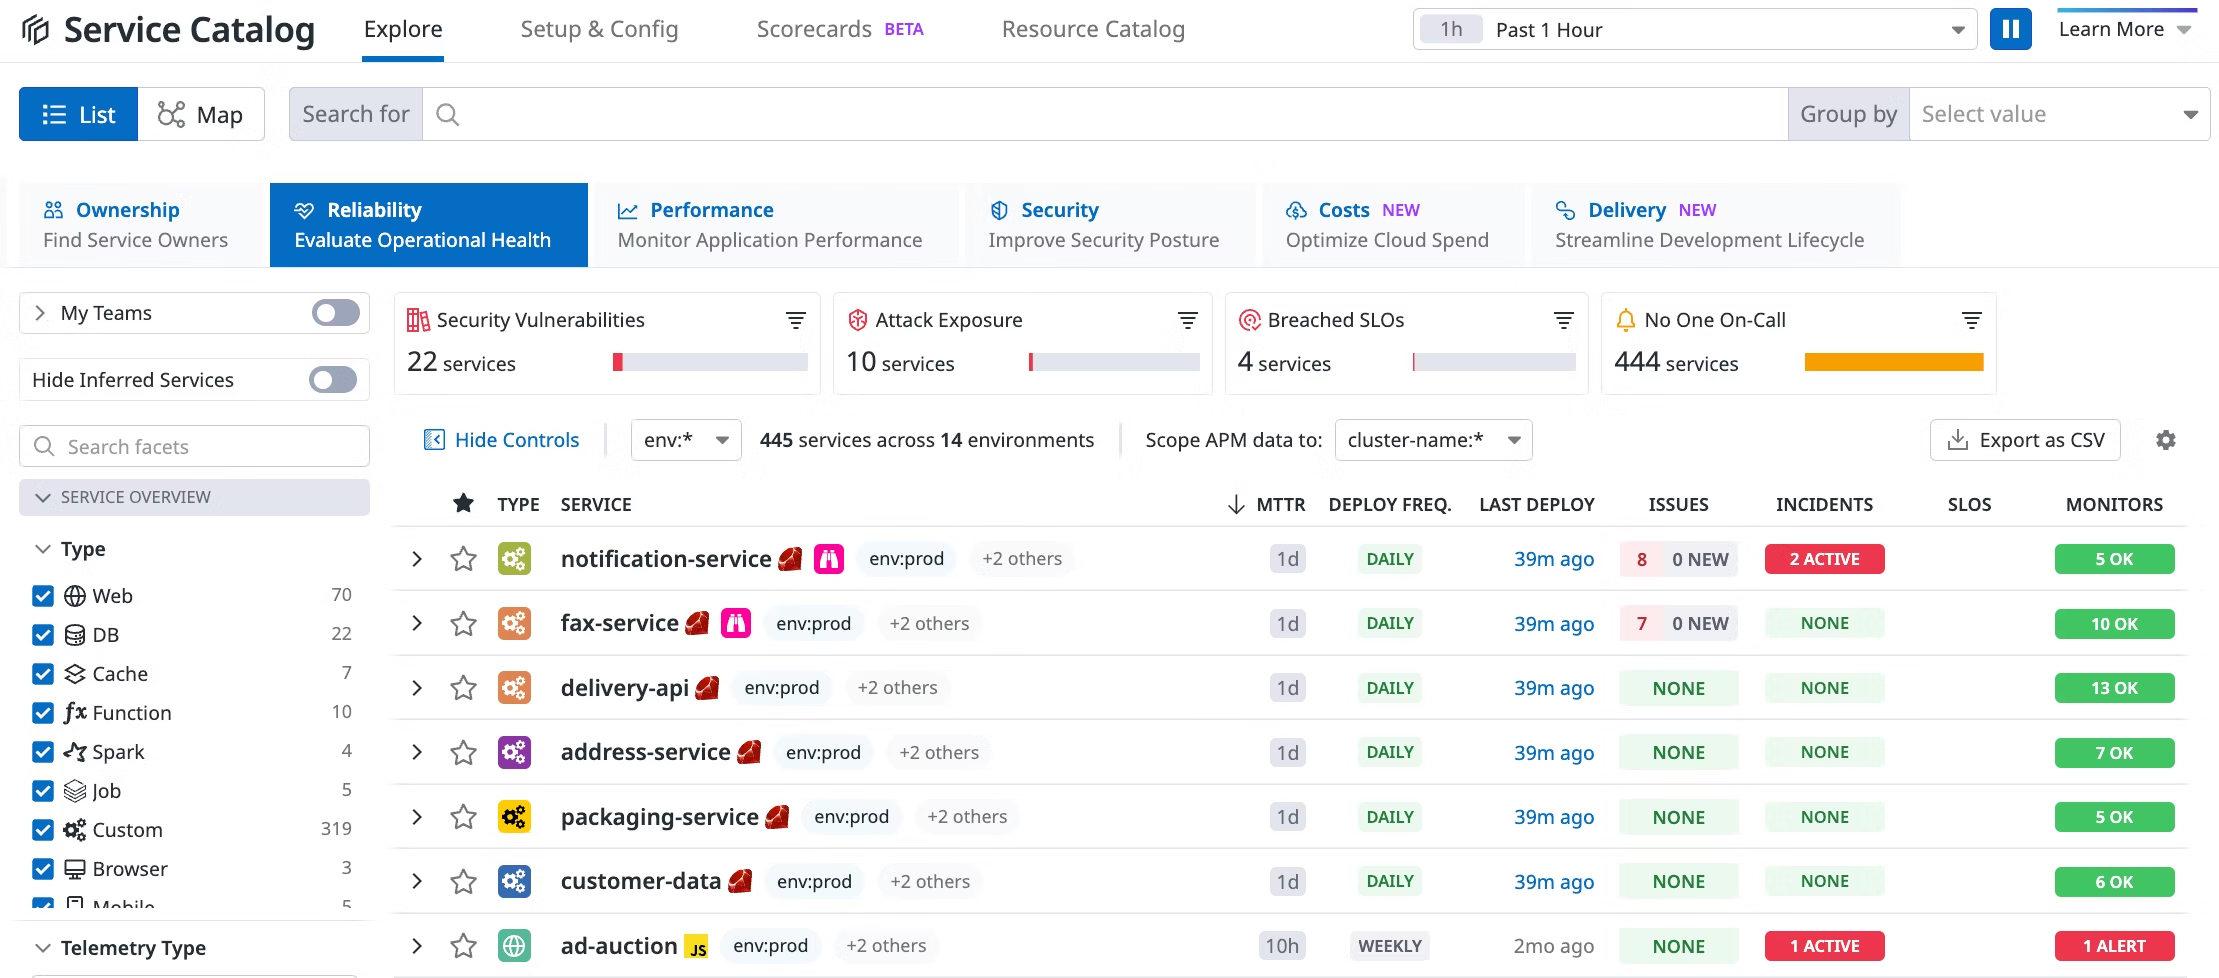
Datadog Service Catalog provides a consolidated view of your services, combining ownership metadata, performance insights, security analysis, cost allocation, and much more. Having this centralized hub allows your development teams to discover and manage critical components in your runtime environments.
This page walks you through getting started with Service Catalog in Datadog.
Prerequisites
If you have not already, create a Datadog account.
Adding entries to Service Catalog
Automatically detected services
Service Catalog automatically discovers services based on application performance telemetries such as APM, USM, and RUM. The integration with APM enables Datadog to routinely discover new services at the same frequency as your traces are collected. With USM, the Datadog Agent connects to your eBPF-compatible hosts. USM automatically detects the services running on this infrastructure and tags them using unified service tagging.
User-defined services
If you are not using these products, you can manually declare services as entries in the service.definition.yaml registry. The definitions in this file include all the metadata that the catalog uses to file your services. These can be created and updated programmatically using an internal API or with a configuration management service like Terraform. You should include this file in your version control and regularly update it whenever new resources are added to your environment.
The following example represents a shopping-cart service from an e-commerce application. It includes important metadata about the service, such as its owning team, languages used, runbook link, and code repository.
service.datadog.yaml
schema-version: v2.2
dd-service: shopping-cart
team: e-commerce
application: shopping-app
tier: "1"
type: web
languages:
  - go
  - python
contacts:
  - type: slack
    contact: https://yourorg.slack.com/archives/e-commerce
  - type: email
    contact: ecommerce@example.com
  - type: microsoft-teams
    contact: https://teams.microsoft.com/example
links:
  - name: Runbook
    type: runbook
    url: http://runbook/shopping-cart
  - name: Source
    type: repo
    provider: github
    url: https://github.com/shopping-cart
  - name: Deployment
    type: repo
    provider: github
    url: https://github.com/shopping-cart
  - name: Config
    type: repo
    provider: github
    url: https://github.com/consul-config/shopping-cart
  - name: E-Commerce Team
    type: doc
    provider: wiki
    url: https://wiki/ecommerce
  - name: Shopping Cart Architecture
    type: doc
    provider: wiki
    url: https://wiki/ecommerce/shopping-cart
  - name: Shopping Cart RFC
    type: doc
    provider: google doc
    url: https://doc.google.com/shopping-cart
tags:
  - business-unit:retail
  - cost-center:engineering
integrations:
  pagerduty:
    service-url: https://www.pagerduty.com/service-directory/PSHOPPINGCART
  opsgenie:
    service-url: "https://www.opsgenie.com/service/uuid"
    region: "US"
ci-pipeline-fingerprints:
  - id1
  - id2
extensions:
  additionalProperties:
    customField1: customValue1
    customField2: customValue2
You can also use any existing knowledge sources your organization maintains, such as Configuration Management Database (CMDB) tables (through Datadog’s ServiceNow integration) and spreadsheets, to populate your Service Catalog. Datadog also has an integration with Backstage that allows you to import any data or services registered here into Datadog directly.
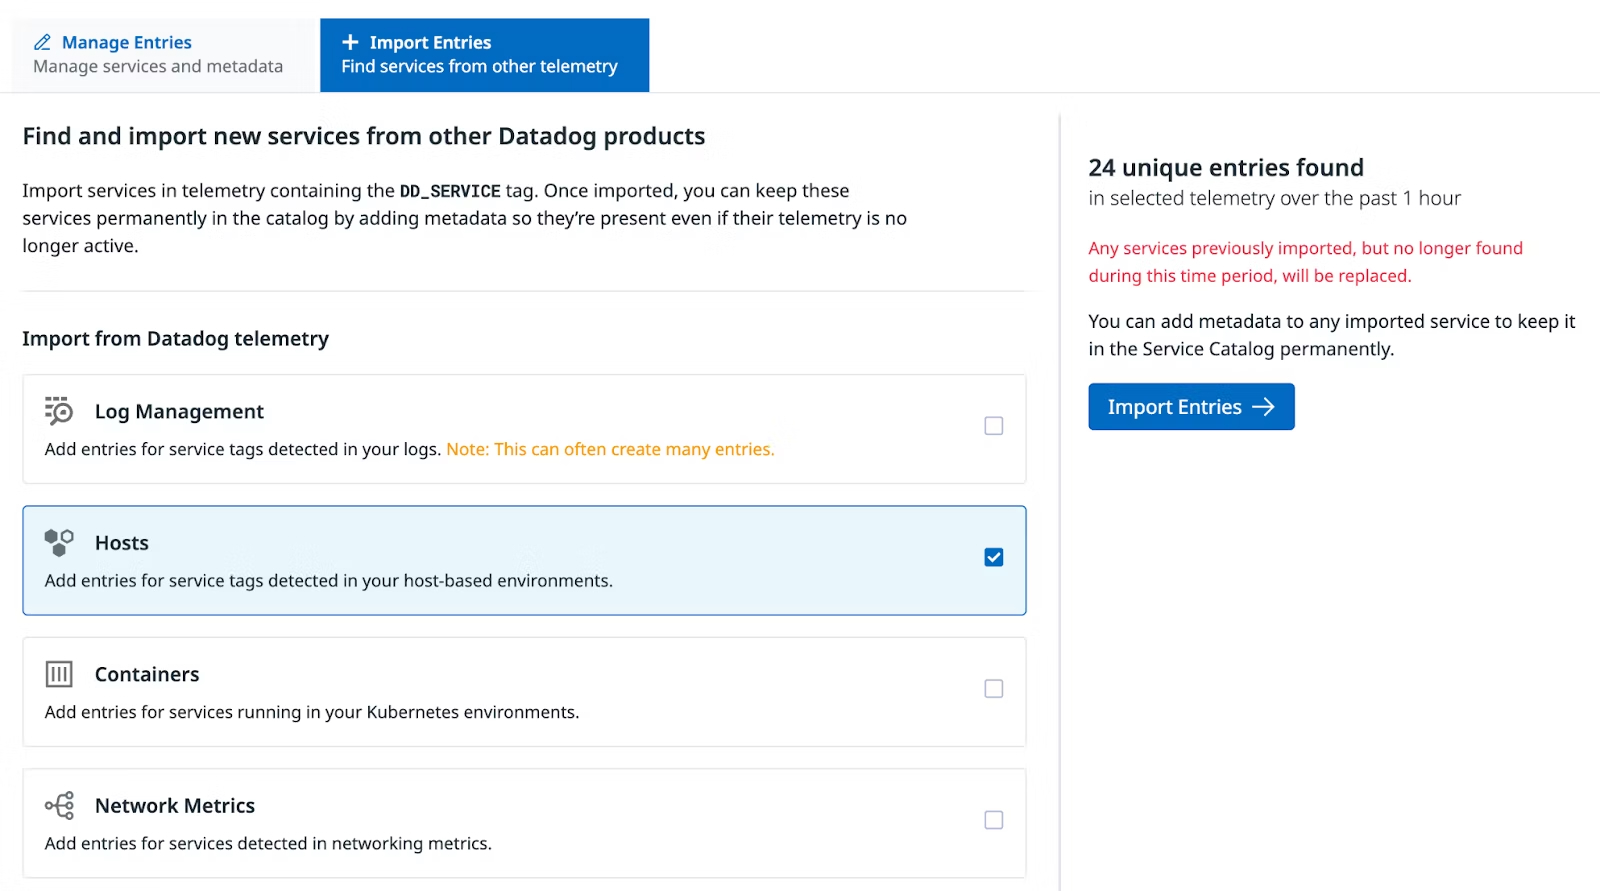
Finally, you can also create entries from service tags in other Datadog products like Infrastructure Monitoring and Log Management.
Managing metadata in Service Catalog
After you create these initial entries in your Service Catalog, it is important to keep the catalog updated consistently so that it remains effective. Service definition files should exist within your team’s version control to make it easier to reference new deployments and other changes to the services where an update may be required.
You can also automate the management of your service metadata by configuring a GitHub action. This will also allow you to ensure that teams are declaring services in a way that meets your standards, such as requiring all of your production services to have valid runbook links.
If your organization has an existing registry of ownership, including internal systems like Backstage or a spreadsheet, a central team can schedule updates to service definition files using API calls.
Connect telemetry from across your monitoring stack
Connect monitoring data from the rest of your observability platform to improve the utility of your catalog.
With unified service tagging, you can use the service tag to cross-reference service entities in the Service Catalog across all Datadog products. These tags can help enrich your service entities with metadata, metrics, and other context sources like Infrastructure Monitoring, RUM, Log Management, Software Delivery, and Security.
Application performance telemetry from Universal Service Monitoring and APM also provide out-of-the-box dependency mapping for your system ecosystem, so you can see how components interact with each other in all your runtime environments.
Enriching your Service Catalog
After services are populated in the catalog, you can enrich your service definitions with additional context to make them more useful. This could include adding key pieces of service metadata to your service.definition.yaml files such as:
- Team
- On-call engineer
- Contact channel
- Documentation links
- Last deployed version
- Code repositories
- Runbook links
- Library dependencies and their versions
- Relevant dashboards
Service Catalog uses service definition schemas to store and display this metadata about your services. The schemas have built-in validation rules to ensure that only valid values are accepted. There are currently four supported schemas: v2, v2.1, v2.2, and v3.
Using Service Catalog Scorecards
Service Scorecards help you codify your organization’s best practices as rules that can be evaluated. By implementing scorecards in your catalog, your teams can measure many dimensions of service quality, including:
- Monitoring coverage
- Production readiness
- Security posture
- Adoption of the latest internal tooling
- Integration checks
Datadog Scorecards include 10 out-of-the-box rules across observability practices, ownership tagging, and production readiness checkpoints. You can also define your own custom rules. For example, you could create a scorecard that contains a set of rules that map to the steps in your security review process, so that you can quickly audit whether each of your services is compliant. These rules might include checks related to CVE analysis, RBAC configuration, or other security parameters.
To add custom rules to your Scorecards dashboard:
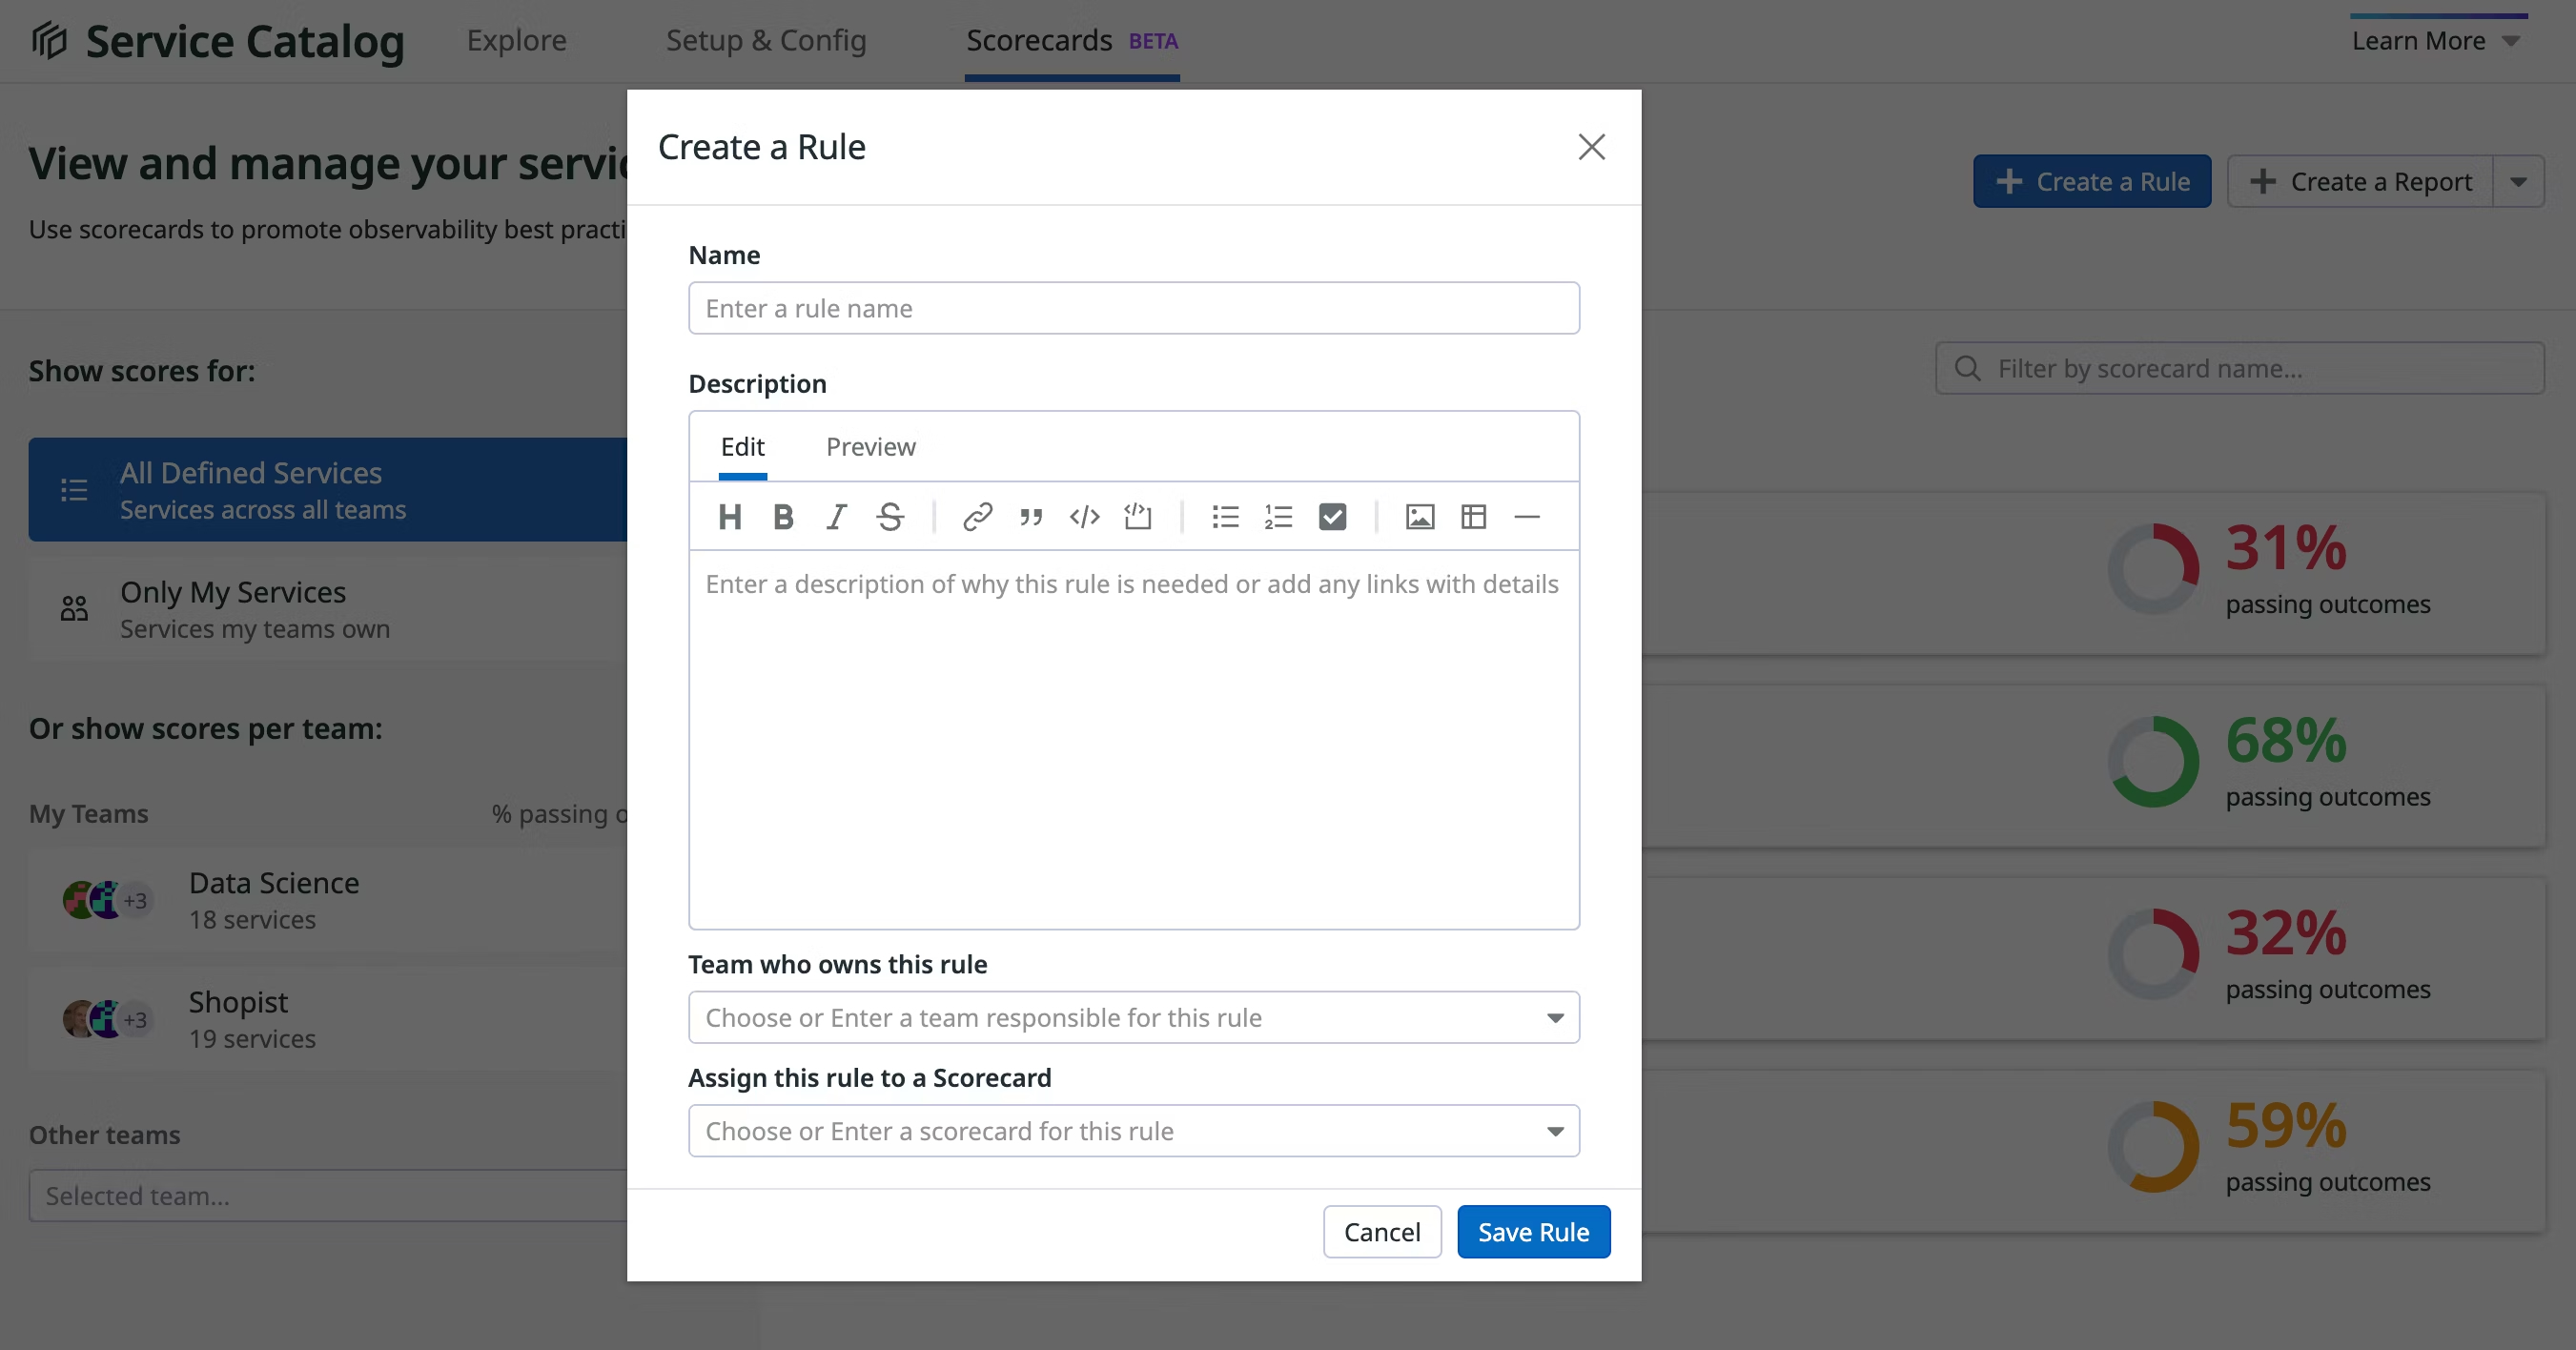
- Click Create Rule on the Scorecards page.
- Specify the name of the rule, the scorecard it belongs to, a rule description, and the owning team.
- Send an outcome of
pass,fail, orskipfor each{rule, service}tuple that you are evaluating to the Scorecards API/scorecard/outcomes/batchendpoint. - View an overview of outcomes in the Scorecards dashboard.
Further reading
Documentation, liens et articles supplémentaires utiles:


