- Principales informations
- Getting Started
- Datadog
- Site Datadog
- DevSecOps
- Serverless for AWS Lambda
- Agent
- Intégrations
- Conteneurs
- Dashboards
- Monitors
- Logs
- Tracing
- Profileur
- Tags
- API
- Service Catalog
- Session Replay
- Continuous Testing
- Surveillance Synthetic
- Incident Management
- Database Monitoring
- Cloud Security Management
- Cloud SIEM
- Application Security Management
- Workflow Automation
- CI Visibility
- Test Visibility
- Intelligent Test Runner
- Code Analysis
- Learning Center
- Support
- Glossary
- Standard Attributes
- Guides
- Agent
- Intégrations
- OpenTelemetry
- Développeurs
- Authorization
- DogStatsD
- Checks custom
- Intégrations
- Create an Agent-based Integration
- Create an API Integration
- Create a Log Pipeline
- Integration Assets Reference
- Build a Marketplace Offering
- Create a Tile
- Create an Integration Dashboard
- Create a Recommended Monitor
- Create a Cloud SIEM Detection Rule
- OAuth for Integrations
- Install Agent Integration Developer Tool
- Checks de service
- IDE Plugins
- Communauté
- Guides
- API
- Application mobile
- CoScreen
- Cloudcraft
- In The App
- Dashboards
- Notebooks
- DDSQL Editor
- Alertes
- Infrastructure
- Métriques
- Watchdog
- Bits AI
- Service Catalog
- API Catalog
- Error Tracking
- Service Management
- Infrastructure
- Universal Service Monitoring
- Conteneurs
- Sans serveur
- Surveillance réseau
- Cloud Cost
- Application Performance
- APM
- Profileur en continu
- Database Monitoring
- Agent Integration Overhead
- Setup Architectures
- Configuration de Postgres
- Configuration de MySQL
- Configuration de SQL Server
- Setting Up Oracle
- Setting Up MongoDB
- Connecting DBM and Traces
- Données collectées
- Exploring Database Hosts
- Explorer les métriques de requête
- Explorer des échantillons de requêtes
- Dépannage
- Guides
- Data Streams Monitoring
- Data Jobs Monitoring
- Digital Experience
- RUM et Session Replay
- Product Analytics
- Surveillance Synthetic
- Continuous Testing
- Software Delivery
- CI Visibility
- CD Visibility
- Test Visibility
- Exécuteur de tests intelligent
- Code Analysis
- Quality Gates
- DORA Metrics
- Securité
- Security Overview
- Cloud SIEM
- Cloud Security Management
- Application Security Management
- AI Observability
- Log Management
- Pipelines d'observabilité
- Log Management
- Administration
Orchestrator Explorer
Cette page n'est pas encore disponible en français, sa traduction est en cours.
Si vous avez des questions ou des retours sur notre projet de traduction actuel, n'hésitez pas à nous contacter.
Si vous avez des questions ou des retours sur notre projet de traduction actuel, n'hésitez pas à nous contacter.
Overview
The Datadog Agent and Cluster Agent can retrieve Kubernetes resources for the Orchestrator Explorer. This feature allows you to monitor the state of pods, deployments, and other Kubernetes concepts in a specific namespace or availability zone, view resource specifications for failed pods within a deployment, correlate node activity with related logs, and more.
Orchestrator Explorer requires Agent version >= 7.27.0 and Cluster Agent version >= 1.11.0.
Note: For Kubernetes version 1.25 and above, the minimal Cluster Agent version required is 7.40.0.
Setup
Ensure that you have enabled the Process Agent. If you are using Datadog Operator or the official Helm chart, the Orchestrator Explorer is enabled by default.
The Orchestrator Explorer is enabled in the Datadog Operator by default.
For verification, ensure that the features.orchestratorExplorer.enabled parameter is set to true in your datadog-agent.yaml:
apiVersion: datadoghq.com/v2alpha1
kind: DatadogAgent
metadata:
  name: datadog
spec:
  global:
    credentials:
      apiKey: <DATADOG_API_KEY>
      appKey: <DATADOG_APP_KEY>
  features:
    orchestratorExplorer:
      enabled: true
If you are using the official Helm chart, Orchestrator Explorer is enabled by default.
For verification, ensure that the orchestratorExplorer.enabled parameter is set to true in your values.yaml file:
datadog:
  # (...)
  processAgent:
    enabled: true
  orchestratorExplorer:
    enabled: true
Then, upgrade your Helm chart.
For manual setup, see Set up Orchestrator Explorer with DaemonSet.
Usage
Views
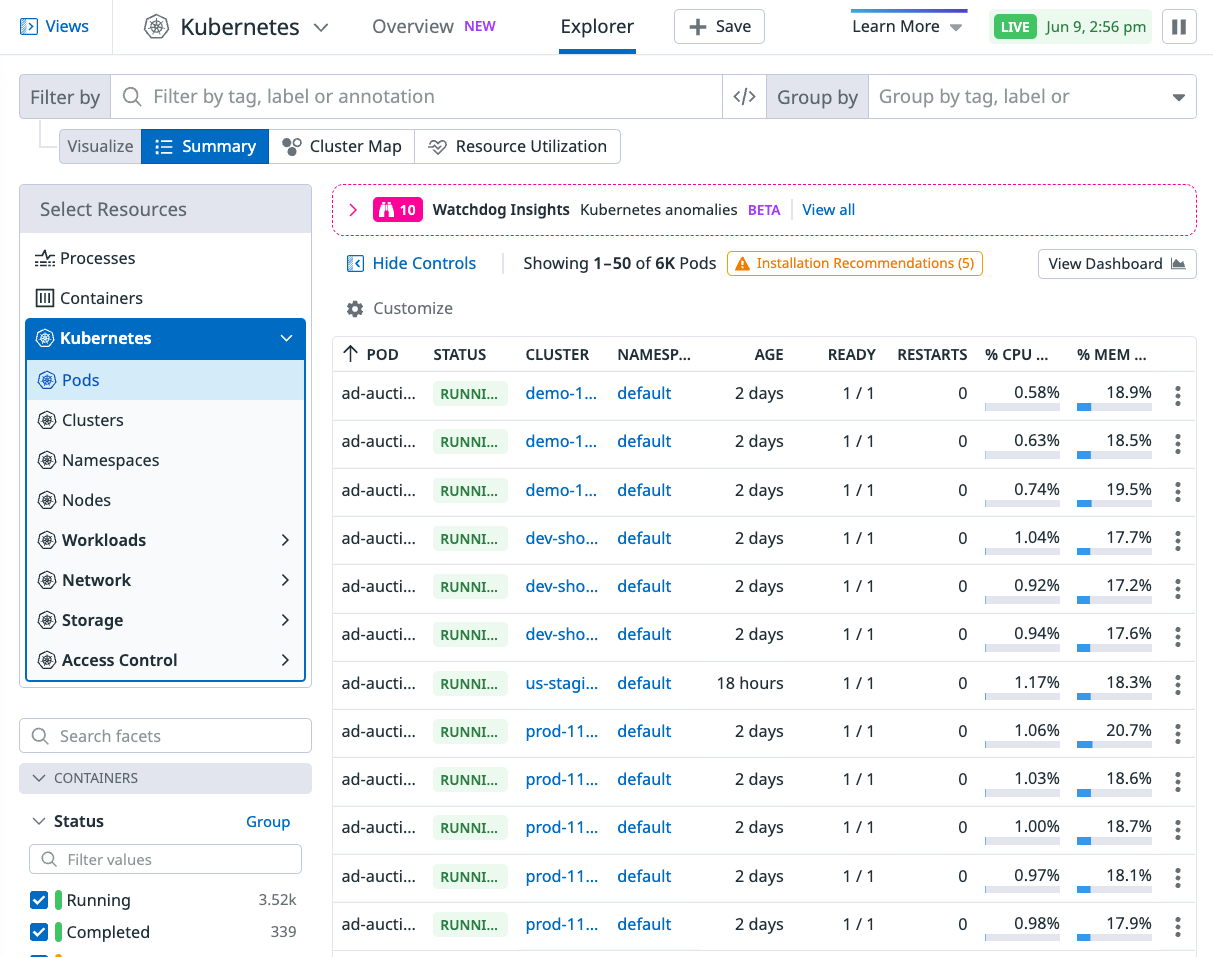
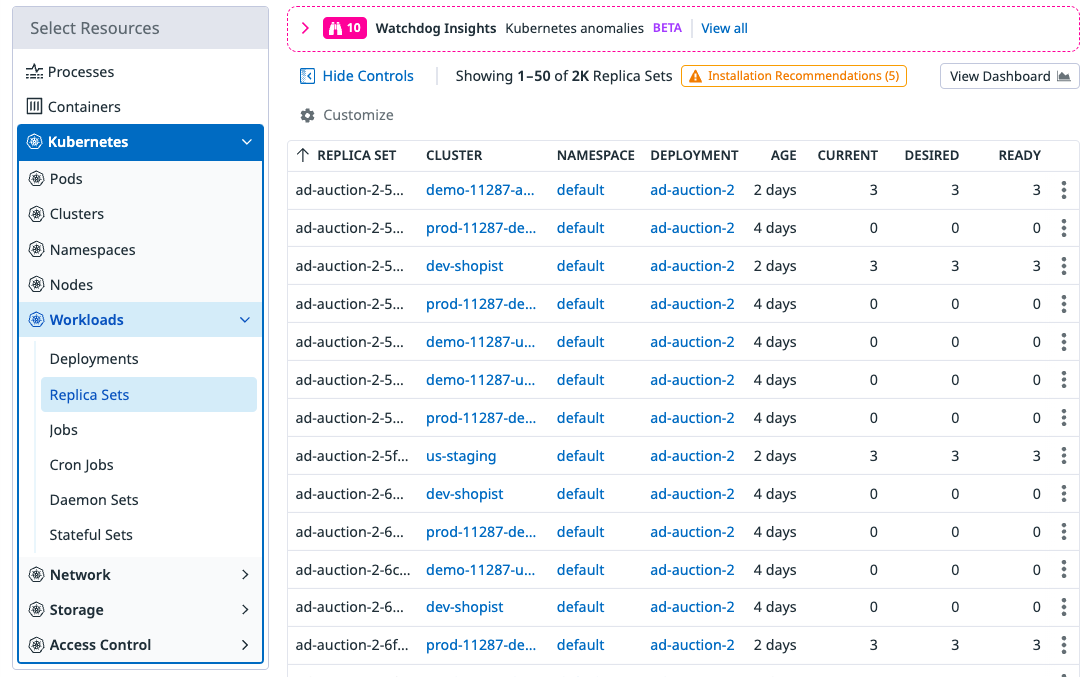
Toggle among the Pods, Clusters, Namespaces, and other Kubernetes resources in the Select Resources dropdown menu in the top left corner of the page.
Each of these views includes a data table to help you better organize your data by field such as status, name, and Kubernetes labels, and a detailed Cluster Map to give you a bigger picture of your pods and Kubernetes clusters.
See Query filter details for more details on how to filter these views.
Group by functionality and facets
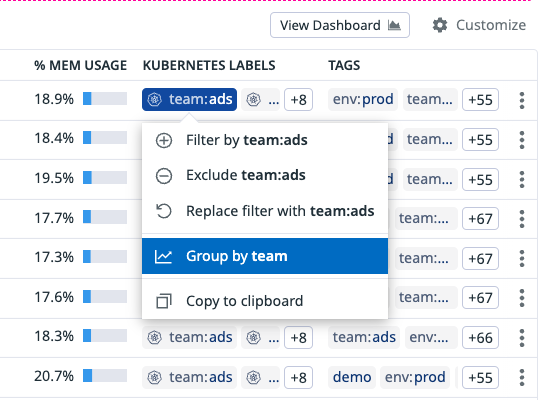
Group pods by tags, Kubernetes labels, or Kubernetes annotations to get an aggregated view which allows you to find information quicker. You can perform a group by using the “Group by” bar on the top right of the page or by clicking on a particular tag or label and locating the group by function in the context menu as shown below.
You can also use facets on the left hand side of the page to group resources or filter for resources you care most about, such as pods with a CrashLoopBackOff pod status.
Cluster map
A cluster map gives you a bigger picture of your pods and Kubernetes clusters. You can see all of your resources together on one screen with customized groups and filters, and choose which metrics to fill the color of the nodes.
Examine resources from cluster maps by clicking on any circle or group to populate a detailed panel.
Information panel
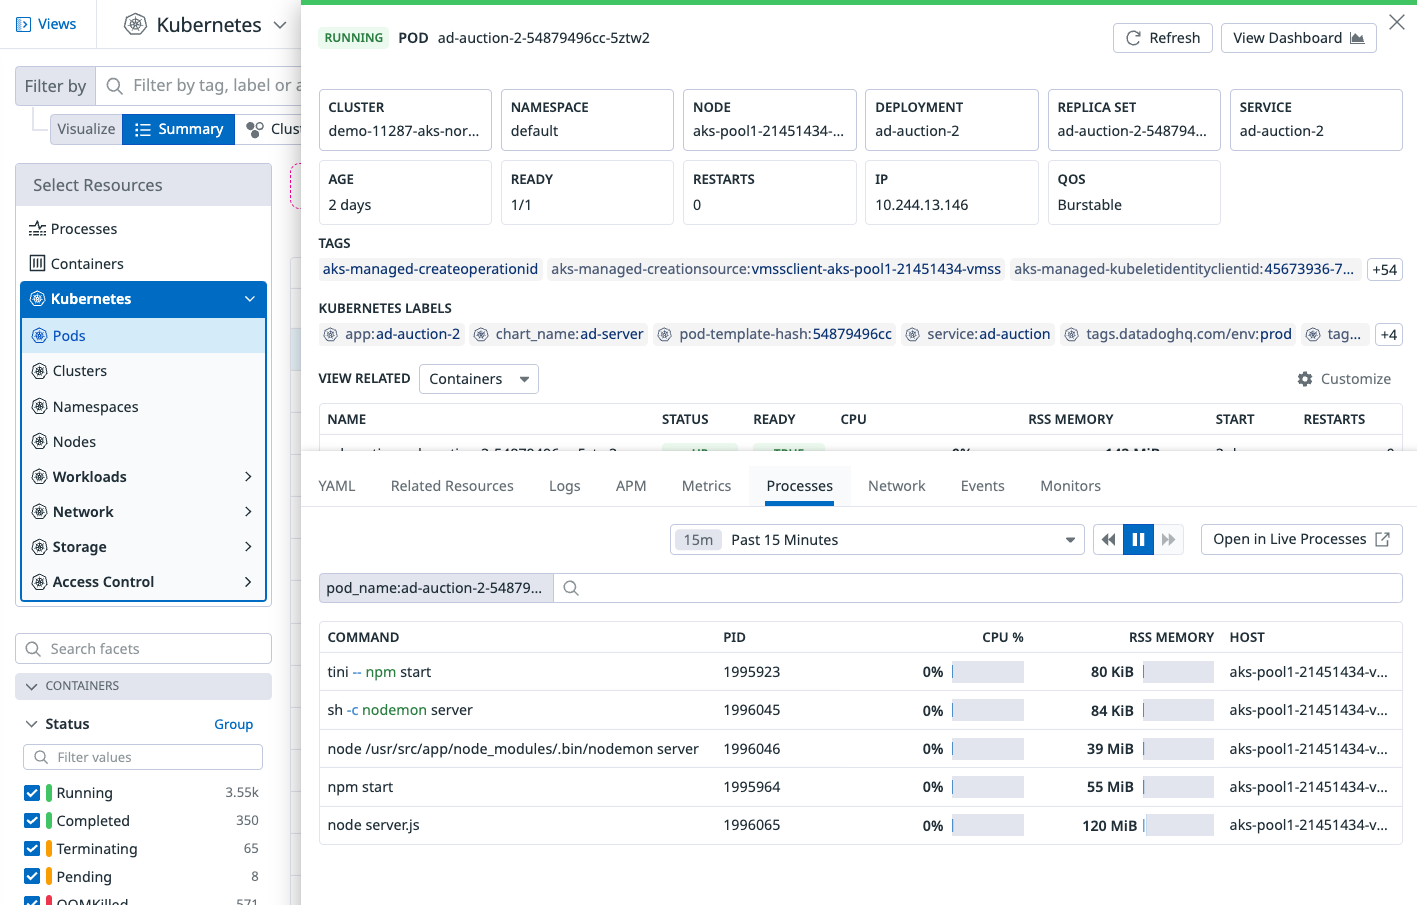
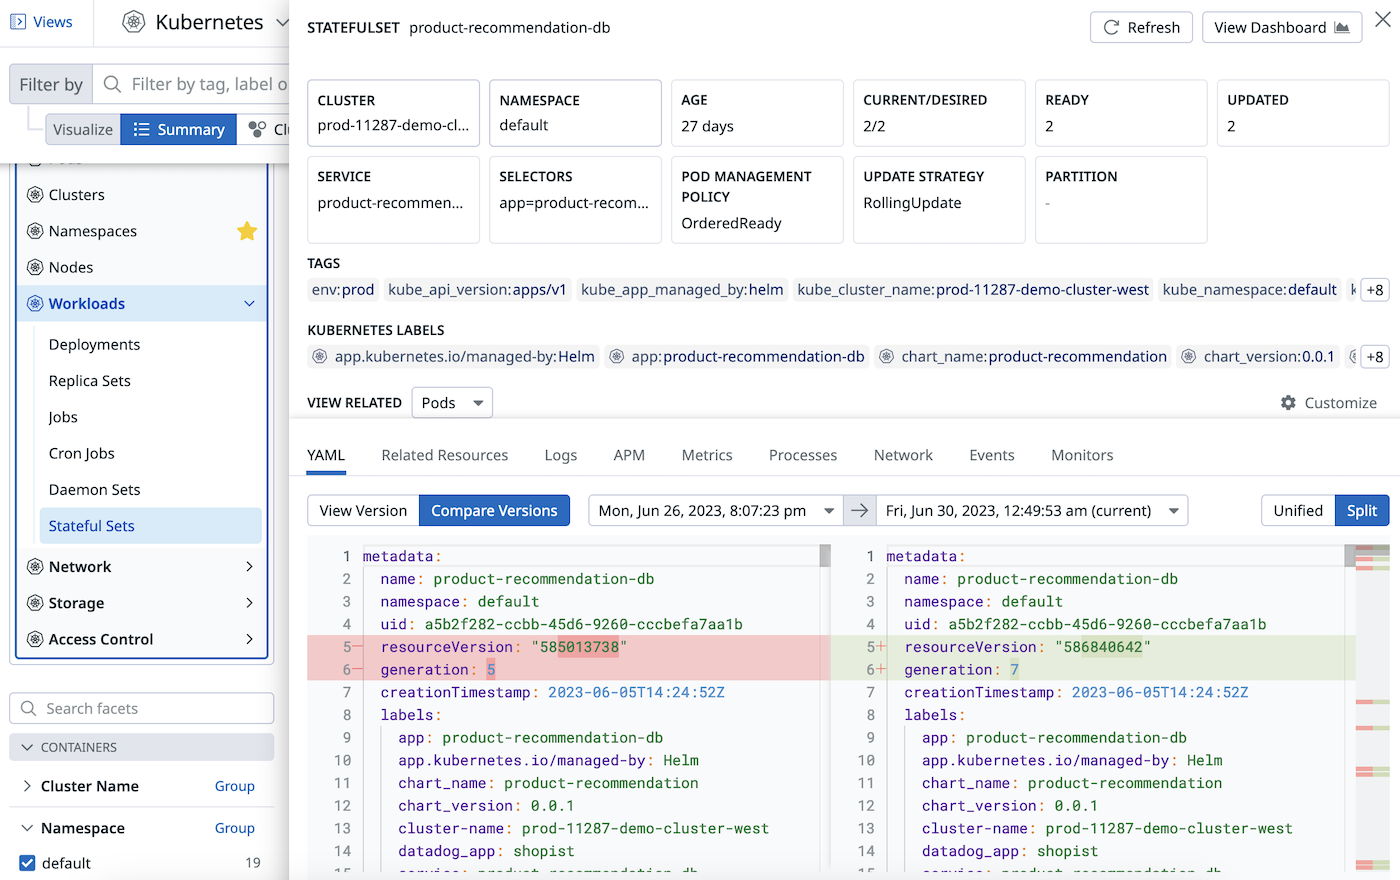
Click on any row in the table or on any object in a Cluster Map to view information about a specific resource in a side panel.
The side panel’s YAML tab shows the full resource definition. Starting in Agent version 7.44.0, it also includes seven days of definition history. You can compare what changed over time and across different versions. The time indicated is approximately when the changes were applied to the resource.
To prevent displaying a large number of irrelevant changes, updates affecting only the following fields are ignored:
- metadata.resourceVersion
- metadata.managedFields
- metadata.generation
- status
The other tabs show more information for troubleshooting the selected resource:
- Logs: View logs from your container or resource. Click on any log to view related logs in the Log Explorer.
- APM: View traces from your container or resource, including the date, service, duration, method, and status code of a trace.
- Metrics: View live metrics for your container or resource. You can view any graph full screen, share a snapshot of it, or export it from this tab.
- Processes: View all processes running in the container of this resource.
- Network: View a container or resource’s network performance, including source, destination, sent and received volume, and throughput fields. Use the Destination field to search by tags like
DNSorip_type, or use the Group by filter in this view to group network data by tags, likepod_nameorservice. - Events: View all Kubernetes events for your resource.
- Monitors: View monitors tagged, scoped, or grouped for this resource.
For a detailed dashboard of this resource, click the View Dashboard in the top right corner of this panel.
Resource utilization
For the Resource Utilization page, see Resource Utilization.
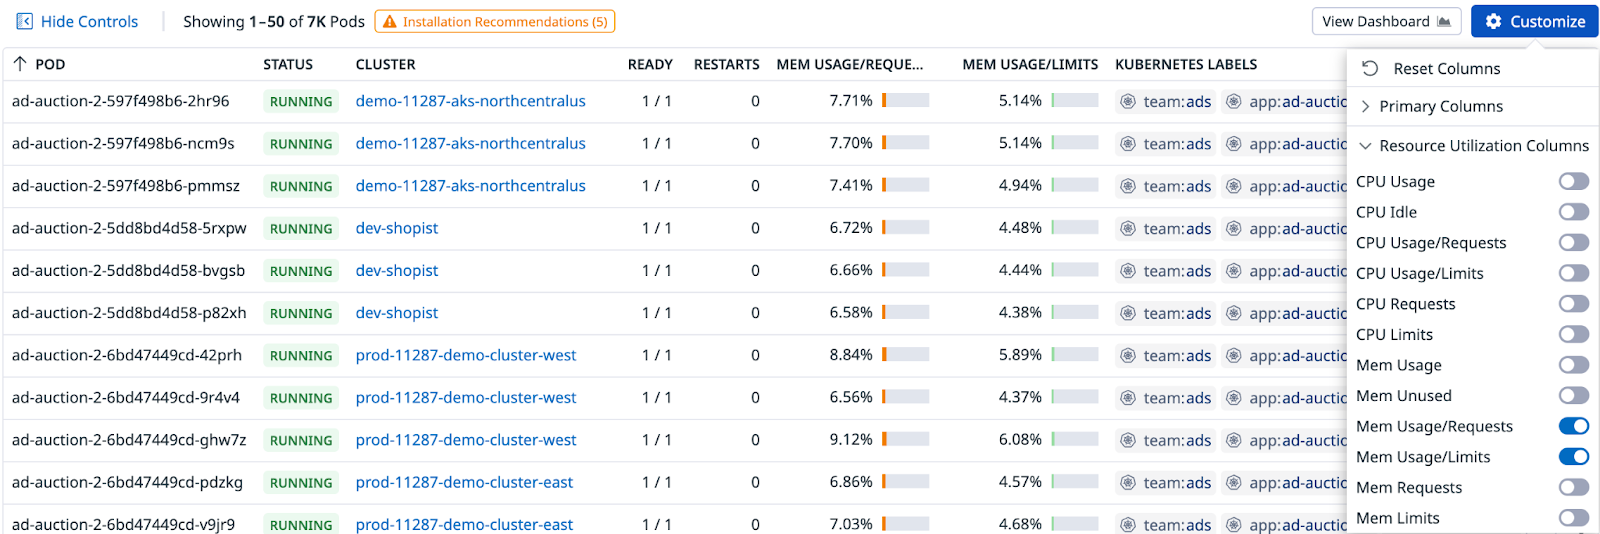
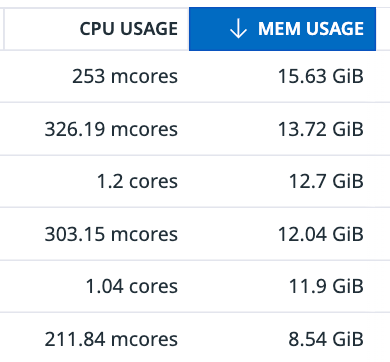
Within the Kubernetes Explorer tab, you can explore a selection of resource utilization metrics.
All of these columns support sorting, which helps you to pinpoint individual workloads based on their resource utilization.
Query filter details
You can narrow down the displayed resources by supplying a query within the “Filter by” search bar on the top left of the page.
Syntax
A query filter is composed of terms and operators. Example:
Terms
There are multiple types of terms available:
| Type | Examples |
|---|---|
| Tags: Attached to resources by the agent collecting them. There are also additional tags that Datadog generates for Kubernetes resources. | datacenter:stagingtag#datacenter:staging(the tag# is optional) |
| Labels: Extracted from a resource’s metadata. They are typically used to organize your cluster and target specific resources with selectors. | label#chart_version:2.1.0 |
| Annotations: Extracted from a resource’s metadata. They are generally used to support tooling that aid in cluster management. | annotation#checksum/configmap:a1bc23d4 |
| Metrics: Added to workload resources (pods, deployments, etc.). You can find resources based on their utilization. To see what metrics are supported, see Resource Utilization Filters. | metric#cpu_usage_pct_limits_avg15:>80% |
| String matching: Supported by some specific resource attributes, see below. Note: string matching does not use the key-value format, and you cannot specify the attribute to match on. | "10.132.6.23" (IP)"9cb4b43f-8dc1-4a0e" (UID)web-api-3 (Name) |
| Fields: Extracted from a resource’s metadata. | field#metadata.creationTimestamp:>=4wkfield#metadata.deletionTimestamp:<=1hr |
Note: You might find the same key-value pairs as both a tag and label (or annotation) - this is dependent on how your cluster is configured.
The following resource attributes are supported in arbitrary String Matching:
metadata.namemetadata.uid- IP Addresses found in:
- Pods
- Nodes (internal and external)
- Services (cluster, external, and load balancer IPs)
You do not need to specify a key to search for a resource by name, or IP. Quotes are not required unless your string search includes certain special characters.
Comparators
All terms support the : equality operator. Metric value terms support numeric comparisons as well:
:>Greater than (for example,metric#cpu_usage_avg15:>0.9):>=Greater than or equal:<Less than:<=Less than or equal
Operators
To combine multiple terms into a complex query, you can use any of the following case sensitive boolean operators:
| Operator | Description | Example |
|---|---|---|
AND | Intersection: Both terms are in the selected events (if nothing is added, AND is taken by default) | a AND b |
OR | Union: Either term is contained in the selected events | a OR b |
NOT / - | Exclusion: The following term is NOT in the event (apply to each individual raw text search) | a AND NOT b ora AND -b |
( ) | Grouping: Specify how to group terms logically. | a AND (b OR c) or(a AND b) or c |
OR value shorthand
Multiple terms sharing the same key can be combined into a single term if they all use the OR operator. For example, this query:
app_name:web-server OR app_name:database OR app_name:event-consumer
Can be reduced to:
app_name:(web-server OR database OR event-consumer)
Wildcards
You can use * wildcards as part of a term to filter by partial matches, both for values and keys. Some examples:
kube_job:stats-*: Find all resources with akube_deploymenttag value starting withstats-.pod_name:*canary: Find all resources with apod_namevalue ending incanary.label#release:*: Find all resources with areleaselabel, regardless of its value.-label#*.datadoghq.com/*: Find resources that do not have any Datadog scoped labels.kube_*:*stats*canary: Find resources that have related resource tags (kube_*), withstatsin the middle of the value, also ending withcanary.
Extracted tags
In addition to the tags you have configured within your Datadog agent, Datadog injects generated tags based on resource attributes that can help your searching and grouping needs. These tags are added to resources conditionally, when they are relevant.
All resources
All resources have the kube_cluster_name tag and all namespaced resources have the kube_namespace tag added to them.
Additionally, resources contain a kube_<api_kind>:<metadata.name> tag. For example, a deployment named web-server-2 would have the kube_deployment:web-server-2 tag automatically added to it.
Note: There are some exceptions to this pattern:
- Pods use
pod_nameinstead.- VPAs:
verticalpodautoscaler.- VPHs:
horizontalpodautoscaler.- Persistent Volume Claims:
persistentvolumeclaim.
Based on the labels attached to the resource, the following tags will also be extracted:
| Tag | Source Label |
|---|---|
kube_app_name | app.kubernetes.io/name |
kube_app_instance | app.kubernetes.io/instance |
kube_app_version | app.kubernetes.io/version |
kube_app_component | app.kubernetes.io/component |
kube_app_part_of | app.kubernetes.io/part-of |
kube_app_managed_by | app.kubernetes.io/managed-by |
env | tags.datadoghq.com/env |
version | tags.datadoghq.com/version |
service | tags.datadoghq.com/service |
Relationships
Related Resources will be tagged with each other. Some examples:
- A pod that is part of the “XYZ” deployment will have a
kube_deployment:xyztag. - An ingress that points at service “A” will have a
kube_service:atag.
Resources that are spawned from “parent” resources will have the kube_ownerref_kind and kube_ownerref_name tags (such as pods and jobs).
Tip: Utilize the filter query autocomplete feature to discover what related resource tags are available. Type
kube_and see what results are suggested.
Pods
Pods are given the following tags:
pod_namepod_phase(extracted from the manifest)pod_status(calculated similarly tokubectl)
Workloads
Workload resources (pods, deployments, stateful sets, etc.) will have the following tags, indicating their support within the Resources Utilization page:
resource_utilization(supportedorunsupported)missing_cpu_requestsmissing_cpu_limitsmissing_memory_requestsmissing_memory_limits
Conditions
Some conditions, for some resources, are extracted as tags. For example, you can find the kube_condition_available tag on deployments. The tag format is always kube_condition_<name> with a true or false value.
Tip: Use the autocomplete feature to discover what conditions are available on a given resource type by entering
kube_conditionand reviewing the results.
Resource specific tags
Some resources have specific tags that are extracted based on your cluster’s environment. The following tags are available in addition to the shared tags above.
| Resource | Extracted Tags |
|---|---|
| Cluster | api_server_versionkubelet_version |
| Custom Resource Definitions & Custom Resources | kube_crd_kindkube_crd_groupkube_crd_versionkube_crd_scope |
| Namespace | phase |
| Node | kube_node_unschedulablekube_node_kubelet_versionkube_node_kernel_versionkube_node_runtime_versioneks_fargate_nodenode_schedulablenode_status |
| Persistent Volume | kube_reclaim_policykube_storage_class_namepv_typepv_phase |
| Persistent Volume Claim | pvc_phasekube_storage_class_name |
| Pod | pod_name (instead of kube_pod)pod_phase (extracted from the Manifest)pod_status (calculated similarly to kubectl) |
| Service | kube_service_typekube_service_port |
Resource Utilization Filters
The following workload resources are enriched with resource utilization metrics:
- Clusters
- Daemonsets
- Deployments
- Nodes
- Pods
- Replica Sets
- Stateful Sets
These metrics are calculated at the time of collection, based on the average values over the last 15 minutes. You can filter by metric values like so: metric#<metric_name><comparator><numeric_value>.
metric_nameis an available metric (see below)comparatoris a supported comparator- and
numeric_valueis a floating point value.
For these workload resources, the following metric names are available:
| CPU | Memory |
|---|---|
cpu_limits_avg15 | mem_limits_avg15 |
cpu_requests_avg15 | mem_requests_avg15 |
cpu_usage_avg15 | mem_usage_avg15 |
cpu_usage_pct_limits_avg15 | mem_usage_pct_limits_avg15 |
cpu_usage_pct_requests_avg15 | mem_usage_pct_requests_avg15 |
cpu_waste_avg15 | mem_waste_avg15 |
In addition, clusters, and nodes have the following metrics available to them:
cpu_usage_pct_alloc_avg15cpu_requests_pct_alloc_avg15mem_usage_pct_alloc_avg15mem_requests_pct_alloc_avg15
Metric units
CPU metrics are stored as a number of cores.
Memory metrics are stored as bytes.
Percents (*_pct_*) are stored as floats, where 0.0 is 0%, and 1.0 is 100%. The value is the ratio of the two indicated metrics - for example cpu_usage_pct_limits_avg15 is the value of usage / limits. Metric values can be above 100%, such as Percentage CPU Usage of Requests.
Notes and known issues
- Data is updated automatically in constant intervals.
- In clusters with 1000+ Deployments or ReplicaSets you may notice elevated CPU usage from the Cluster Agent. There is an option to disable container scrubbing in the Helm chart. See the Helm Chart repo for more details.
