- Principales informations
- Getting Started
- Datadog
- Site Datadog
- DevSecOps
- Serverless for AWS Lambda
- Agent
- Intégrations
- Conteneurs
- Dashboards
- Monitors
- Logs
- Tracing
- Profileur
- Tags
- API
- Service Catalog
- Session Replay
- Continuous Testing
- Surveillance Synthetic
- Incident Management
- Database Monitoring
- Cloud Security Management
- Cloud SIEM
- Application Security Management
- Workflow Automation
- CI Visibility
- Test Visibility
- Intelligent Test Runner
- Code Analysis
- Learning Center
- Support
- Glossary
- Standard Attributes
- Guides
- Agent
- Intégrations
- OpenTelemetry
- Développeurs
- Authorization
- DogStatsD
- Checks custom
- Intégrations
- Create an Agent-based Integration
- Create an API Integration
- Create a Log Pipeline
- Integration Assets Reference
- Build a Marketplace Offering
- Create a Tile
- Create an Integration Dashboard
- Create a Recommended Monitor
- Create a Cloud SIEM Detection Rule
- OAuth for Integrations
- Install Agent Integration Developer Tool
- Checks de service
- IDE Plugins
- Communauté
- Guides
- API
- Application mobile
- CoScreen
- Cloudcraft
- In The App
- Dashboards
- Notebooks
- DDSQL Editor
- Alertes
- Infrastructure
- Métriques
- Watchdog
- Bits AI
- Service Catalog
- API Catalog
- Error Tracking
- Service Management
- Infrastructure
- Universal Service Monitoring
- Conteneurs
- Sans serveur
- Surveillance réseau
- Cloud Cost
- Application Performance
- APM
- Profileur en continu
- Database Monitoring
- Agent Integration Overhead
- Setup Architectures
- Configuration de Postgres
- Configuration de MySQL
- Configuration de SQL Server
- Setting Up Oracle
- Setting Up MongoDB
- Connecting DBM and Traces
- Données collectées
- Exploring Database Hosts
- Explorer les métriques de requête
- Explorer des échantillons de requêtes
- Dépannage
- Guides
- Data Streams Monitoring
- Data Jobs Monitoring
- Digital Experience
- RUM et Session Replay
- Product Analytics
- Surveillance Synthetic
- Continuous Testing
- Software Delivery
- CI Visibility
- CD Visibility
- Test Visibility
- Exécuteur de tests intelligent
- Code Analysis
- Quality Gates
- DORA Metrics
- Securité
- Security Overview
- Cloud SIEM
- Cloud Security Management
- Application Security Management
- AI Observability
- Log Management
- Pipelines d'observabilité
- Log Management
- Administration
Nested Queries
Cette page n'est pas encore disponible en français, sa traduction est en cours.
Si vous avez des questions ou des retours sur notre projet de traduction actuel, n'hésitez pas à nous contacter.
Si vous avez des questions ou des retours sur notre projet de traduction actuel, n'hésitez pas à nous contacter.
Overview
Join the Preview!
This feature is in Preview. To enable this feature, reach out to Customer Success.
By default, every metric query in Datadog consists of two layers of aggregation. Nested queries allows you to reuse the results of a previous query in a subsequent one.
Nested queries unlocks several powerful capabilities:
- Multilayer aggregation
- Percentiles and standard deviation on count/rate/gauge type metrics
- Higher resolution queries over historical timeframes
Multilayer aggregation
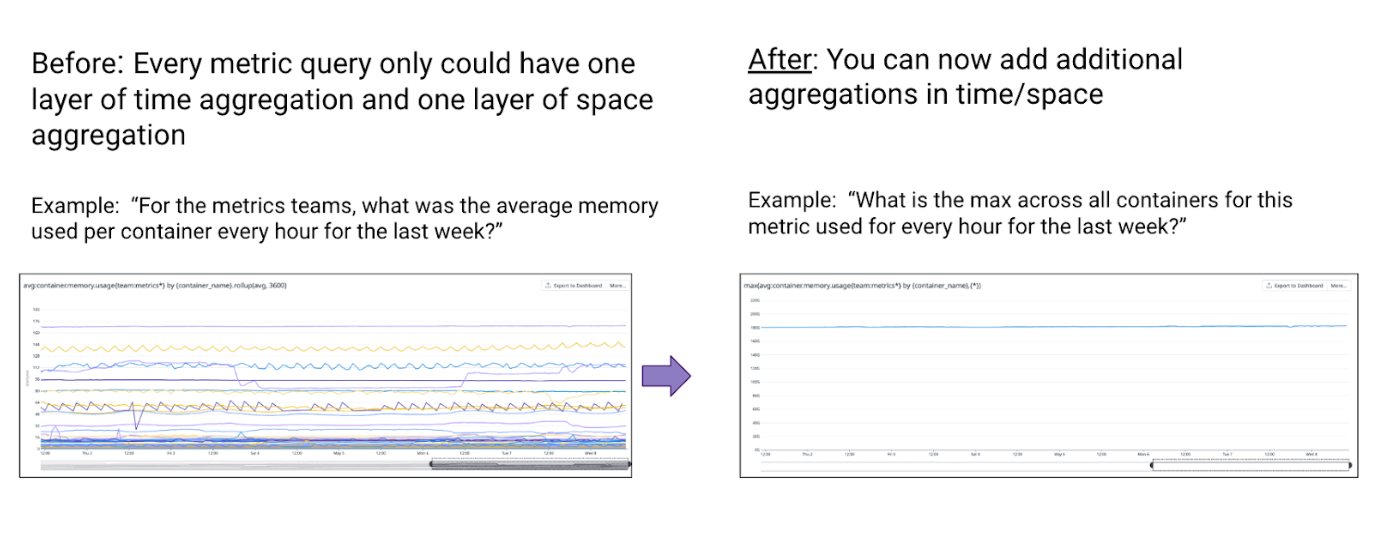
In Datadog, each metric query in Datadog is evaluated with two layers of aggregation: first by time, then by space. Multilayer aggregation allows you to apply additional layers of time or space aggregation. For more information on aggregation, see the anatomy of a metric’s query.
Multilayer time aggregation
Access multilayer time aggregation with the rollup function. Every metric query already contains an initial rollup (time aggregation) that controls the granularity of the data points displayed on the graph. For more information, see the Rollup documentation.
You can apply additional layers of time aggregation with subsequent rollups.
The first rollup supports the following aggregators:
avgsumminmaxcount
Additional layers provided by multilayer time aggregation supports the following time aggregators:
avgsumminmaxcountarbitrary percentile pxx(p78, p99, p99.99, etc.)stddev
Multilayer time aggregation can be used with the following functions:
| Supported Functions | Description |
|---|---|
| Arithmetic operators | +, -, *, / |
| Timeshift functions | <METRIC_NAME>{*}, -<TIME_IN_SECOND>hour_before(<METRIC_NAME>{*})day_before(<METRIC_NAME>{*})week_before(<METRIC_NAME>{*})month_before(<METRIC_NAME>{*}) |
| Top-k selection | top(<METRIC_NAME>{*}, <LIMIT_TO>, '<BY>', '<DIR>') |
Any functions not listed above cannot be combined with multilayer time aggregation.
Time aggregation example query
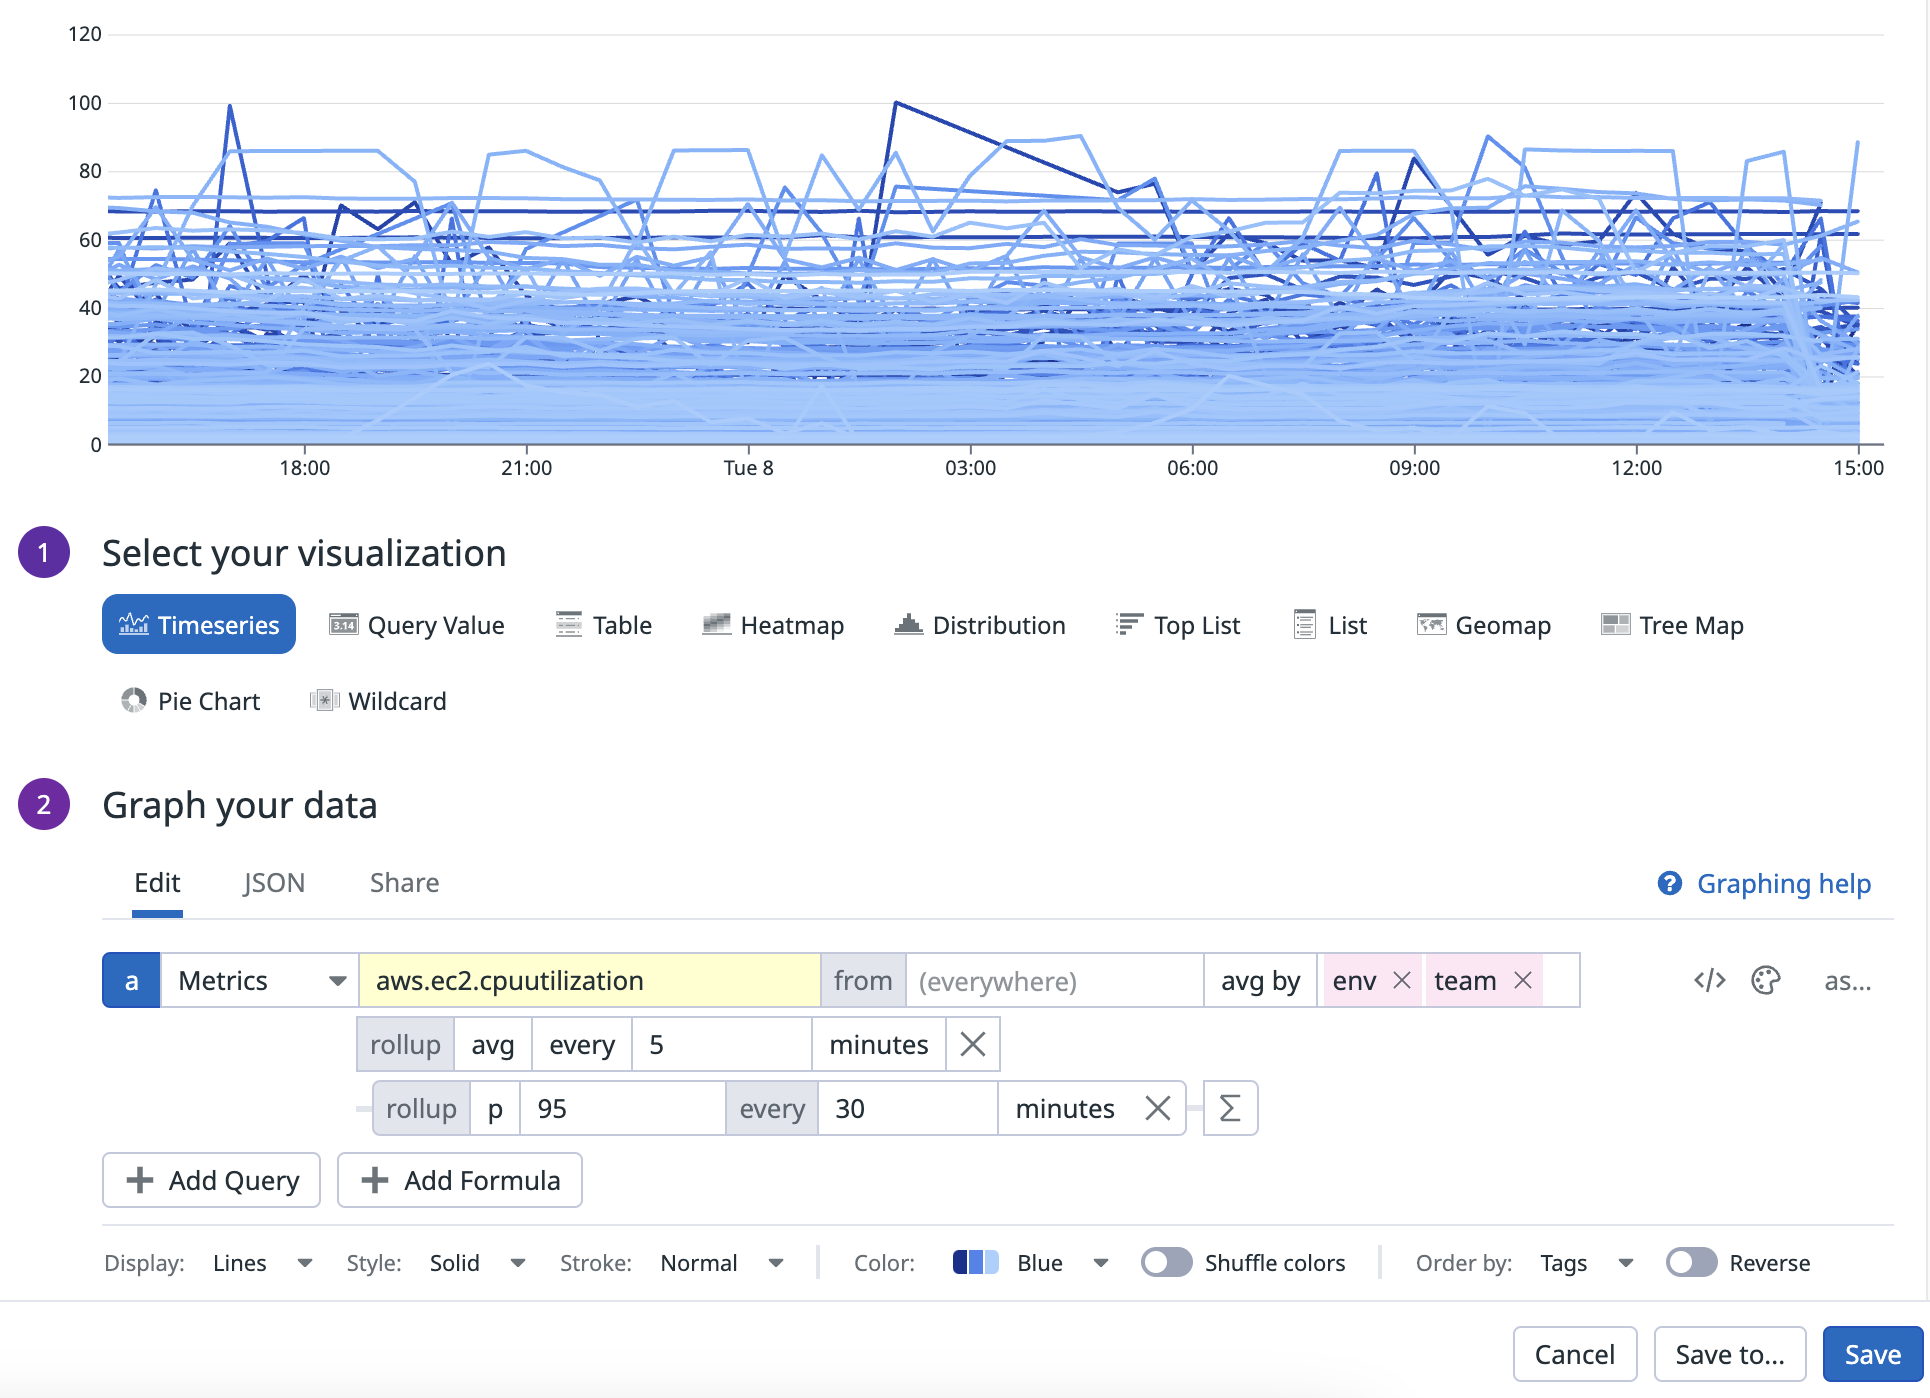
Time aggregation example query
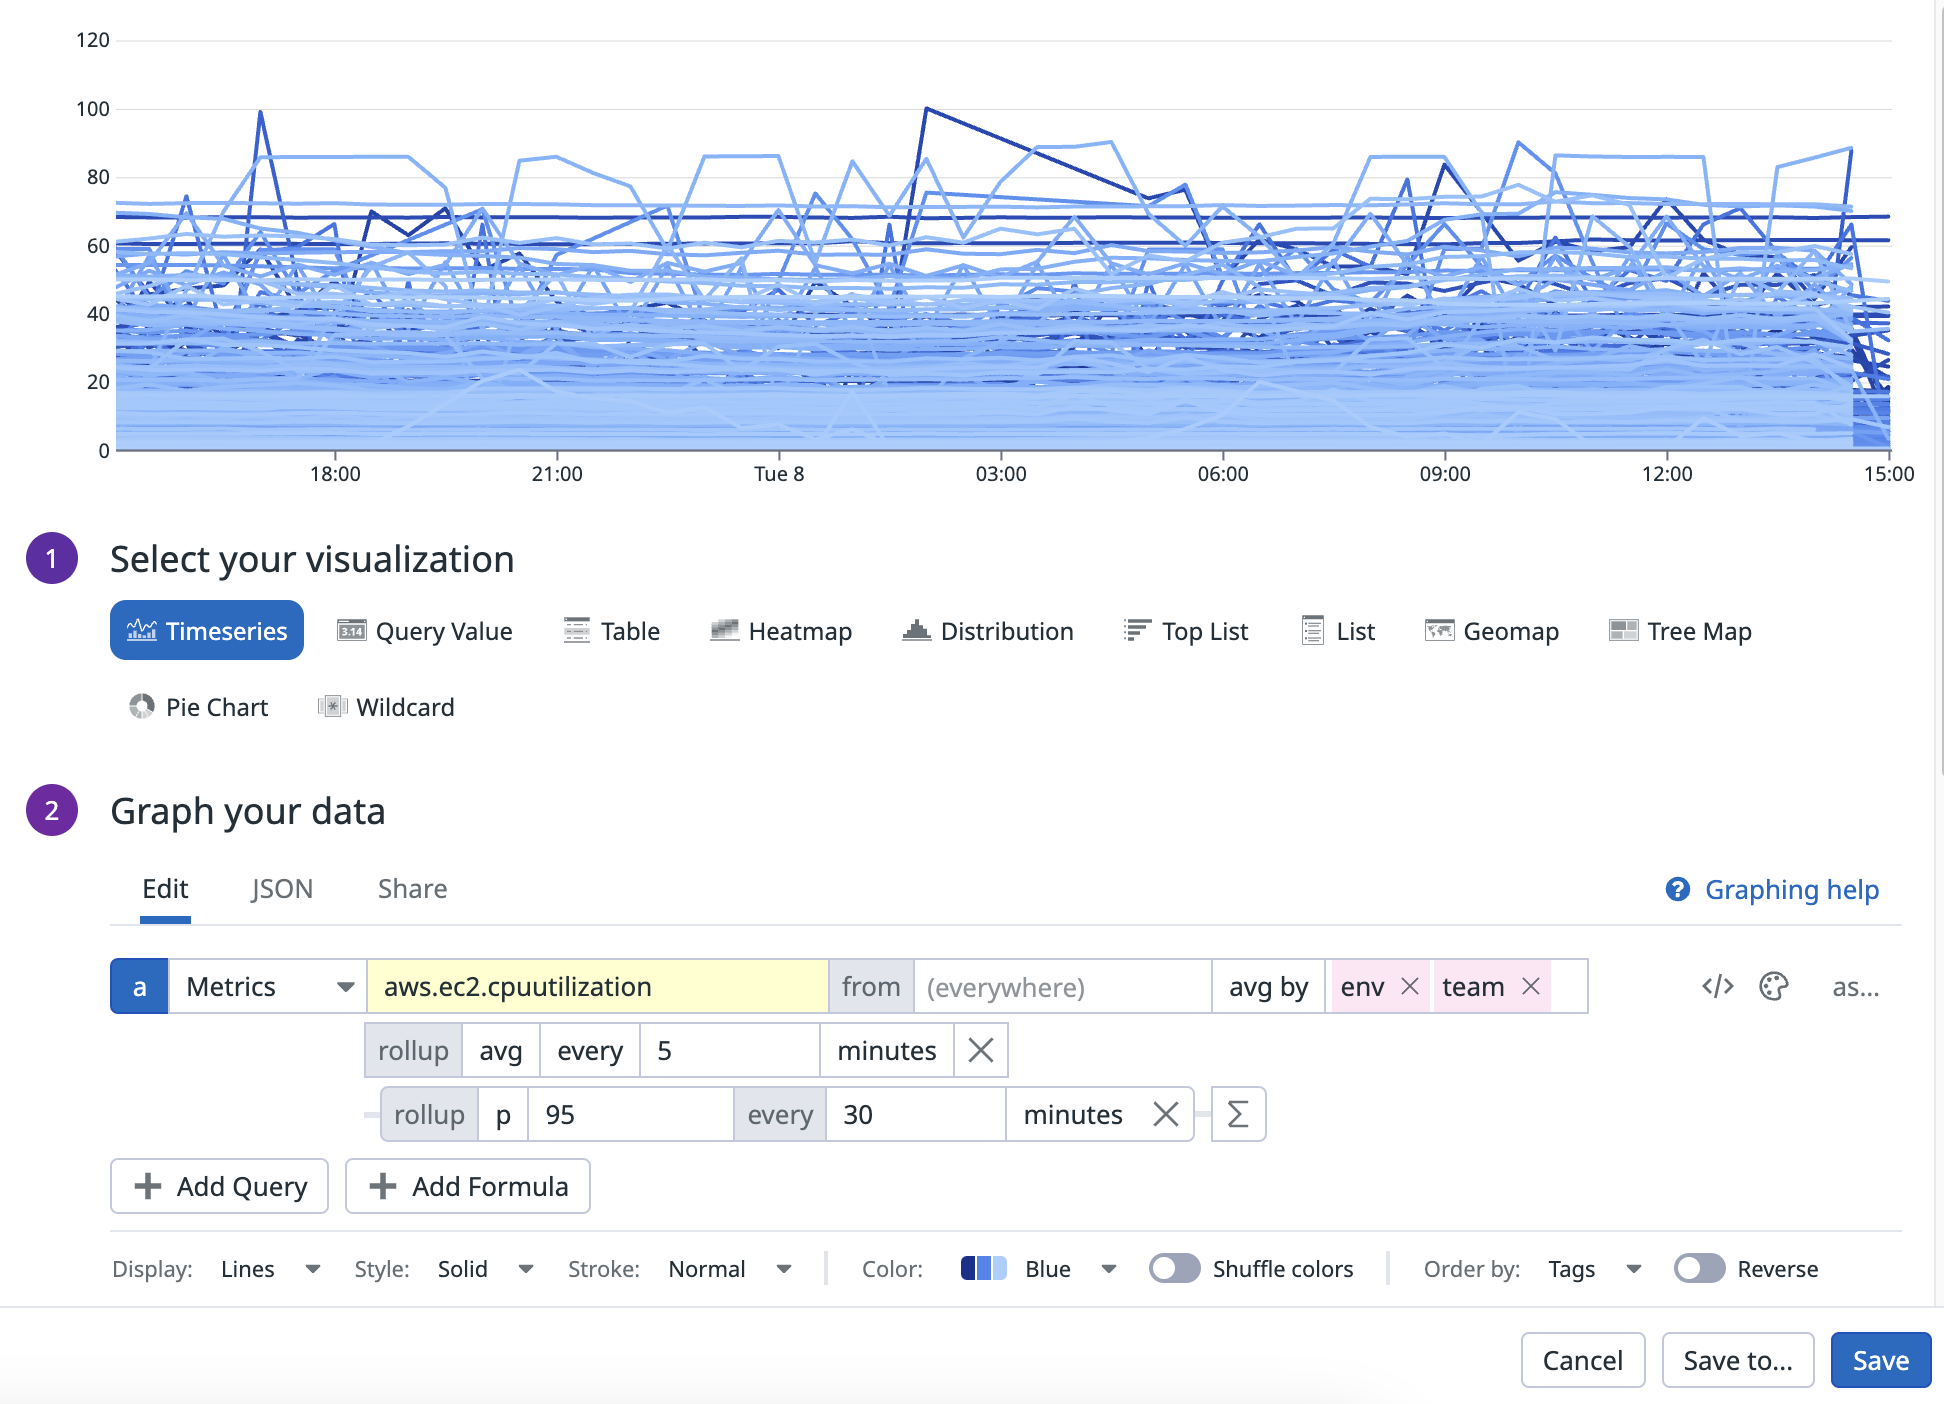
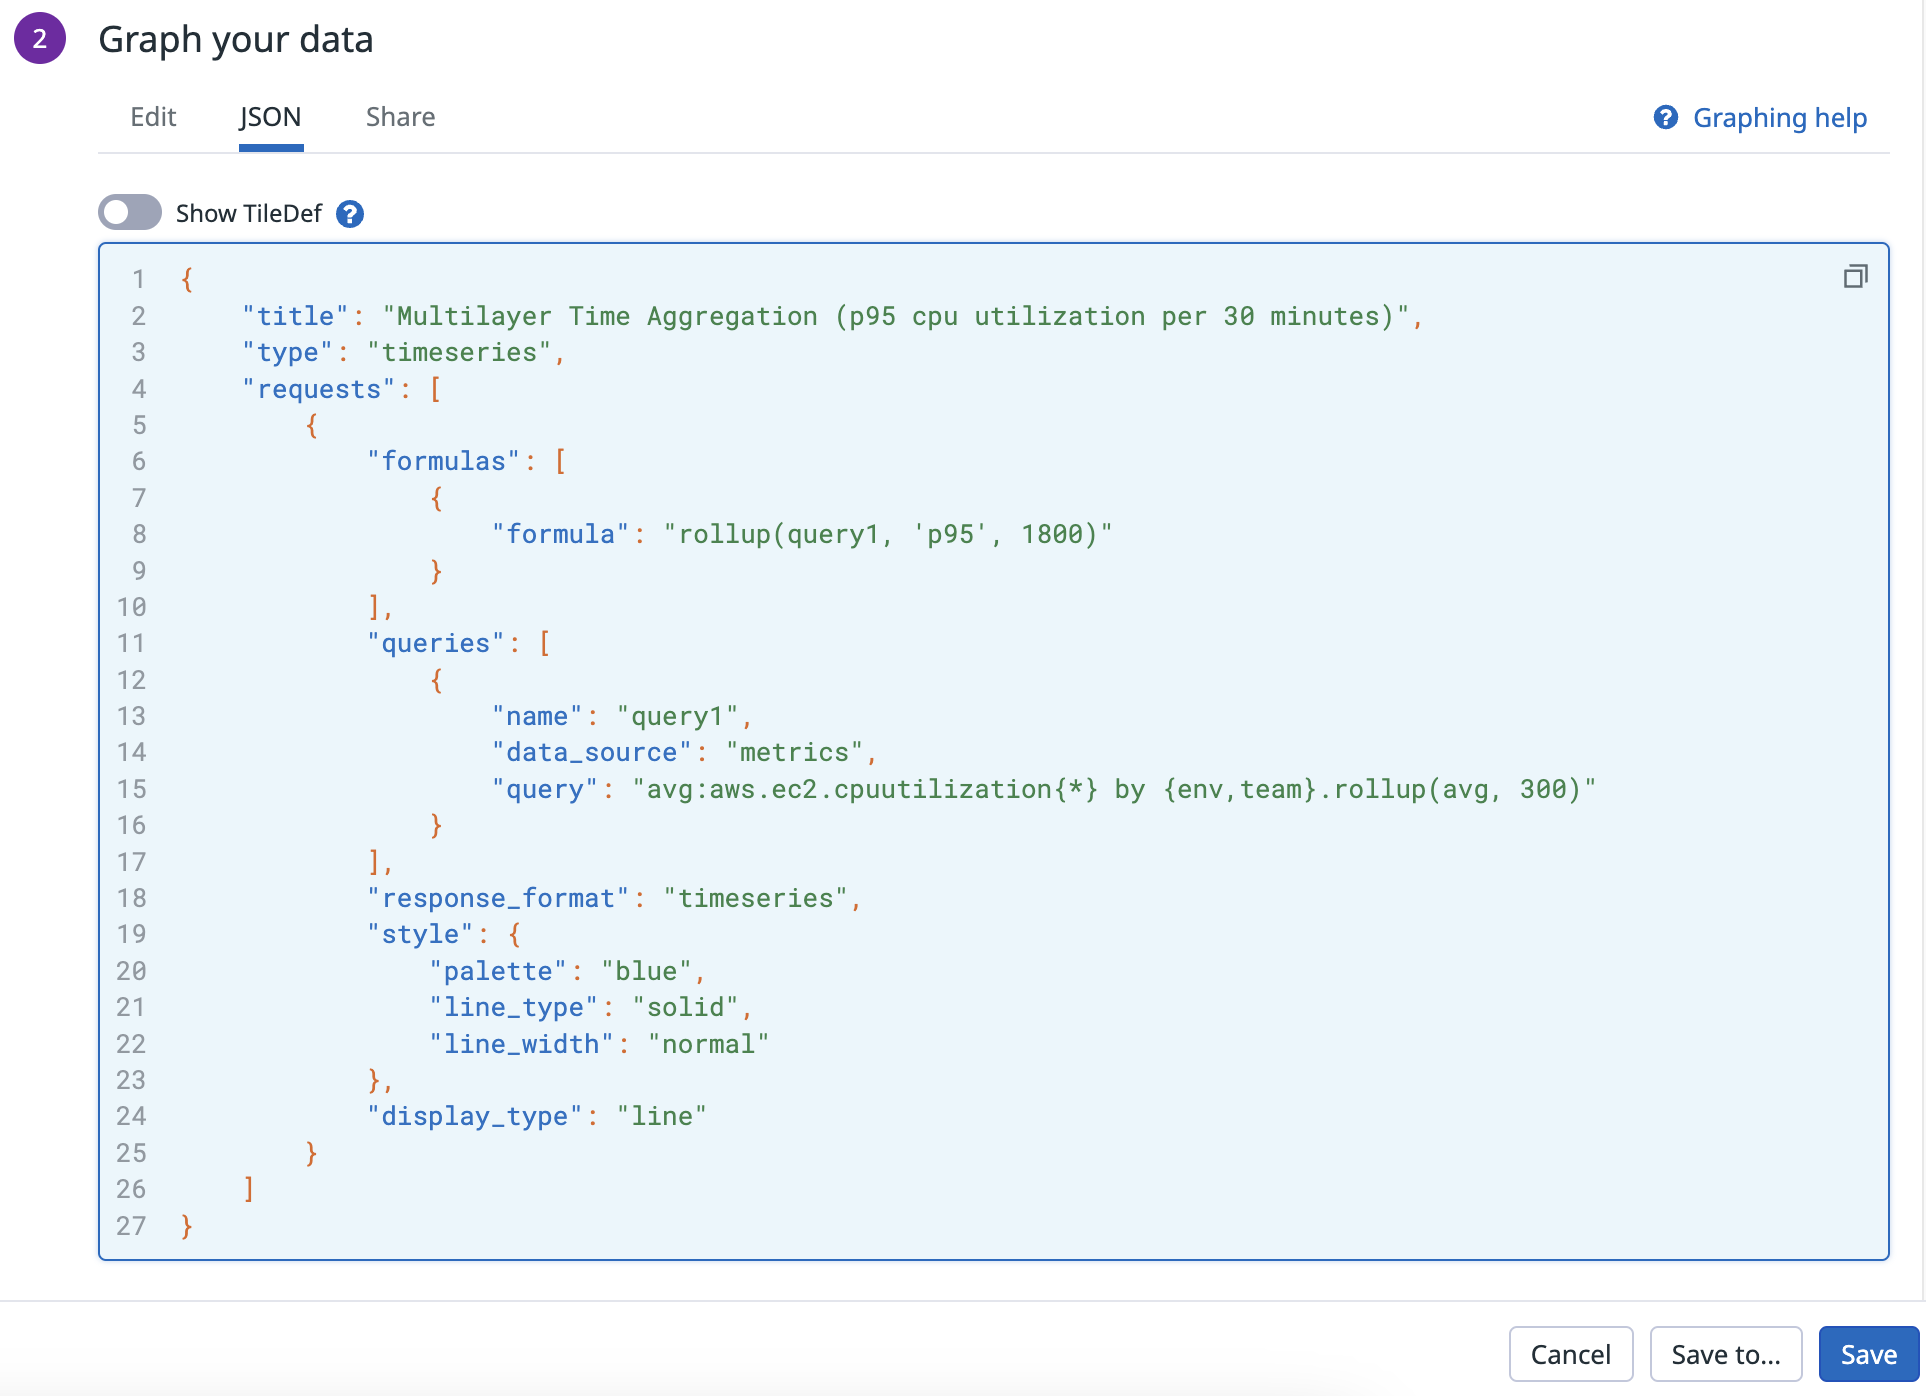
This query first calculates the average CPU utilization for each EC2 instance grouped by env and team, rolled up into 5-minute intervals. Then multilayer time aggregation is applied to calculate the 95th percentile in time of this nested query over 30m intervals.
Multilayer space aggregation
After you specify tag(s) in your first layer of space aggregation to group by, access multilayer space aggregation with the Group By function.
You can apply additional layers of space aggregation with subsequent Group Bys.
Note: if you do not specify tag(s) to group by in your initial space aggregation layer, multilayer space aggregation will not be available.
The first layer of space aggregation supports the following aggregators:
avg bysum bymin bymax by
Additional layers of space aggregation support:
avg bysum bymin bymax byarbitrary percentile pXX(p75, p99, p99.99, etc.)stddev by
Multilayer space aggregation can be used with the following functions:
| Supported Functions | Description |
|---|---|
| Arithmetic operators | +, -, *, / |
| Timeshift functions | <METRIC_NAME>{*}, -<TIME_IN_SECOND>hour_before(<METRIC_NAME>{*})day_before(<METRIC_NAME>{*})week_before(<METRIC_NAME>{*})month_before(<METRIC_NAME>{*}) |
| Top-k selection | top(<METRIC_NAME>{*}, <LIMIT_TO>, '<BY>', '<DIR>') |
Any other functions not listed above cannot be combined with multilayer space aggregation.
All space aggregators with the exception of percentile space aggregators have one argument, which is the tag key(s) you want to group by. Percentile space aggregators require two arguments:
- The arbitrary percentile pXX
- The tag(s) to group by
Space aggregation example queries
Space aggregation example queries
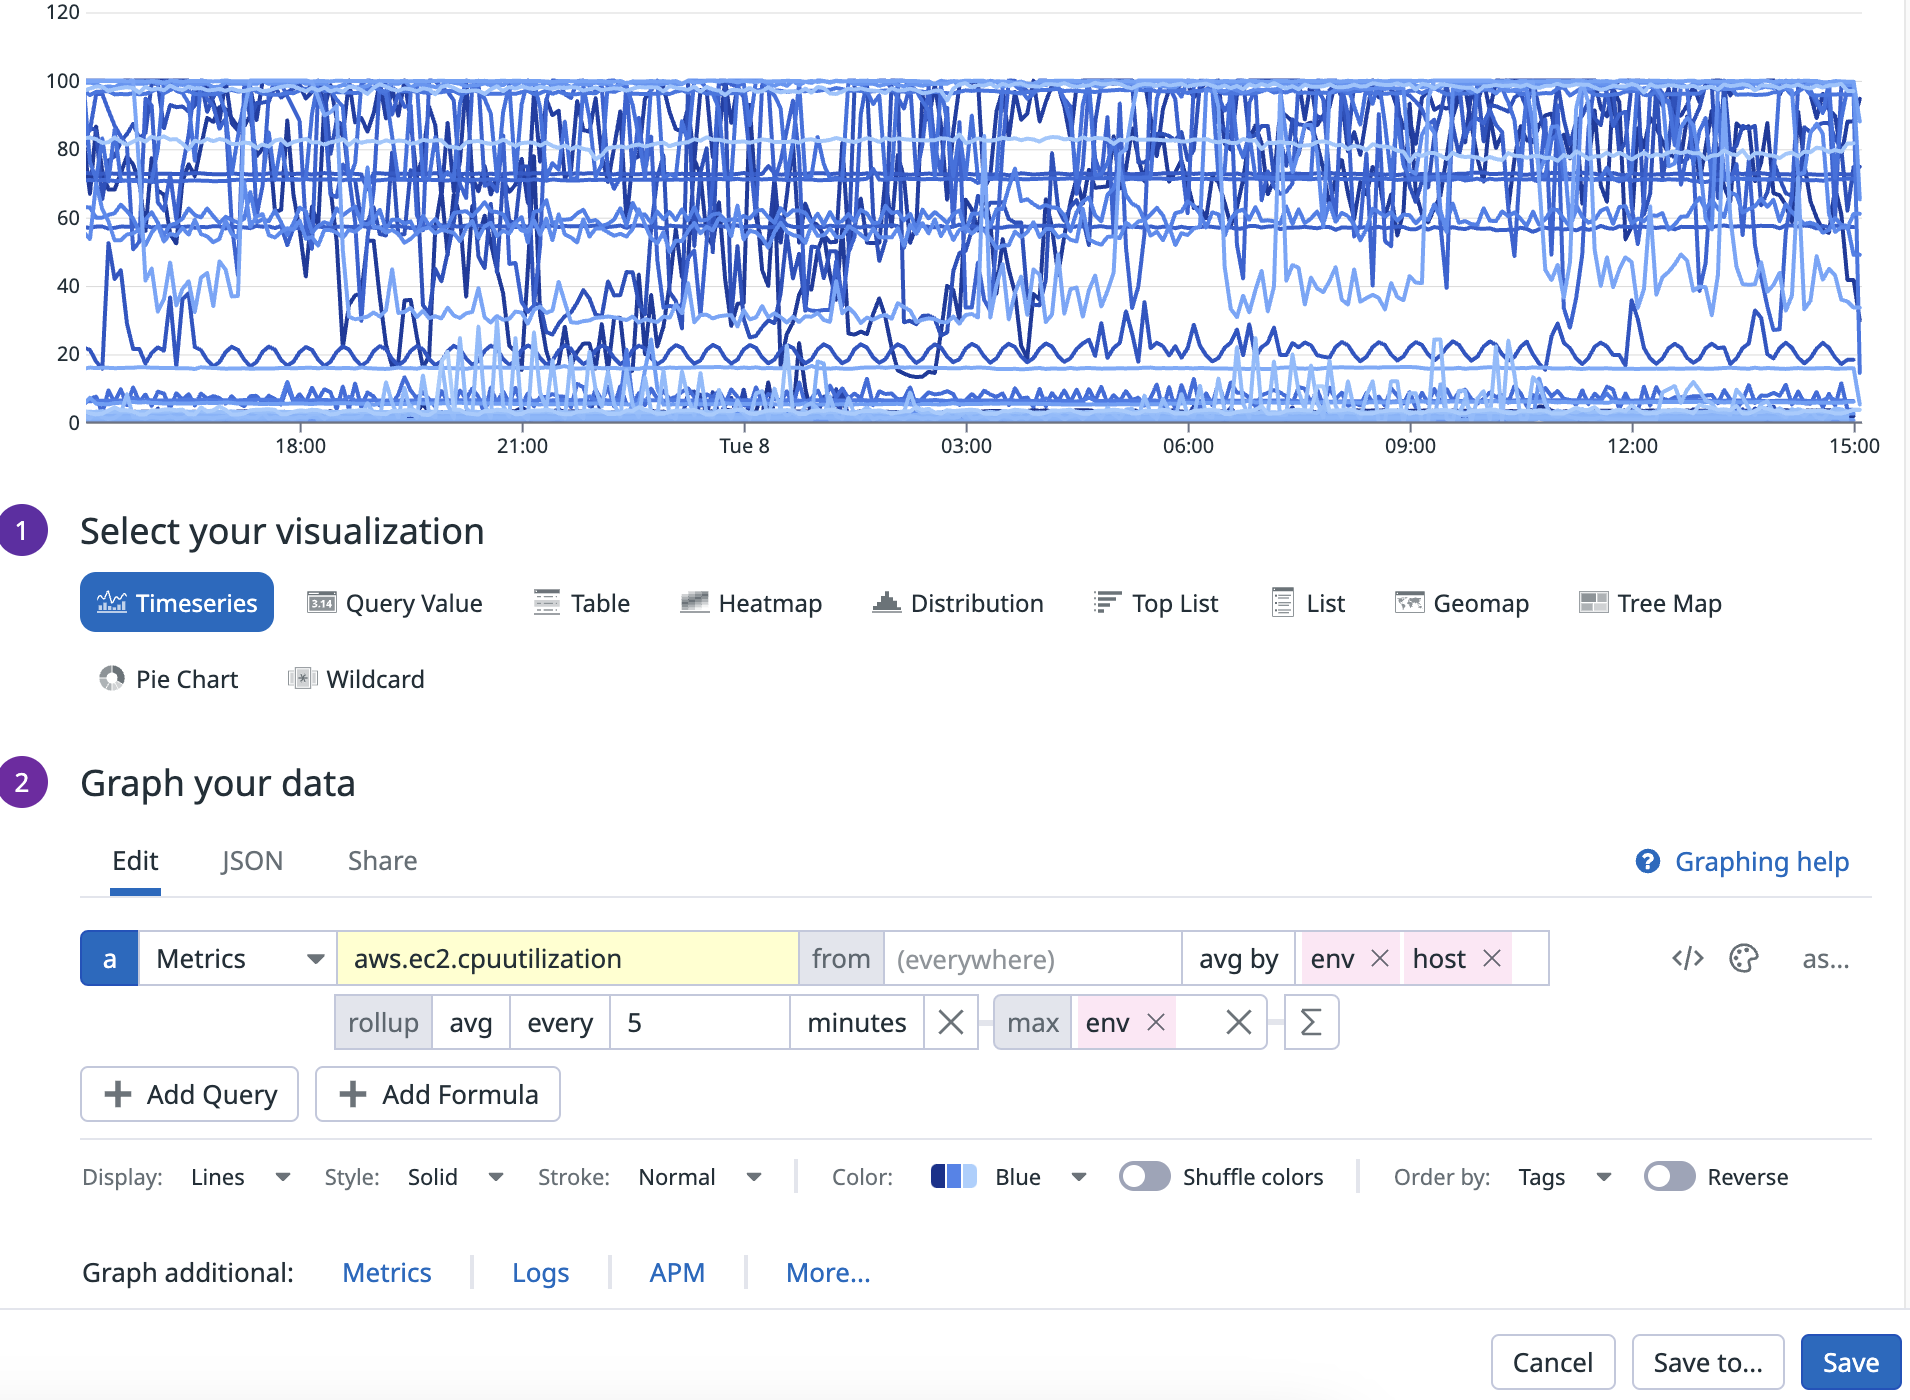
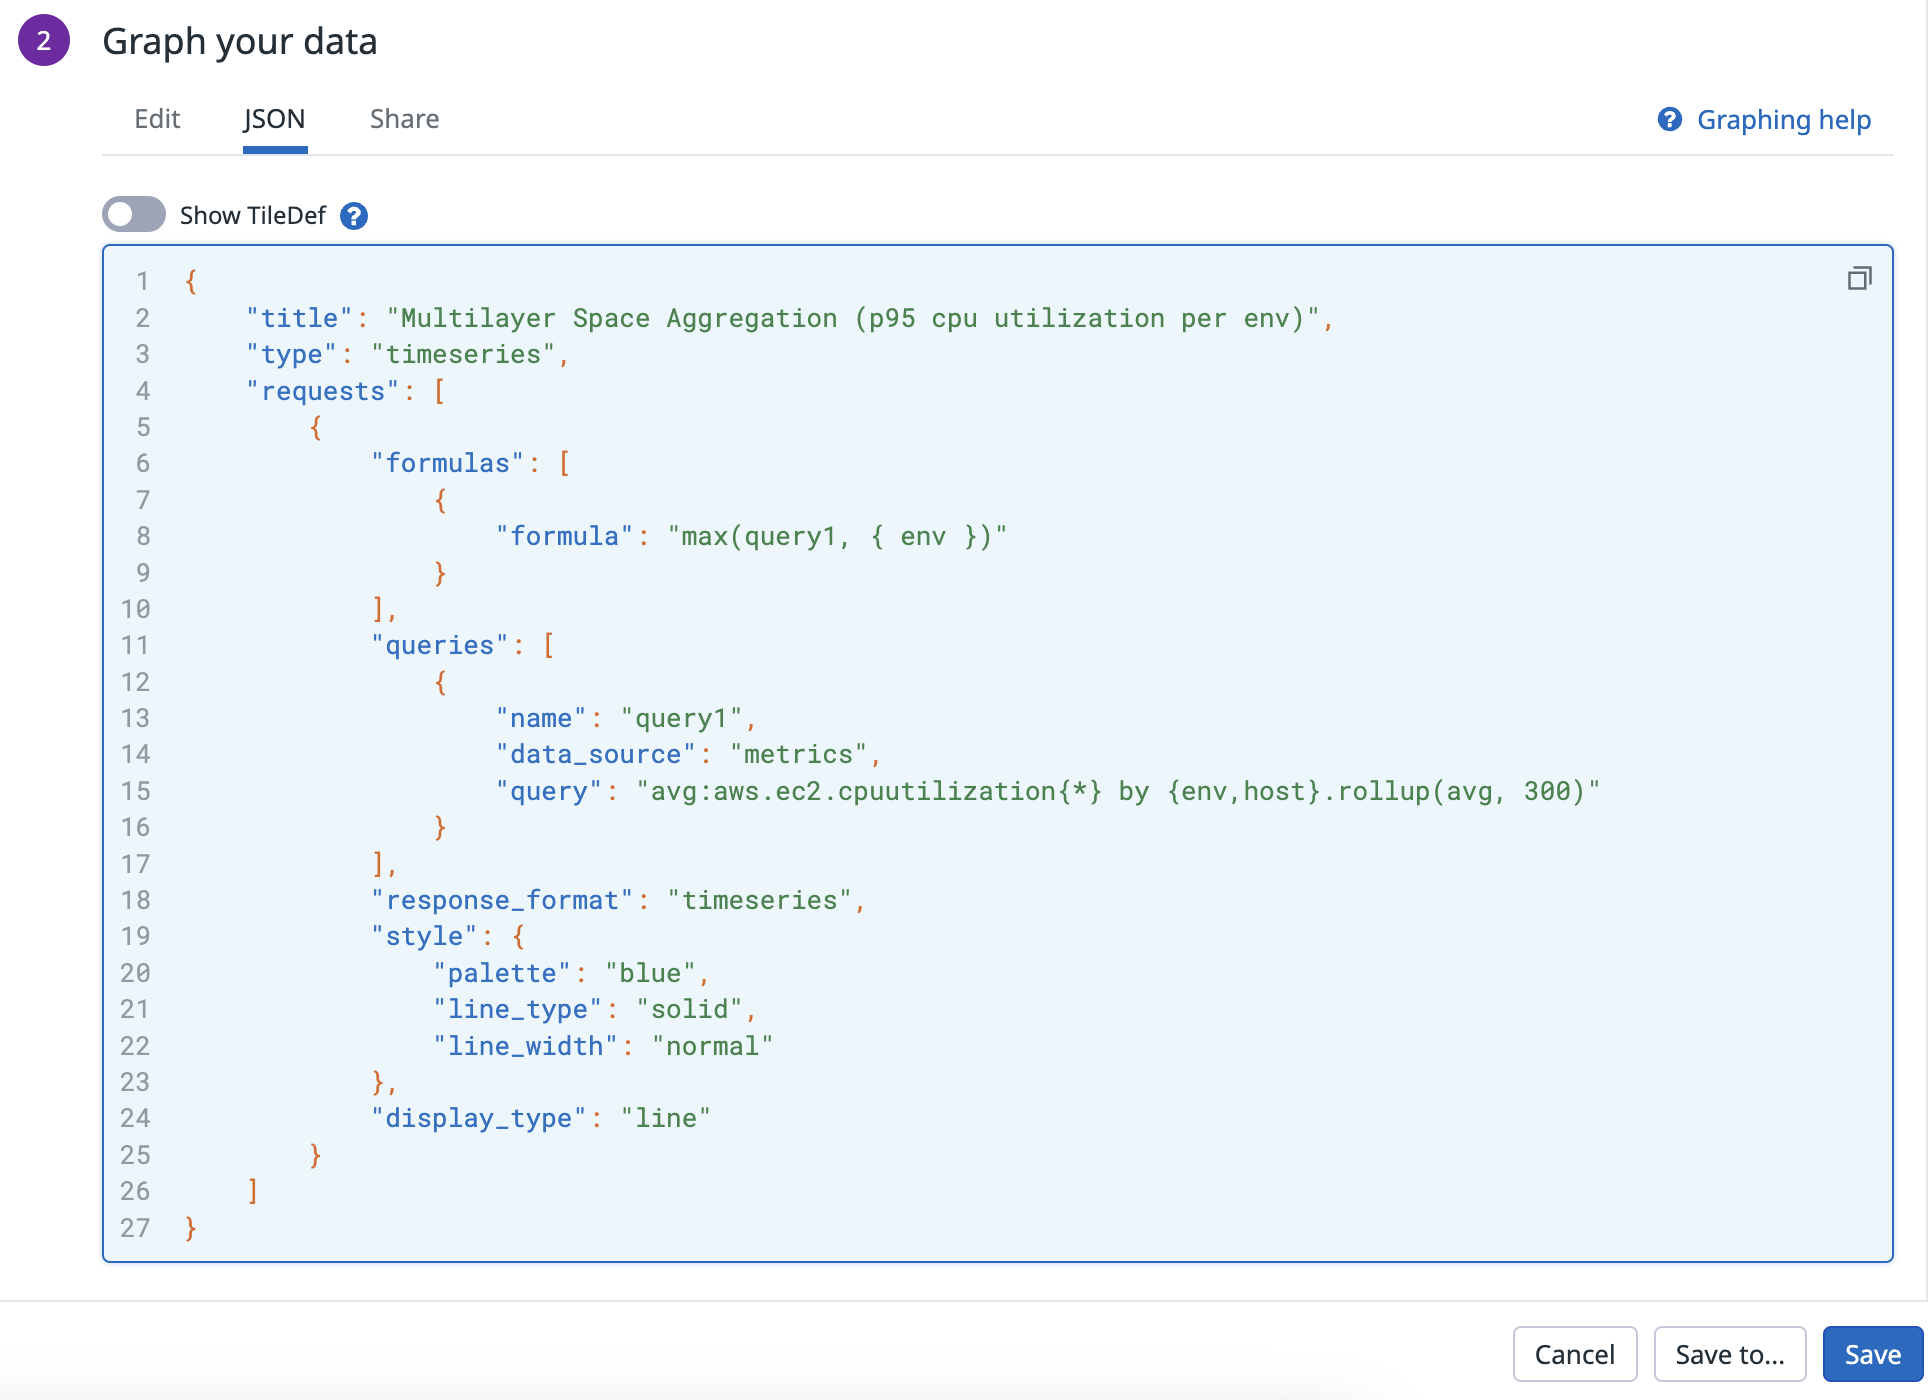
This initial query, avg:aws.ec2.cpuutilization{*} by {env,host}.rollup(avg, 300) calculates the sum of average CPU utilization, grouped by env and host every 5 minutes. Then multilayer space aggregation is applied to calculate maximum value of the average CPU utilization by env.
In the UI or JSON tab, it would look as follows:
Percentiles and Standard Deviation for aggregated counts, rates, and gauges
You can use multilayer aggregation (time and space) to query percentiles and standard deviation from queries on counts, rates, and gauges. They allow you to better understand the variability and spread of your large datasets and allow you to better identify outliers.
Note: The percentile or standard deviation aggregators in Nested queries are calculated using the results of an existing, aggregated count, rate, or gauge metrics. For globally accurate percentiles that are computed on unaggregated, raw values of a metric, use distribution metrics instead.
Percentiles in Multilayer Time Aggregation example query
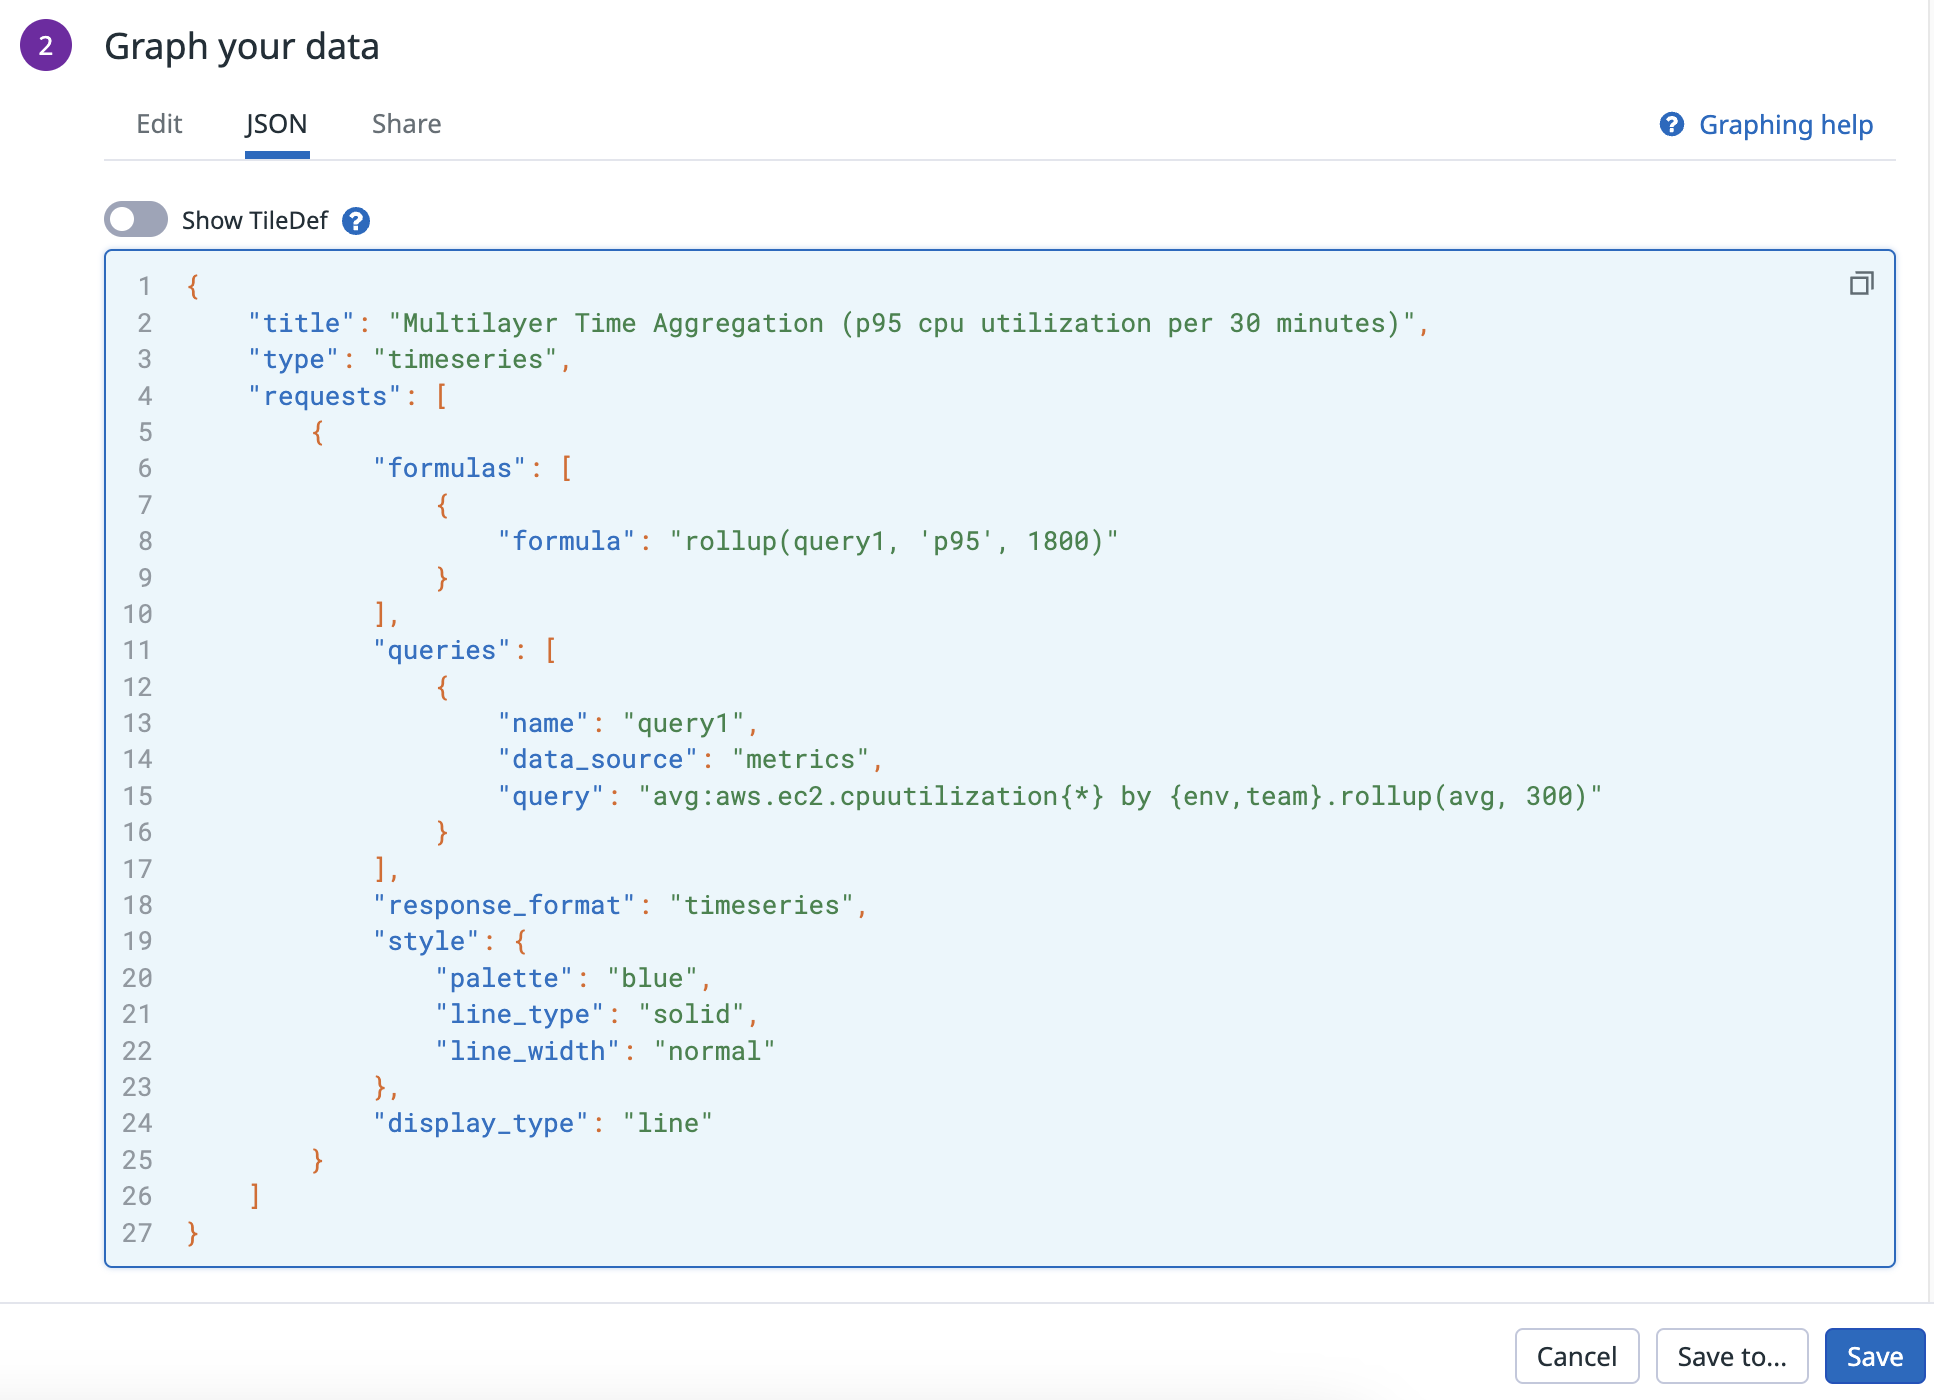
Percentiles in Multilayer Time Aggregation example query
We can use percentiles in multilayer time aggregation to summarize the results of our nested query (avg CPU utilization by env and team every 5 minutes) by calculating the p95th value of this nested query every 30 minutes.
Percentiles in Multilayer Space Aggregation example query
Percentiles in Multilayer Space Aggregation example query
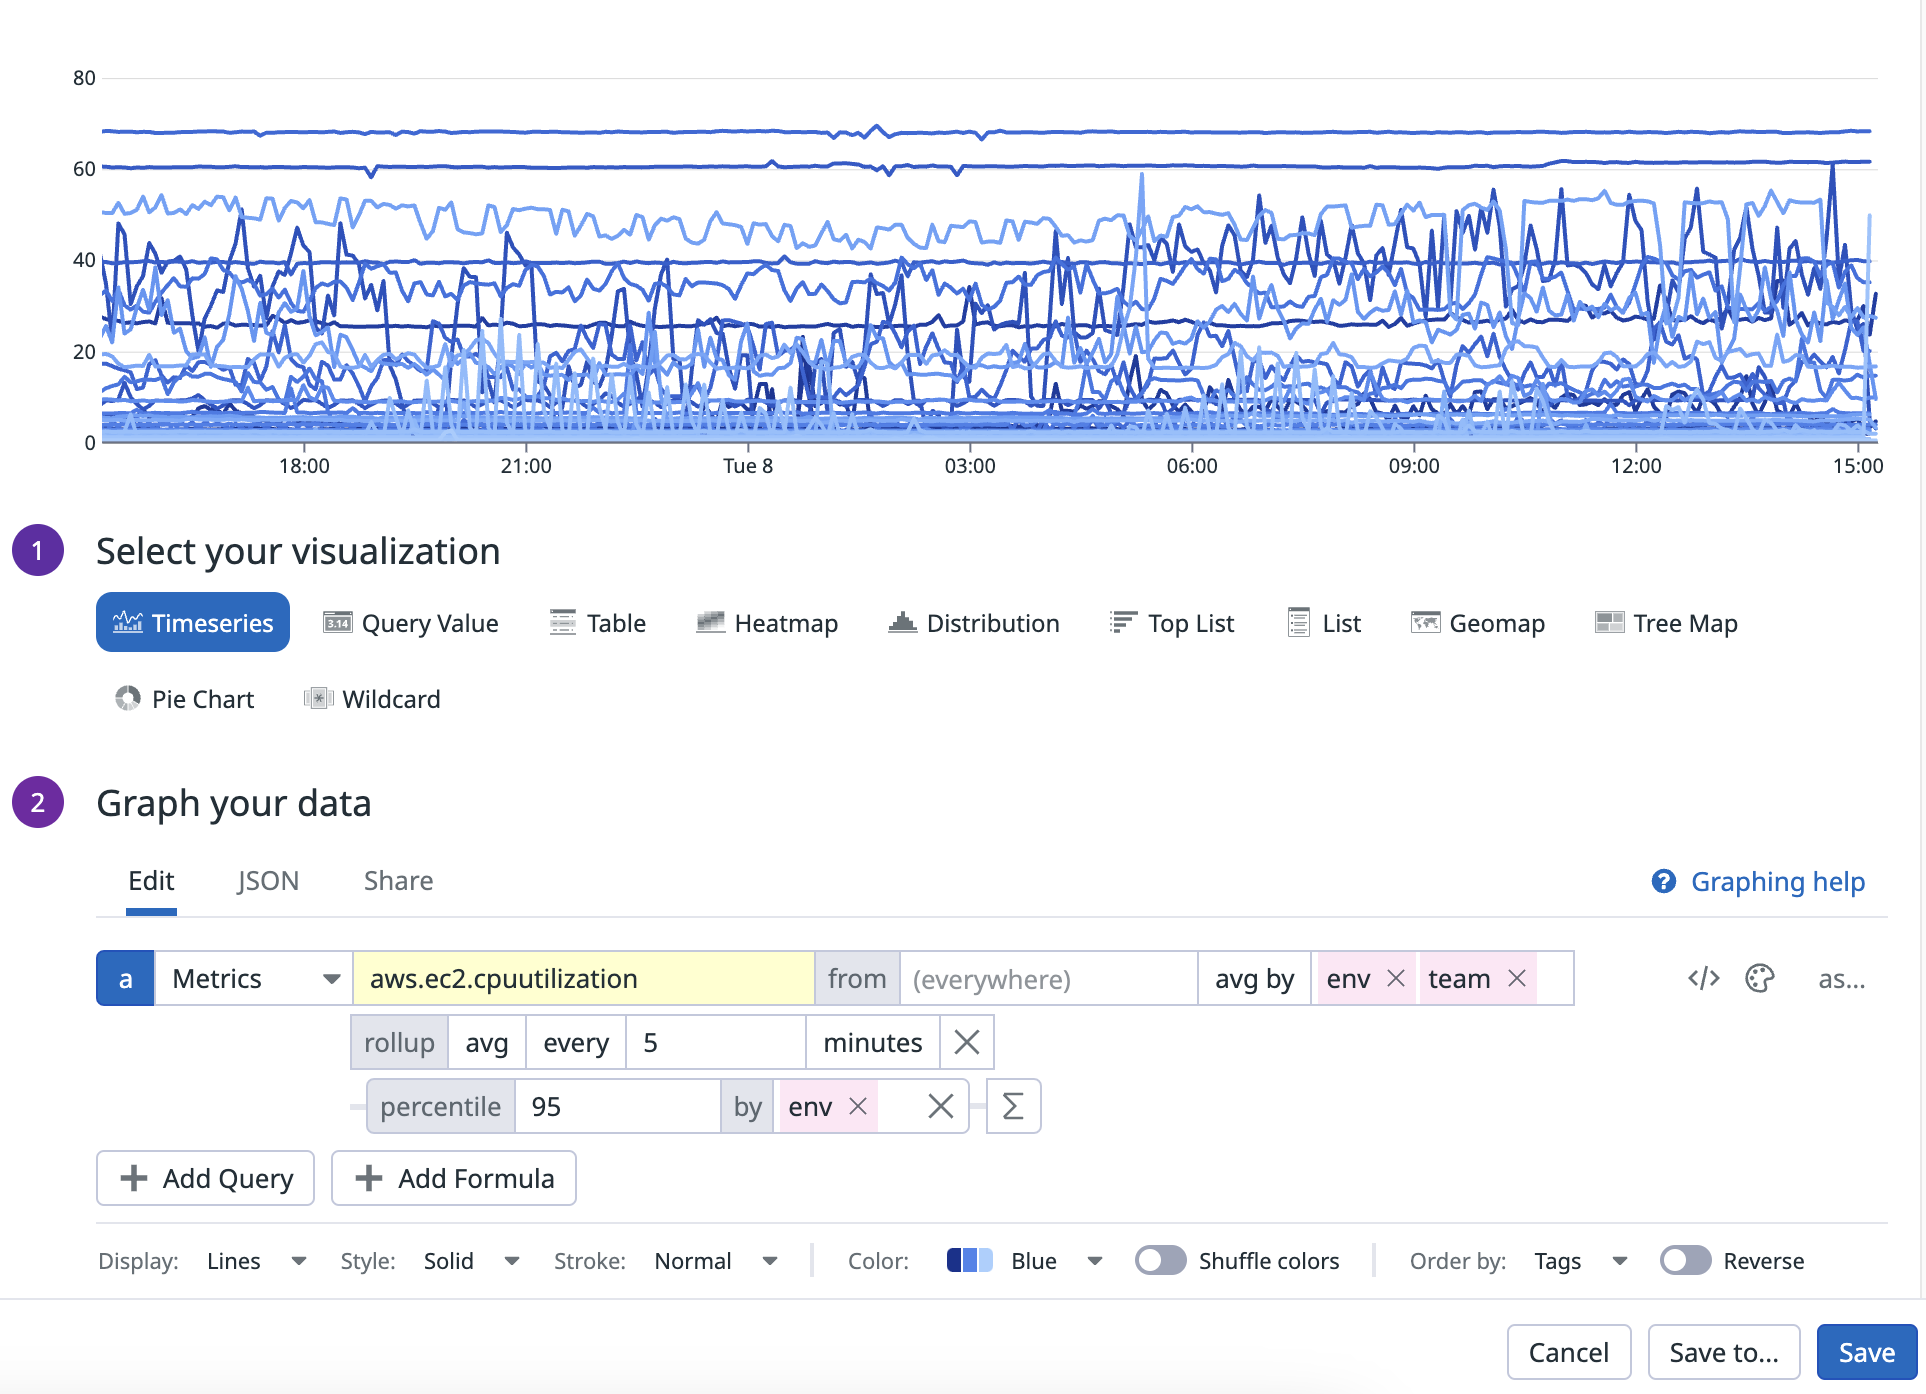
We can use percentiles in multilayer space aggregation to summarize the results of our nested query (avg CPU utilization by env and team every 5 minutes) by calculating the p95th value of this nested query for every unique env value.
In the UI or JSON tab, it would look as follows:
Standard deviation example query
Standard deviation example query
Standard deviation helps measure the variability or dispersion of a dataset. The following query uses standard deviation with multilayer time aggregation to calculate the standard deviation of our nested query (sum of API request counts, averaged over 4 hour) over longer twelve-hour periods:
In the UI or JSON tab, it would look as follows:
Higher resolution queries over historical time frames
Every metric query contains an initial layer of time aggregation (rollup) which controls the granularity of datapoints shown. Datadog provides default rollup time intervals that increase as your overall query timeframe grows. With nested queries, you can access more granular, high-resolution data over longer, historical timeframes.
Higher resolution example query
Higher resolution example query
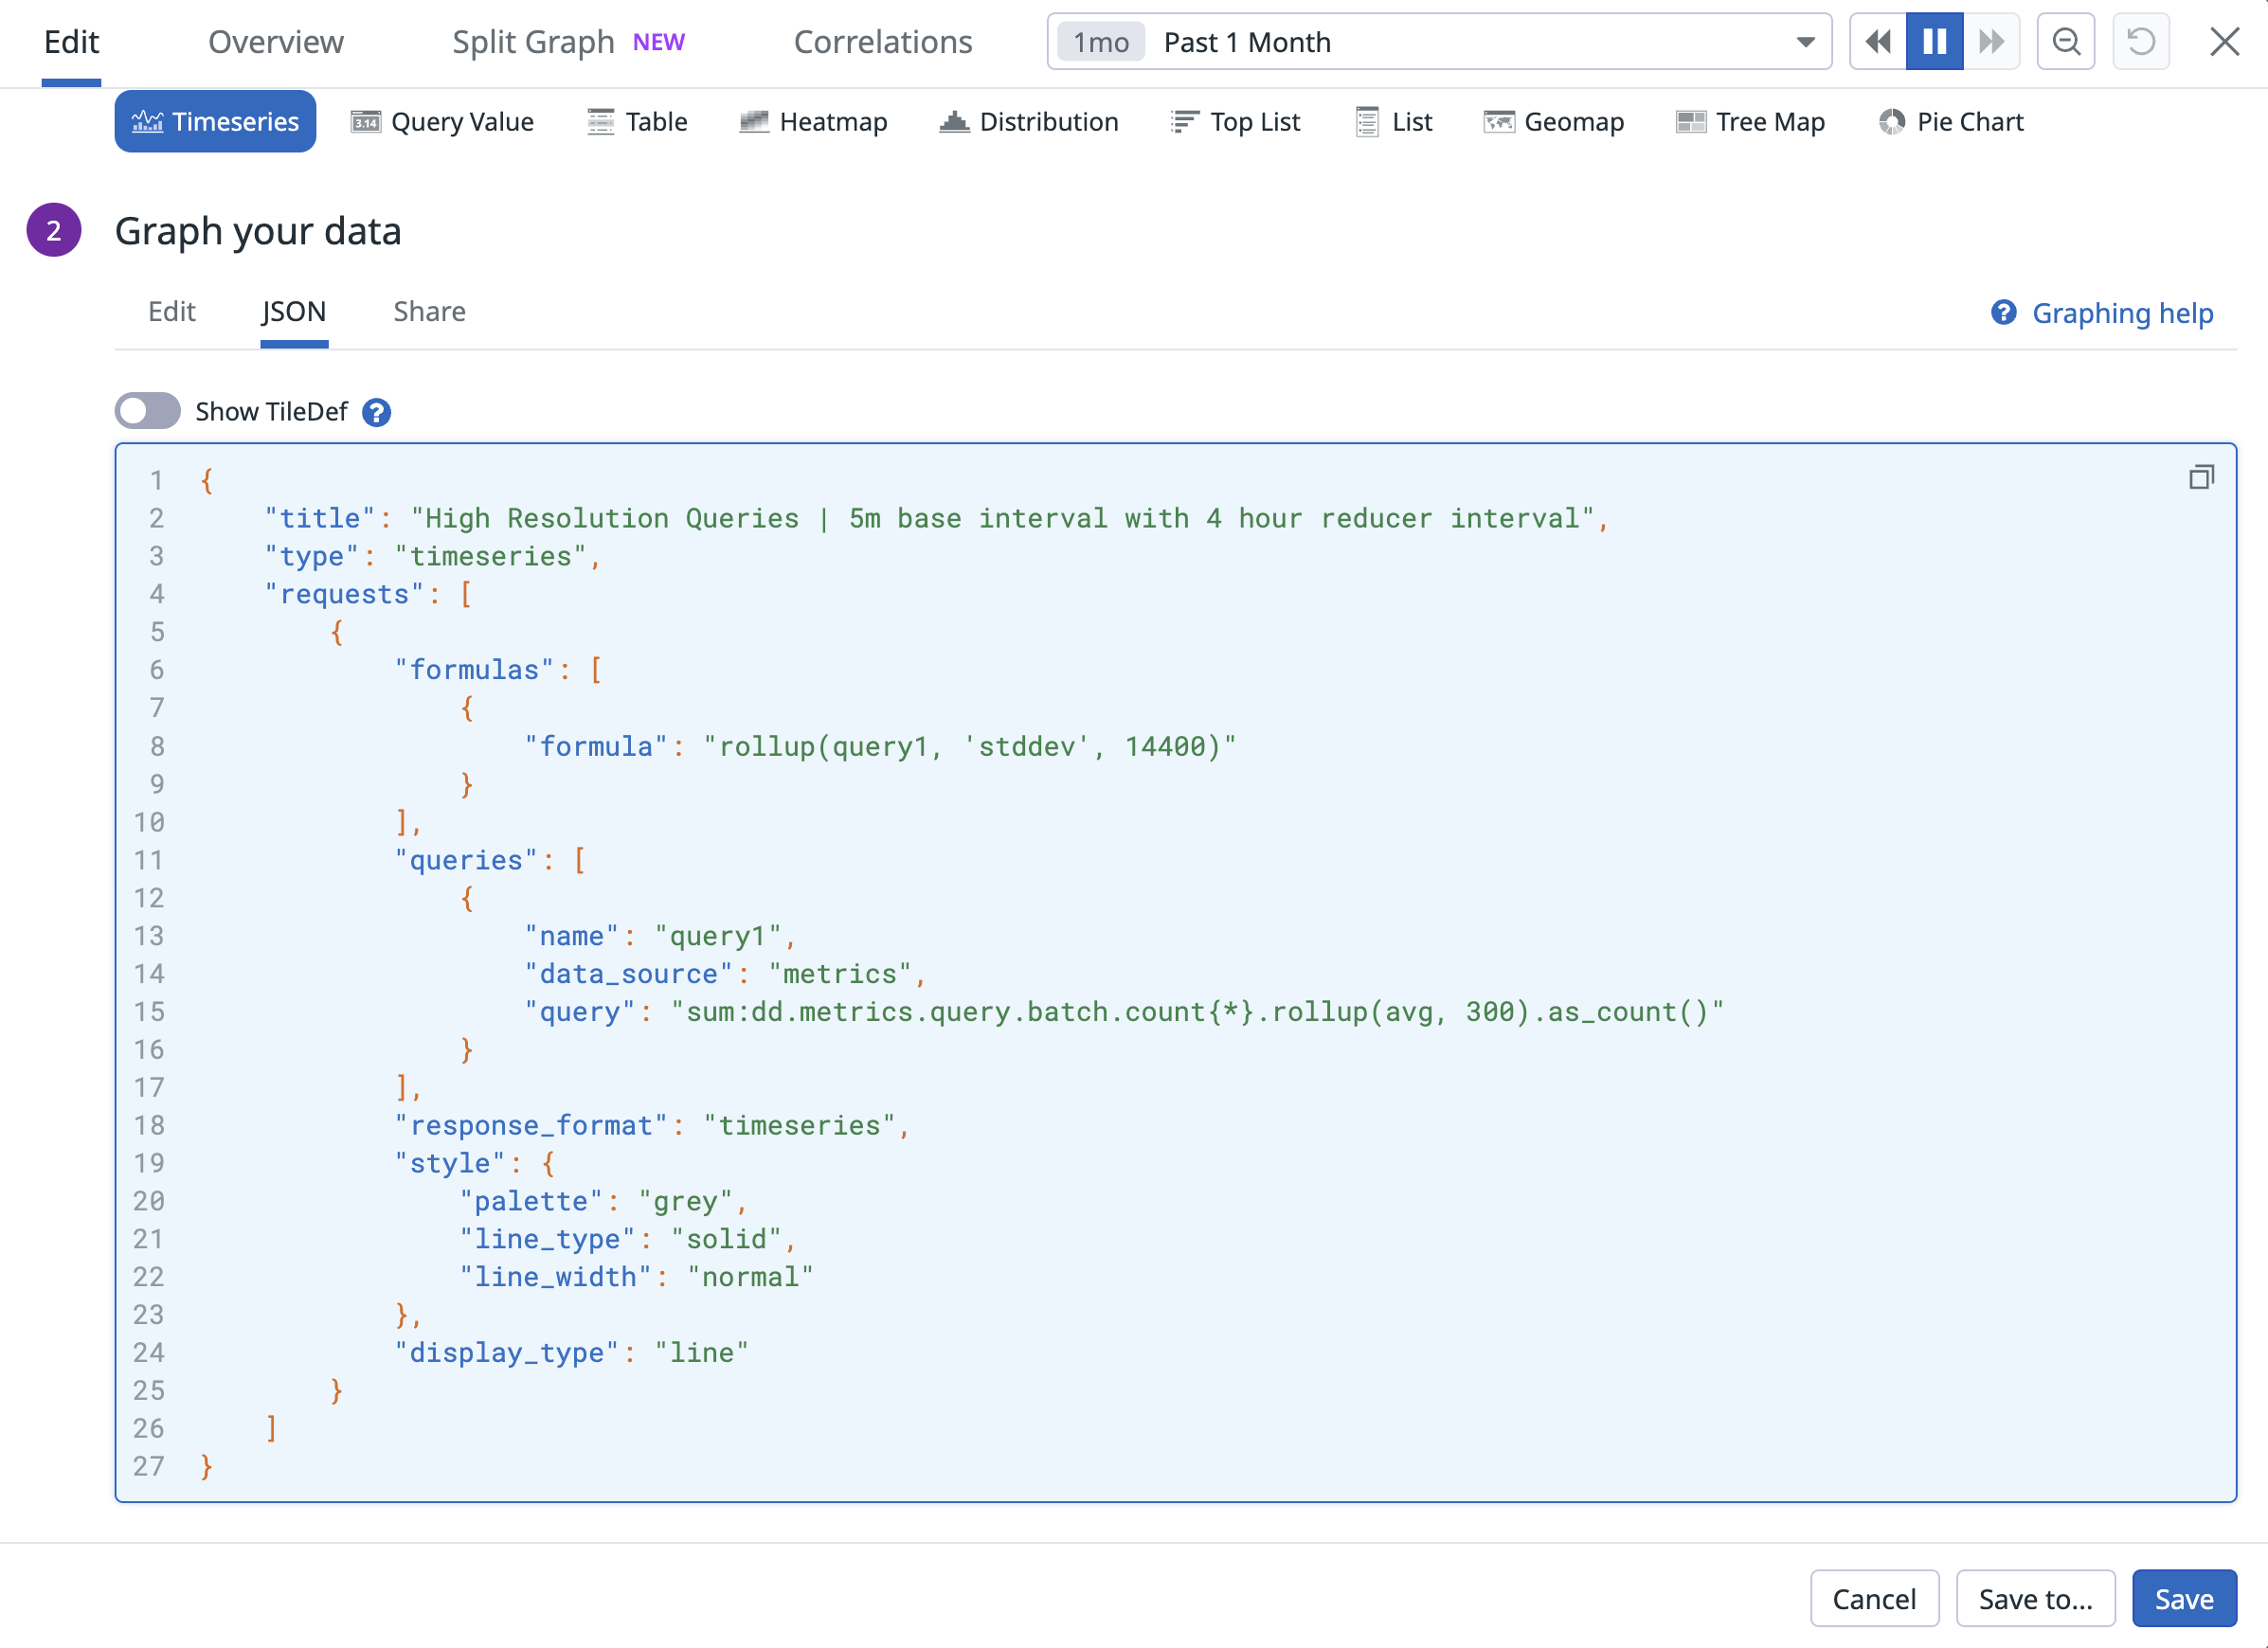
Historically, when querying a metric over the past month, you would see data at 4-hour granularity by default. You can use nested queries to access higher granularity data over this historical timeframe. Here’s an example query graphed over the past month where the query batch count is initially rolled up in 5 minute intervals. Then multilayer time aggregation is applied to calculate the standard deviation in time of this nested query over 4 hour intervals for a more human-readable graph.
Note: Datadog recommends that you define your initial rollup with the most granular rollup interval and use multilayer time aggregation with coarser rollup intervals to get more user-readable graphs.
In the UI or JSON tab, it would look as follows:
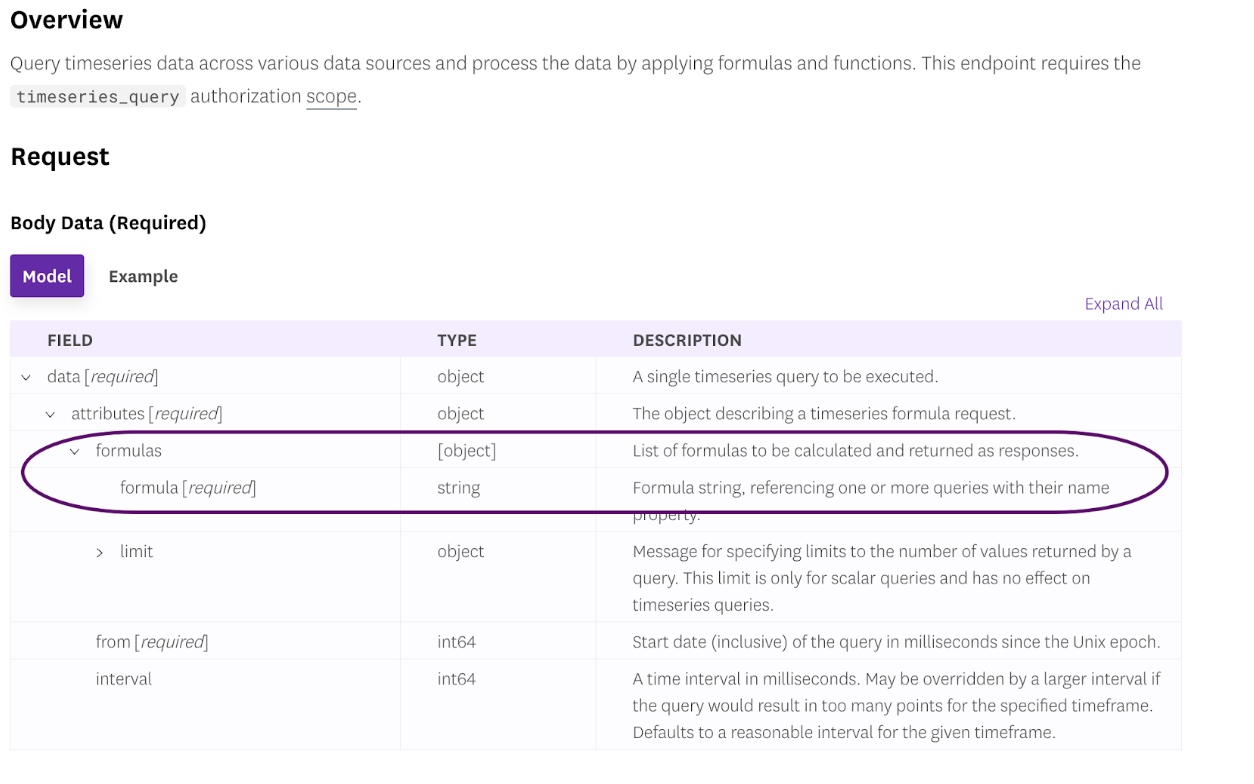
Use nested queries with Datadog’s API
You can use nested queries functionality in our public API for querying timeseries data. Change the contents of the formula object
Further reading
Documentation, liens et articles supplémentaires utiles:
