- Principales informations
- Getting Started
- Datadog
- Site Datadog
- DevSecOps
- Serverless for AWS Lambda
- Agent
- Intégrations
- Conteneurs
- Dashboards
- Monitors
- Logs
- Tracing
- Profileur
- Tags
- API
- Service Catalog
- Session Replay
- Continuous Testing
- Surveillance Synthetic
- Incident Management
- Database Monitoring
- Cloud Security Management
- Cloud SIEM
- Application Security Management
- Workflow Automation
- CI Visibility
- Test Visibility
- Intelligent Test Runner
- Code Analysis
- Learning Center
- Support
- Glossary
- Standard Attributes
- Guides
- Agent
- Intégrations
- OpenTelemetry
- Développeurs
- Authorization
- DogStatsD
- Checks custom
- Intégrations
- Create an Agent-based Integration
- Create an API Integration
- Create a Log Pipeline
- Integration Assets Reference
- Build a Marketplace Offering
- Create a Tile
- Create an Integration Dashboard
- Create a Recommended Monitor
- Create a Cloud SIEM Detection Rule
- OAuth for Integrations
- Install Agent Integration Developer Tool
- Checks de service
- IDE Plugins
- Communauté
- Guides
- API
- Application mobile
- CoScreen
- Cloudcraft
- In The App
- Dashboards
- Notebooks
- DDSQL Editor
- Alertes
- Infrastructure
- Métriques
- Watchdog
- Bits AI
- Service Catalog
- API Catalog
- Error Tracking
- Service Management
- Infrastructure
- Universal Service Monitoring
- Conteneurs
- Sans serveur
- Surveillance réseau
- Cloud Cost
- Application Performance
- APM
- Profileur en continu
- Database Monitoring
- Agent Integration Overhead
- Setup Architectures
- Configuration de Postgres
- Configuration de MySQL
- Configuration de SQL Server
- Setting Up Oracle
- Setting Up MongoDB
- Connecting DBM and Traces
- Données collectées
- Exploring Database Hosts
- Explorer les métriques de requête
- Explorer des échantillons de requêtes
- Dépannage
- Guides
- Data Streams Monitoring
- Data Jobs Monitoring
- Digital Experience
- RUM et Session Replay
- Product Analytics
- Surveillance Synthetic
- Continuous Testing
- Software Delivery
- CI Visibility
- CD Visibility
- Test Visibility
- Exécuteur de tests intelligent
- Code Analysis
- Quality Gates
- DORA Metrics
- Securité
- Security Overview
- Cloud SIEM
- Cloud Security Management
- Application Security Management
- AI Observability
- Log Management
- Pipelines d'observabilité
- Log Management
- Administration
Examples
Cette page n'est pas encore disponible en français, sa traduction est en cours.
Si vous avez des questions ou des retours sur notre projet de traduction actuel, n'hésitez pas à nous contacter.
Si vous avez des questions ou des retours sur notre projet de traduction actuel, n'hésitez pas à nous contacter.
Overview
Use Downtimes to eliminate unnecessary alerts during scheduled maintenance, testing, or auto-scaling events. Use the Downtime API to manage advanced maintenance schedules format, or to dynamically mute monitors, for example when resizing cloud instances.
This guide describes how to configure downtimes for the following use cases:
- Downtime over the weekend
- Downtime outside of business hours
- Recurring downtime on nth weekday of the month
Prerequisites
Since this guide describes the usage of the API, you will need an API key and an application key with admin privileges. These are available in your Datadog account API key page.
Replace all occurrences of <DATADOG_API_KEY> and <DATADOG_APP_KEY> with your Datadog API key and your Datadog Application key, respectively.
This guide also assumes that you have a terminal with CURL and have reviewed the main Downtime documentation page
Use cases
Downtime over the weekend
If you monitor services used only during the week, such as your company’s ERP or accounting software, you may want to receive alerts only during the week.
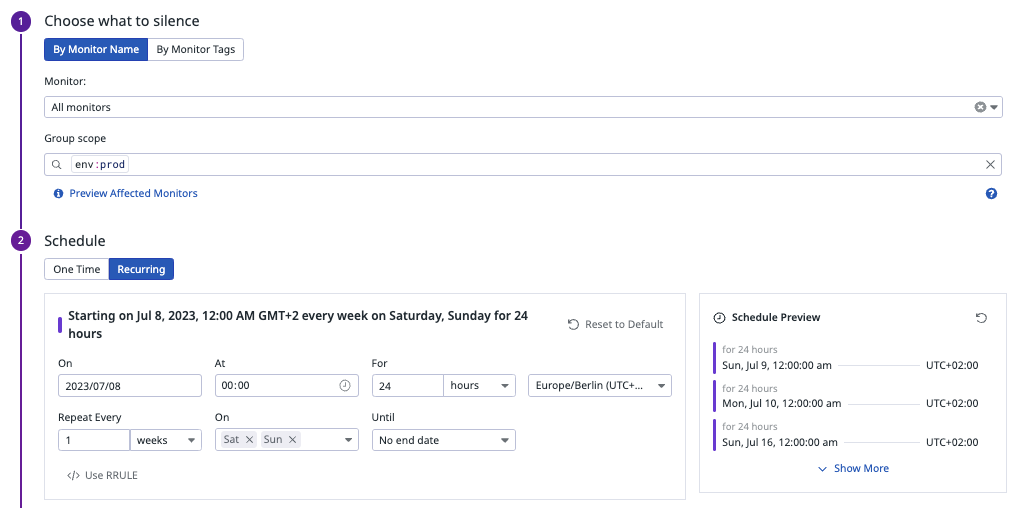
With the following API call, you can mute alert during the weekend for all monitors over the env:prod tag.
curl -X POST "https://api.<DATADOG_SITE>/api/v2/downtime" \
-H "Content-type: application/json" \
-H "DD-API-KEY: ${api_key}" \
-H "DD-APPLICATION-KEY: ${app_key}" \
-d '{"data":{"type":"downtime","attributes":{"monitor_identifier":{"monitor_tags":["*"]},"scope":"env:prod","display_timezone":"Europe/Berlin","message":"","mute_first_recovery_notification":false,"notify_end_types":["expired","canceled"],"notify_end_states":["alert","warn","no data"],"schedule":{"timezone":"Europe/Berlin","recurrences":[{"start":"2023-09-16T00:00","duration":"24h","rrule":"FREQ=WEEKLY;INTERVAL=1;BYDAY=SA,SU"}]}}}'
Optionally, add a message to your Downtime to let others know the reason and purpose of the Downtime you are creating. For instance, Muting all monitors in production environment over the weekend.
Replace the placeholder value <DATADOG_SITE> with the site parameter of your Datadog account, see the Datadog Sites documentation. Replace the start and end parameter to match your wanted schedule. For example:
start=$(date +%s)end=$(date -v+24H +%s)
And then in the cURL command, use: "start": '"${start}"'.
Response:
{
  "data": {
    "id": "16d09s97-1a70-11ee-8319-dasan1997",
    "type": "downtime",
    "attributes": {
      "scope": "env:prod",
      "canceled": null,
      "schedule": {
        "current_downtime": {
          "start": "2023-09-16T22:00:00+00:00",
          "end": "2023-09-17T22:00:00+00:00"
        },
        "timezone": "Europe/Berlin",
        "recurrences": [
          {
            "start": "2023-09-16T00:00",
            "duration": "24h",
            "rrule": "FREQ=WEEKLY;INTERVAL=1;BYDAY=SA,SU"
          }
        ]
      },
      "notify_end_states": ["warn", "alert", "no data"],
      "monitor_identifier": { "monitor_tags": ["*"] },
      "status": "scheduled",
      "display_timezone": "Europe/Berlin",
      "notify_end_types": ["canceled", "expired"],
      "created": "2023-07-04T13:41:06.855440+00:00",
      "modified": "2023-07-04T13:41:06.855440+00:00",
      "mute_first_recovery_notification": false,
      "message": ""
    },
    [..]
  },
  [..]
}
Open the Manage Downtime page and schedule a new downtime. Select recurring:
Downtime outside of business hours
Using the same example, you may want to also mute this service during the weekdays outside of business hours.
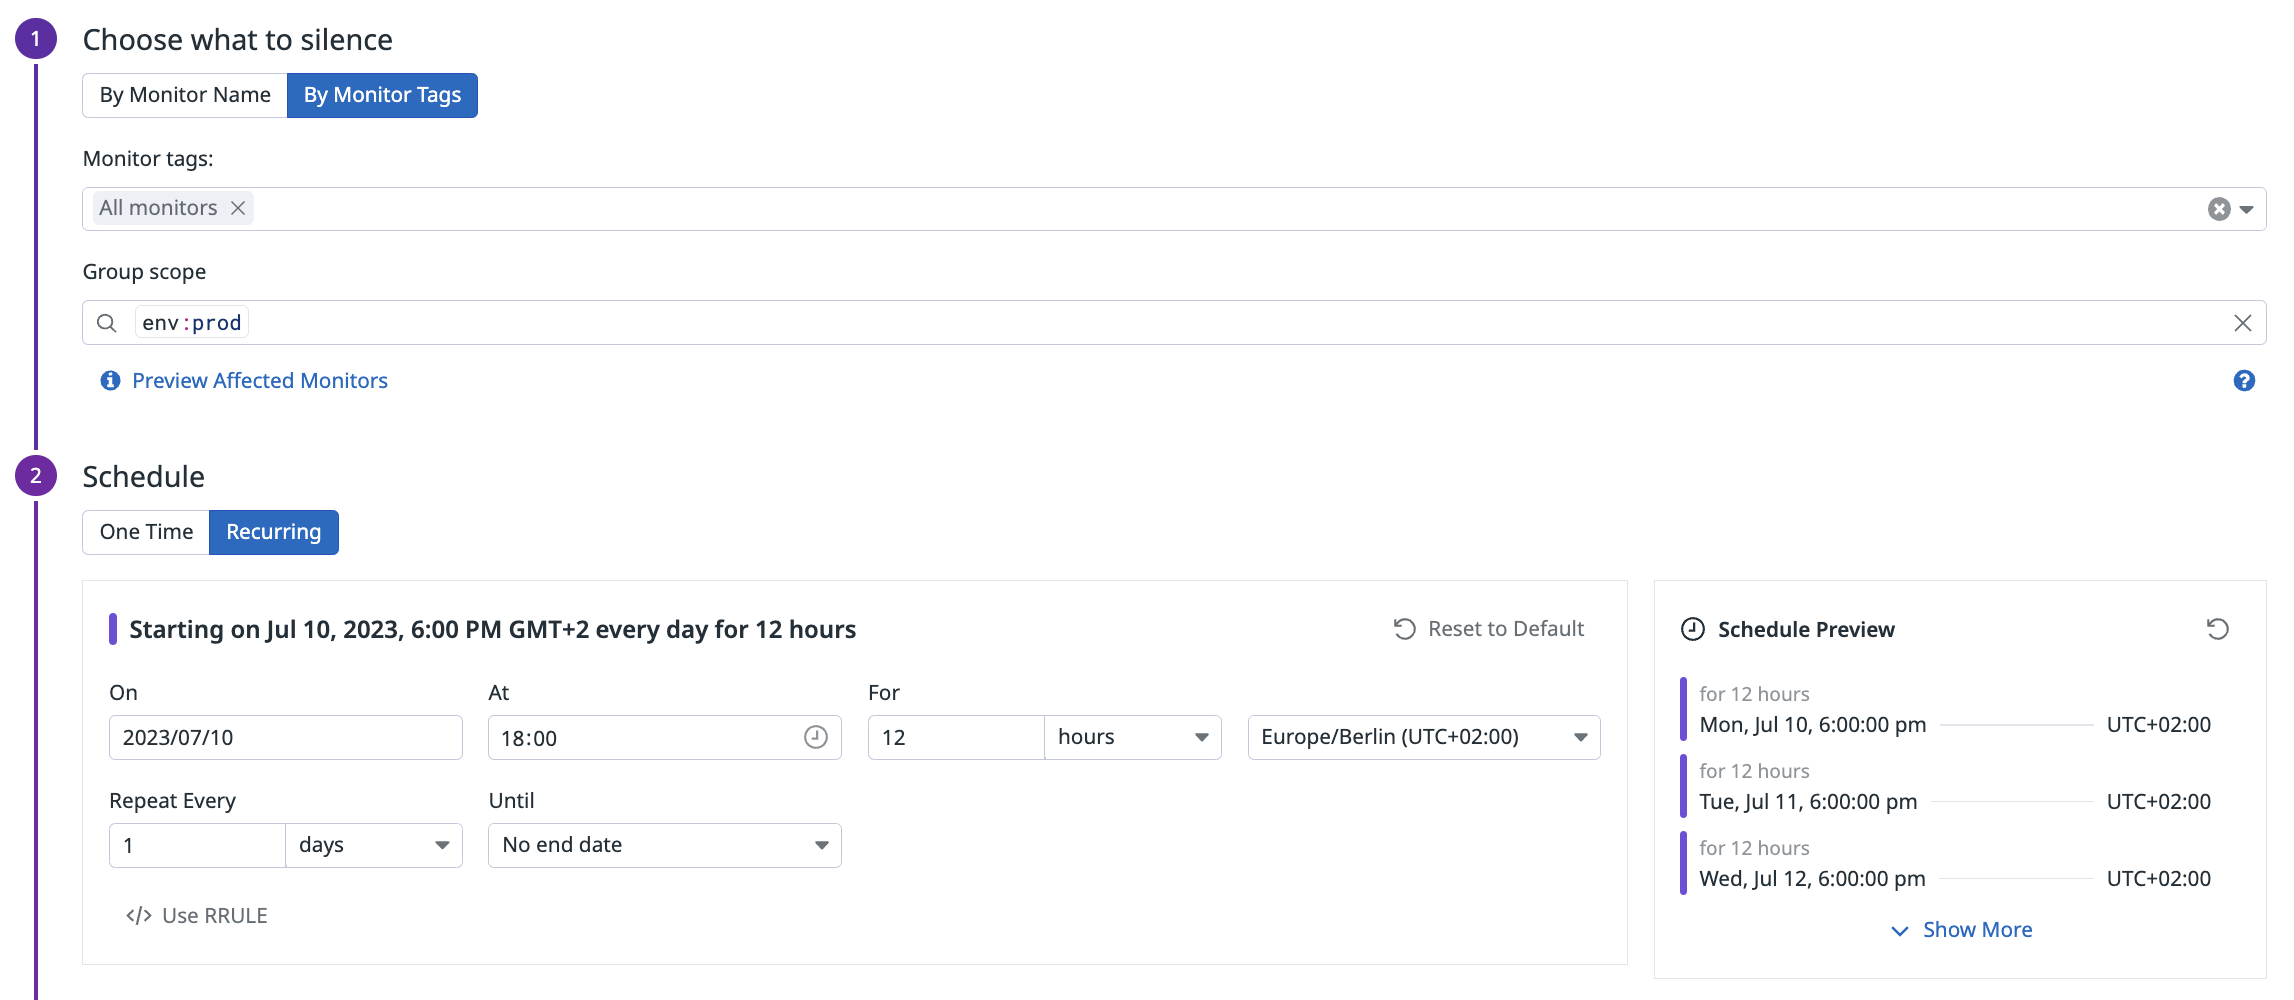
With the following API call, you can mute alerts every weekday from 8pm to 6am:
curl -X POST "https://api.<DATADOG_SITE>/api/v1/downtime" \
-H "Content-type: application/json" \
-H "DD-API-KEY: ${api_key}" \
-H "DD-APPLICATION-KEY: ${app_key}" \
-d '{"data":{"type":"downtime","attributes":{"monitor_identifier":{"monitor_tags":["*"]},"scope":"env:prod","display_timezone":"Europe/Berlin","message":"","mute_first_recovery_notification":false,"notify_end_types":["expired","canceled"],"notify_end_states":["alert","warn","no data"],"schedule":{"timezone":"Europe/Berlin","recurrences":[{"start":"2023-07-10T18:00","duration":"12h","rrule":"FREQ=DAILY;INTERVAL=1"}]}}},"_authentication_token":"b6c9ec89cdff687d29c0ee54923c52f57c9e102a"}'
Optionally, add a message to your Downtime to let others know the reason and purpose of the Downtime you are creating. Replace the placeholder value <DATADOG_SITE> with the site parameter of your Datadog account, see the Datadog Sites documentation. Replace the start and end parameter to match your wanted schedule.
Response:
{
  "data": {
    "type": "downtime",
    "id": "16d09s97-1a70-11ee-8319-dasan1997",
    "attributes": {
      "message": "",
      "mute_first_recovery_notification": false,
      "canceled": null,
      "scope": "env:prod",
      "monitor_identifier": { "monitor_tags": ["*"] },
      "modified": "2023-07-05T08:12:17.145771+00:00",
      "created": "2023-07-05T08:12:17.145771+00:00",
      "status": "scheduled",
      "display_timezone": "Europe/Berlin",
      "schedule": {
        "recurrences": [
          {
            "duration": "12h",
            "rrule": "FREQ=DAILY;INTERVAL=1",
            "start": "2023-07-10T18:00"
          }
        ],
        "current_downtime": {
          "end": "2023-07-11T04:00:00+00:00",
          "start": "2023-07-10T16:00:00+00:00"
        },
        "timezone": "Europe/Berlin"
      },
      "notify_end_states": ["alert", "warn", "no data"],
      "notify_end_types": ["canceled", "expired"]
    },
    [..]
  },
  [..]
}
Open the Manage Downtime page and schedule a new downtime. Select recurring:
Combined downtime for outside business hours and weekend
For use cases where you only want monitor notifications during business hours, mute monitors during the week as well as during the weekend. This can be combined in a single Downtime. Continuing from the Downtime outside of business hours example above:
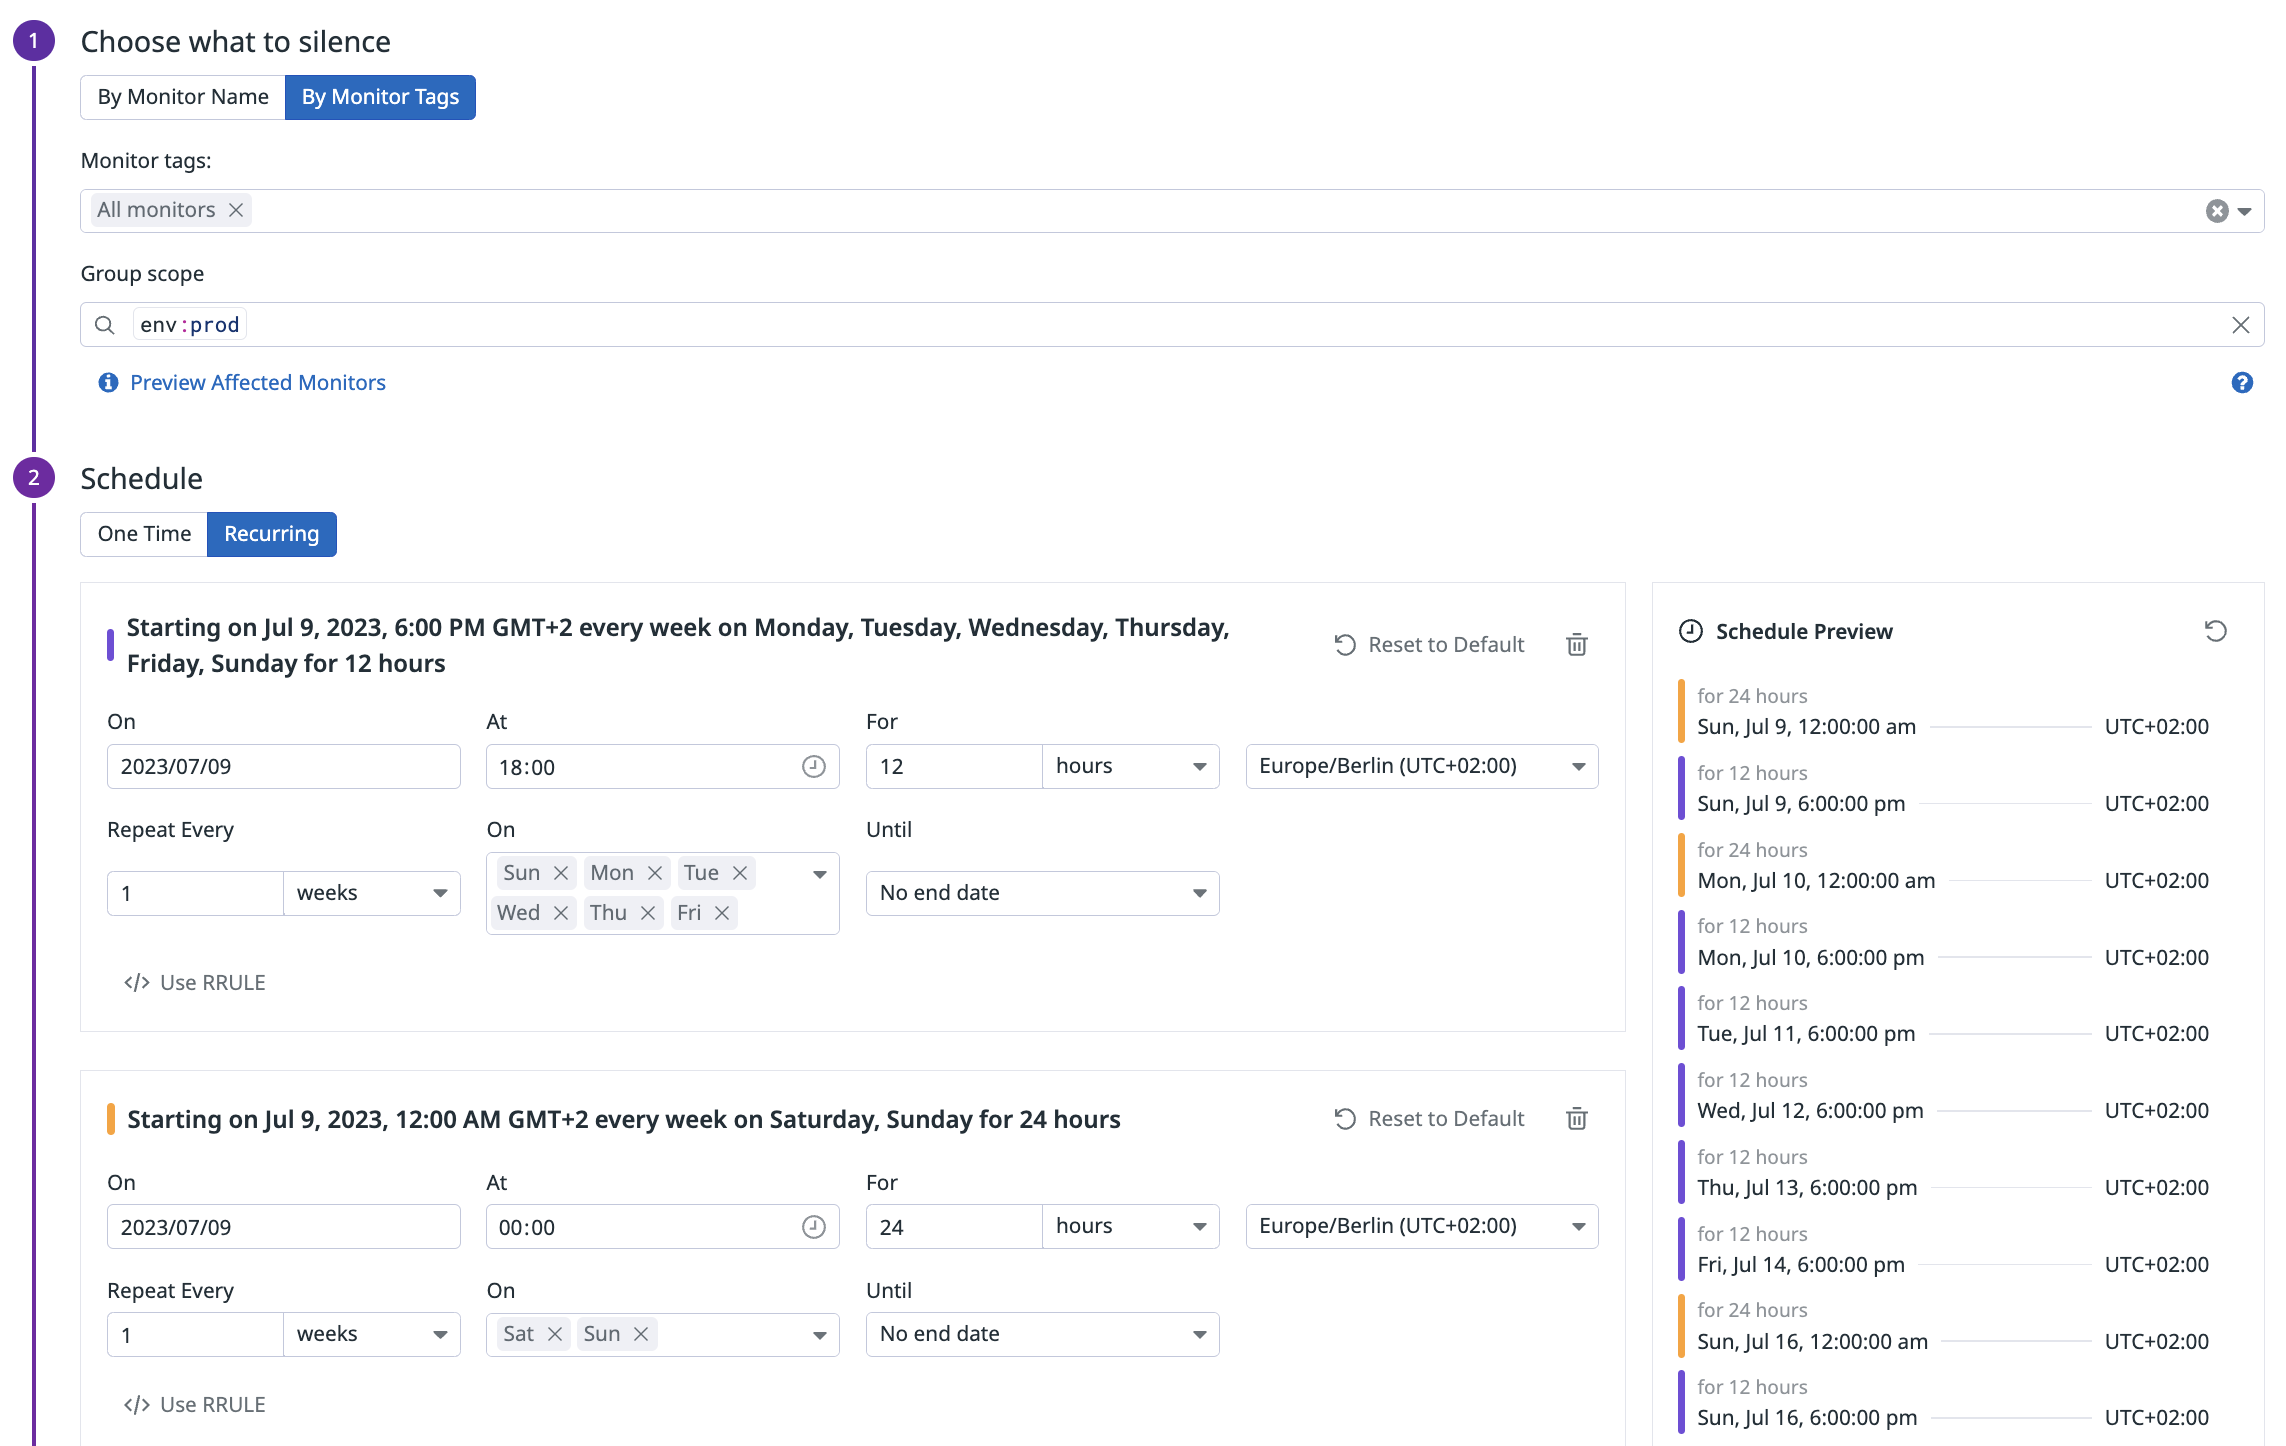
With the following API call, you can mute alerts every weekday from 8pm to 6am as well as over the whole weekend:
curl -X POST "https://api.<DATADOG_SITE>/api/v1/downtime" \
-H "Content-type: application/json" \
-H "DD-API-KEY: ${api_key}" \
-H "DD-APPLICATION-KEY: ${app_key}" \
-d '{"data":{"type":"downtime","attributes":{"monitor_identifier":{"monitor_tags":["*"]},"scope":"env:prod","display_timezone":"Europe/Berlin","message":"","mute_first_recovery_notification":false,"notify_end_types":["expired","canceled"],"notify_end_states":["alert","warn","no data"],"schedule":{"timezone":"Europe/Berlin","recurrences":[{"start":"2023-07-09T18:00","duration":"12h","rrule":"FREQ=WEEKLY;INTERVAL=1;BYDAY=SU,MO,TU,WE,TH,FR"},{"start":"2023-07-09T00:00","duration":"24h","rrule":"FREQ=WEEKLY;INTERVAL=1;BYDAY=SA,SU"}]}}}'
Optionally, add a message to your Downtime to let others know the reason and purpose of the Downtime you are creating. Replace the placeholder value <DATADOG_SITE> with the site parameter of your Datadog account, see the Datadog Sites documentation. Replace the start and end parameter to match your wanted schedule.
Response:
{
  "data": {
    "type": "downtime",
    "id": "16d09s97-1a70-11ee-8319-dasan1997",
    "attributes": {
      "monitor_identifier": { "monitor_tags": ["*"] },
      "created": "2023-07-05T08:36:00.917977+00:00",
      "message": "",
      "schedule": {
        "current_downtime": {
          "start": "2023-07-08T22:00:00+00:00",
          "end": "2023-07-10T04:00:00+00:00"
        },
        "timezone": "Europe/Berlin",
        "recurrences": [
          {
            "start": "2023-07-09T18:00",
            "duration": "12h",
            "rrule": "FREQ=WEEKLY;INTERVAL=1;BYDAY=SU,MO,TU,WE,TH,FR"
          },
          {
            "start": "2023-07-09T00:00",
            "duration": "24h",
            "rrule": "FREQ=WEEKLY;INTERVAL=1;BYDAY=SA,SU"
          }
        ]
      },
      "notify_end_states": ["alert", "warn", "no data"],
      "status": "scheduled",
      "scope": "env:prod",
      "modified": "2023-07-05T08:36:00.917977+00:00",
      "mute_first_recovery_notification": false,
      "notify_end_types": ["expired", "canceled"],
      "display_timezone": "Europe/Berlin",
      "canceled": null
    },
    [..]
  },
  [..]
}
Open the Manage Downtime page and add a new downtime. Select recurring:
Recurring downtime on the nth weekday of the month
To plan more advanced maintenance schedules, you can use RRULEs.
RRULE - or recurrence rule - is a property name from iCalendar RFC, which is the standard for defining recurring events.
Attributes specifying the duration in RRULE are not supported (for example, DTSTART, DTEND, DURATION), see the RFC for the possible attributes. You can use this tool to generate RRULEs and paste them into your API call.
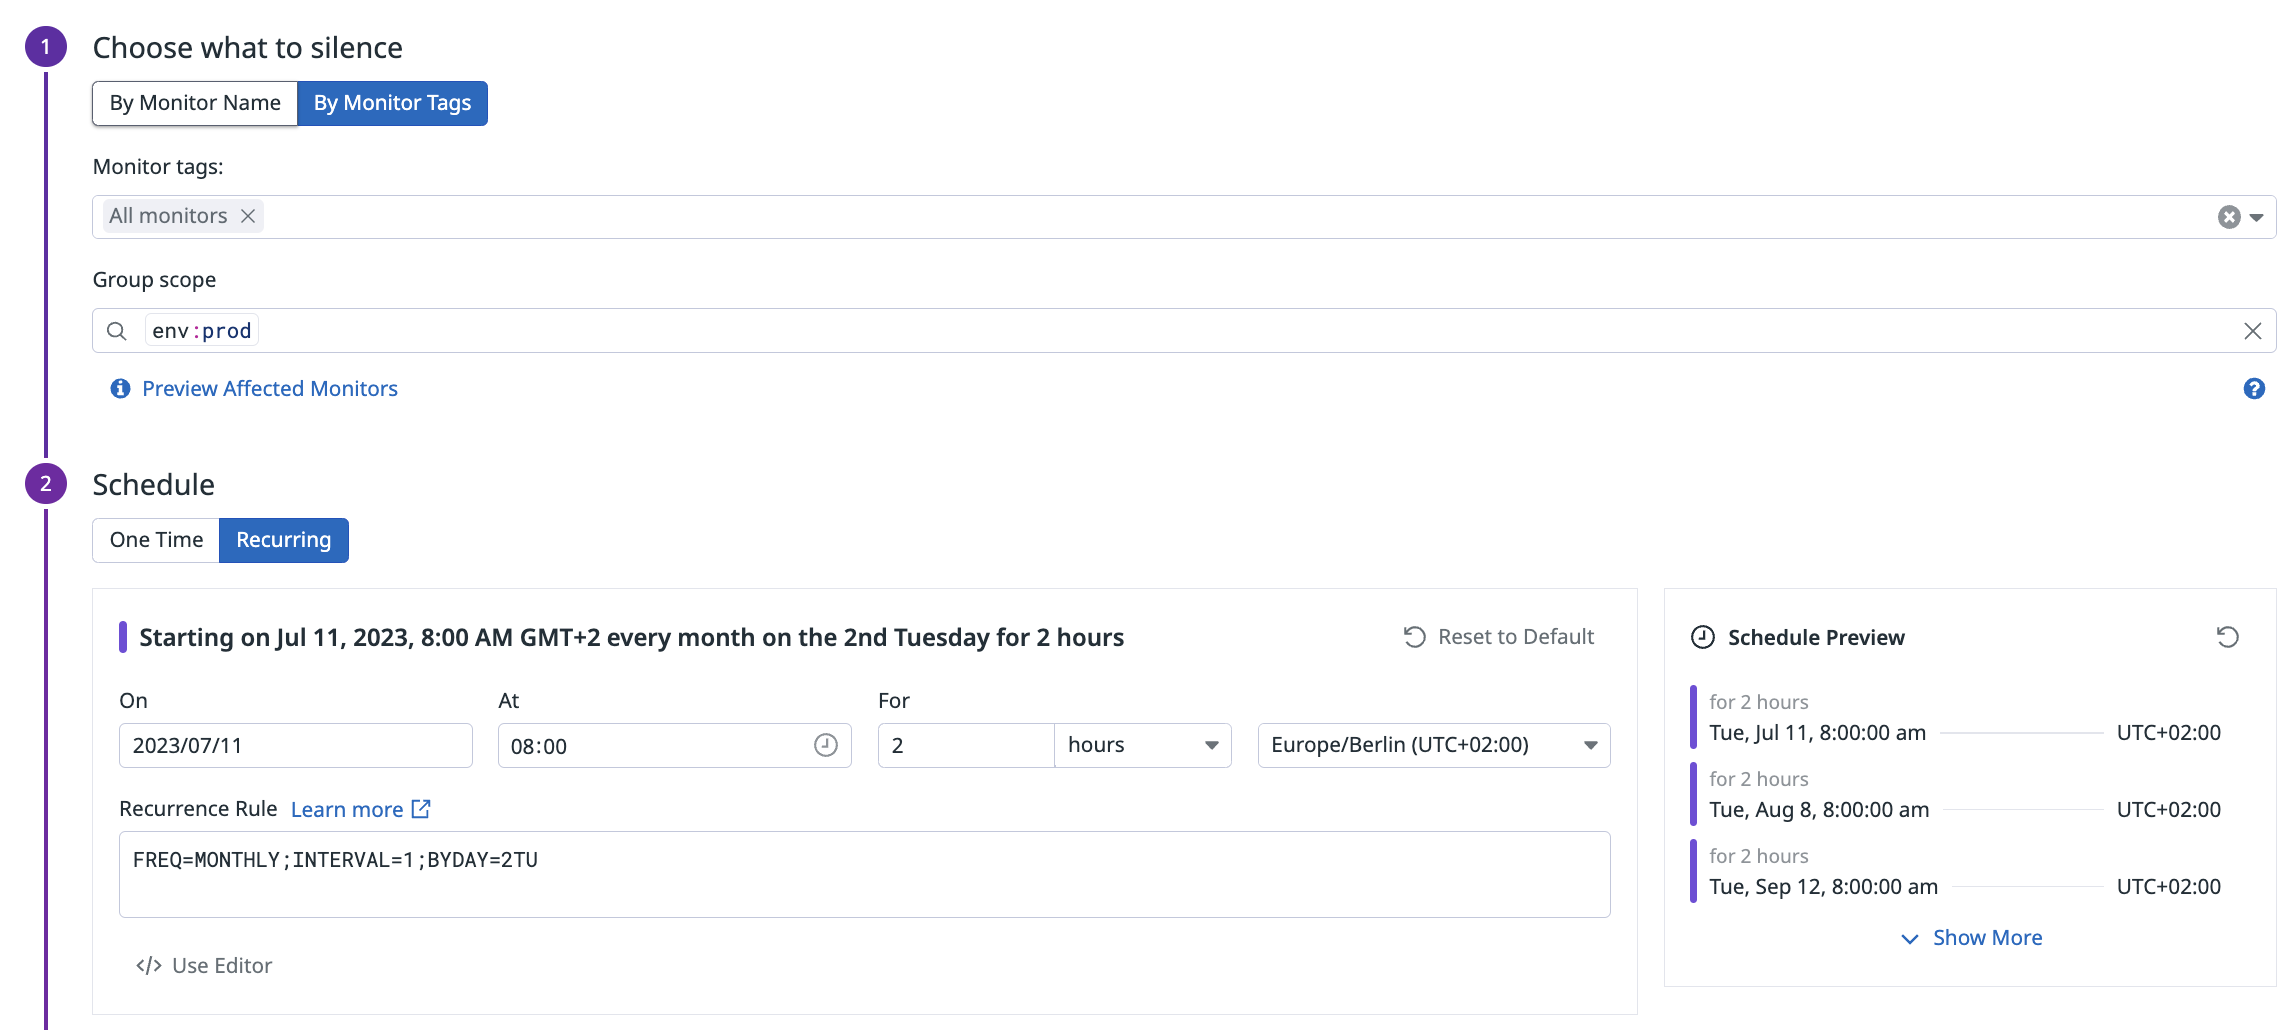
Example: The ERP app is updated every 2nd Tuesday of the month to apply patches and fixes between 8AM and 10AM. Monitors for this are scoped with app:erp, so this is used in the downtime scope.
The start and end parameters must match the expected start and end of the recurring rule’s first day. So, assuming the first 2nd Tuesday of our rule is Tuesday, July 11th, the start date has to be July 11th 08:00 AM and a duration of two hours needs to be set.
API call:
curl -X POST "https://api.<DATADOG_SITE>/api/v1/downtime" \
-H "Content-type: application/json" \
-H "DD-API-KEY: ${api_key}" \
-H "DD-APPLICATION-KEY: ${app_key}" \
-d '{"data":{"type":"downtime","attributes":{"monitor_identifier":{"monitor_tags":["*"]},"scope":"env:prod","display_timezone":"Europe/Berlin","message":"","mute_first_recovery_notification":false,"notify_end_types":["expired","canceled"],"notify_end_states":["alert","warn","no data"],"schedule":{"timezone":"Europe/Berlin","recurrences":[{"start":"2023-07-11T08:00","duration":"2h","rrule":"FREQ=DAILY;INTERVAL=1;BYDAY=2TU"}]}}}'
Replace the placeholder value <DATADOG_SITE> with the site parameter of your Datadog account, see the Datadog Sites documentation. Replace the start and end parameter to match your wanted schedule.
Response:
{
  "data": {
    "type": "downtime",
    "id": "16d09s97-1a70-11ee-8319-dasan1997",
    "attributes": {
      "mute_first_recovery_notification": false,
      "notify_end_types": ["canceled", "expired"],
      "created": "2023-07-05T08:50:19.678427+00:00",
      "display_timezone": "Europe/Berlin",
      "modified": "2023-07-05T08:50:19.678427+00:00",
      "status": "scheduled",
      "canceled": null,
      "notify_end_states": ["warn", "alert", "no data"],
      "message": "",
      "schedule": {
        "recurrences": [
          {
            "duration": "2h",
            "start": "2023-07-11T08:00",
            "rrule": "FREQ=DAILY;INTERVAL=1;BYDAY=2TU"
          }
        ],
        "current_downtime": {
          "end": "2023-07-11T08:00:00+00:00",
          "start": "2023-07-11T06:00:00+00:00"
        },
        "timezone": "Europe/Berlin"
      },
      "scope": "env:prod",
      "monitor_identifier": { "monitor_tags": ["*"] }
    },
    [..]
  },
  [..]
}
Open the Manage Downtime page and add a new downtime. Select recurring and then select Use RRULE.
Further Reading
Documentation, liens et articles supplémentaires utiles:


