- Principales informations
- Getting Started
- Datadog
- Site Datadog
- DevSecOps
- Serverless for AWS Lambda
- Agent
- Intégrations
- Conteneurs
- Dashboards
- Monitors
- Logs
- Tracing
- Profileur
- Tags
- API
- Service Catalog
- Session Replay
- Continuous Testing
- Surveillance Synthetic
- Incident Management
- Database Monitoring
- Cloud Security Management
- Cloud SIEM
- Application Security Management
- Workflow Automation
- CI Visibility
- Test Visibility
- Intelligent Test Runner
- Code Analysis
- Learning Center
- Support
- Glossary
- Standard Attributes
- Guides
- Agent
- Intégrations
- OpenTelemetry
- Développeurs
- Authorization
- DogStatsD
- Checks custom
- Intégrations
- Create an Agent-based Integration
- Create an API Integration
- Create a Log Pipeline
- Integration Assets Reference
- Build a Marketplace Offering
- Create a Tile
- Create an Integration Dashboard
- Create a Recommended Monitor
- Create a Cloud SIEM Detection Rule
- OAuth for Integrations
- Install Agent Integration Developer Tool
- Checks de service
- IDE Plugins
- Communauté
- Guides
- API
- Application mobile
- CoScreen
- Cloudcraft
- In The App
- Dashboards
- Notebooks
- DDSQL Editor
- Alertes
- Infrastructure
- Métriques
- Watchdog
- Bits AI
- Service Catalog
- API Catalog
- Error Tracking
- Service Management
- Infrastructure
- Universal Service Monitoring
- Conteneurs
- Sans serveur
- Surveillance réseau
- Cloud Cost
- Application Performance
- APM
- Profileur en continu
- Database Monitoring
- Agent Integration Overhead
- Setup Architectures
- Configuration de Postgres
- Configuration de MySQL
- Configuration de SQL Server
- Setting Up Oracle
- Setting Up MongoDB
- Connecting DBM and Traces
- Données collectées
- Exploring Database Hosts
- Explorer les métriques de requête
- Explorer des échantillons de requêtes
- Dépannage
- Guides
- Data Streams Monitoring
- Data Jobs Monitoring
- Digital Experience
- RUM et Session Replay
- Product Analytics
- Surveillance Synthetic
- Continuous Testing
- Software Delivery
- CI Visibility
- CD Visibility
- Test Visibility
- Exécuteur de tests intelligent
- Code Analysis
- Quality Gates
- DORA Metrics
- Securité
- Security Overview
- Cloud SIEM
- Cloud Security Management
- Application Security Management
- AI Observability
- Log Management
- Pipelines d'observabilité
- Log Management
- Administration
OpenTelemetry Runtime Metrics
Cette page n'est pas encore disponible en français, sa traduction est en cours.
Si vous avez des questions ou des retours sur notre projet de traduction actuel, n'hésitez pas à nous contacter.
Si vous avez des questions ou des retours sur notre projet de traduction actuel, n'hésitez pas à nous contacter.
Overview
Runtime metrics are application metrics about memory usage, garbage collection, or parallelization. Datadog tracing libraries provide runtime metrics collection for each supported language, but in addition, OpenTelemetry (OTel) collects runtime metrics, which can be sent to Datadog through the OpenTelemetry SDKs.
Datadog collects OpenTelemetry runtime metrics in the following languages:
- Java
- .NET
- Go
Metric naming conventions
Runtime metrics follow different naming conventions depending on their source: OpenTelemetry Collector Datadog Exporter, Datadog Agent OTLP Ingestion, or Datadog tracing libraries. When using OpenTelemetry runtime metrics with Datadog, you receive both the original OpenTelemetry runtime metrics as well as mapped Datadog runtime metrics for equivalent metrics. Runtime metrics have the following prefixes which indicate their source:
| OTel Collector Datadog Exporter | Datadog Agent OTLP Ingest | Datadog tracing library |
|---|---|---|
otel.process.runtime.* | process.runtime.* | runtime.<LANG>.* |
Note: OpenTelemetry runtime metrics are mapped to Datadog by metric name. Don’t do mapping renaming of host metrics for OpenTelemetry runtime metrics or it will break.
For details about host and container metrics mapping, read OpenTelemetry Metrics Mapping.
Setup
Select your language to see instructions for setting up and configuring the OpenTelemetry SDK to send runtime metrics:
View runtime metric dashboards
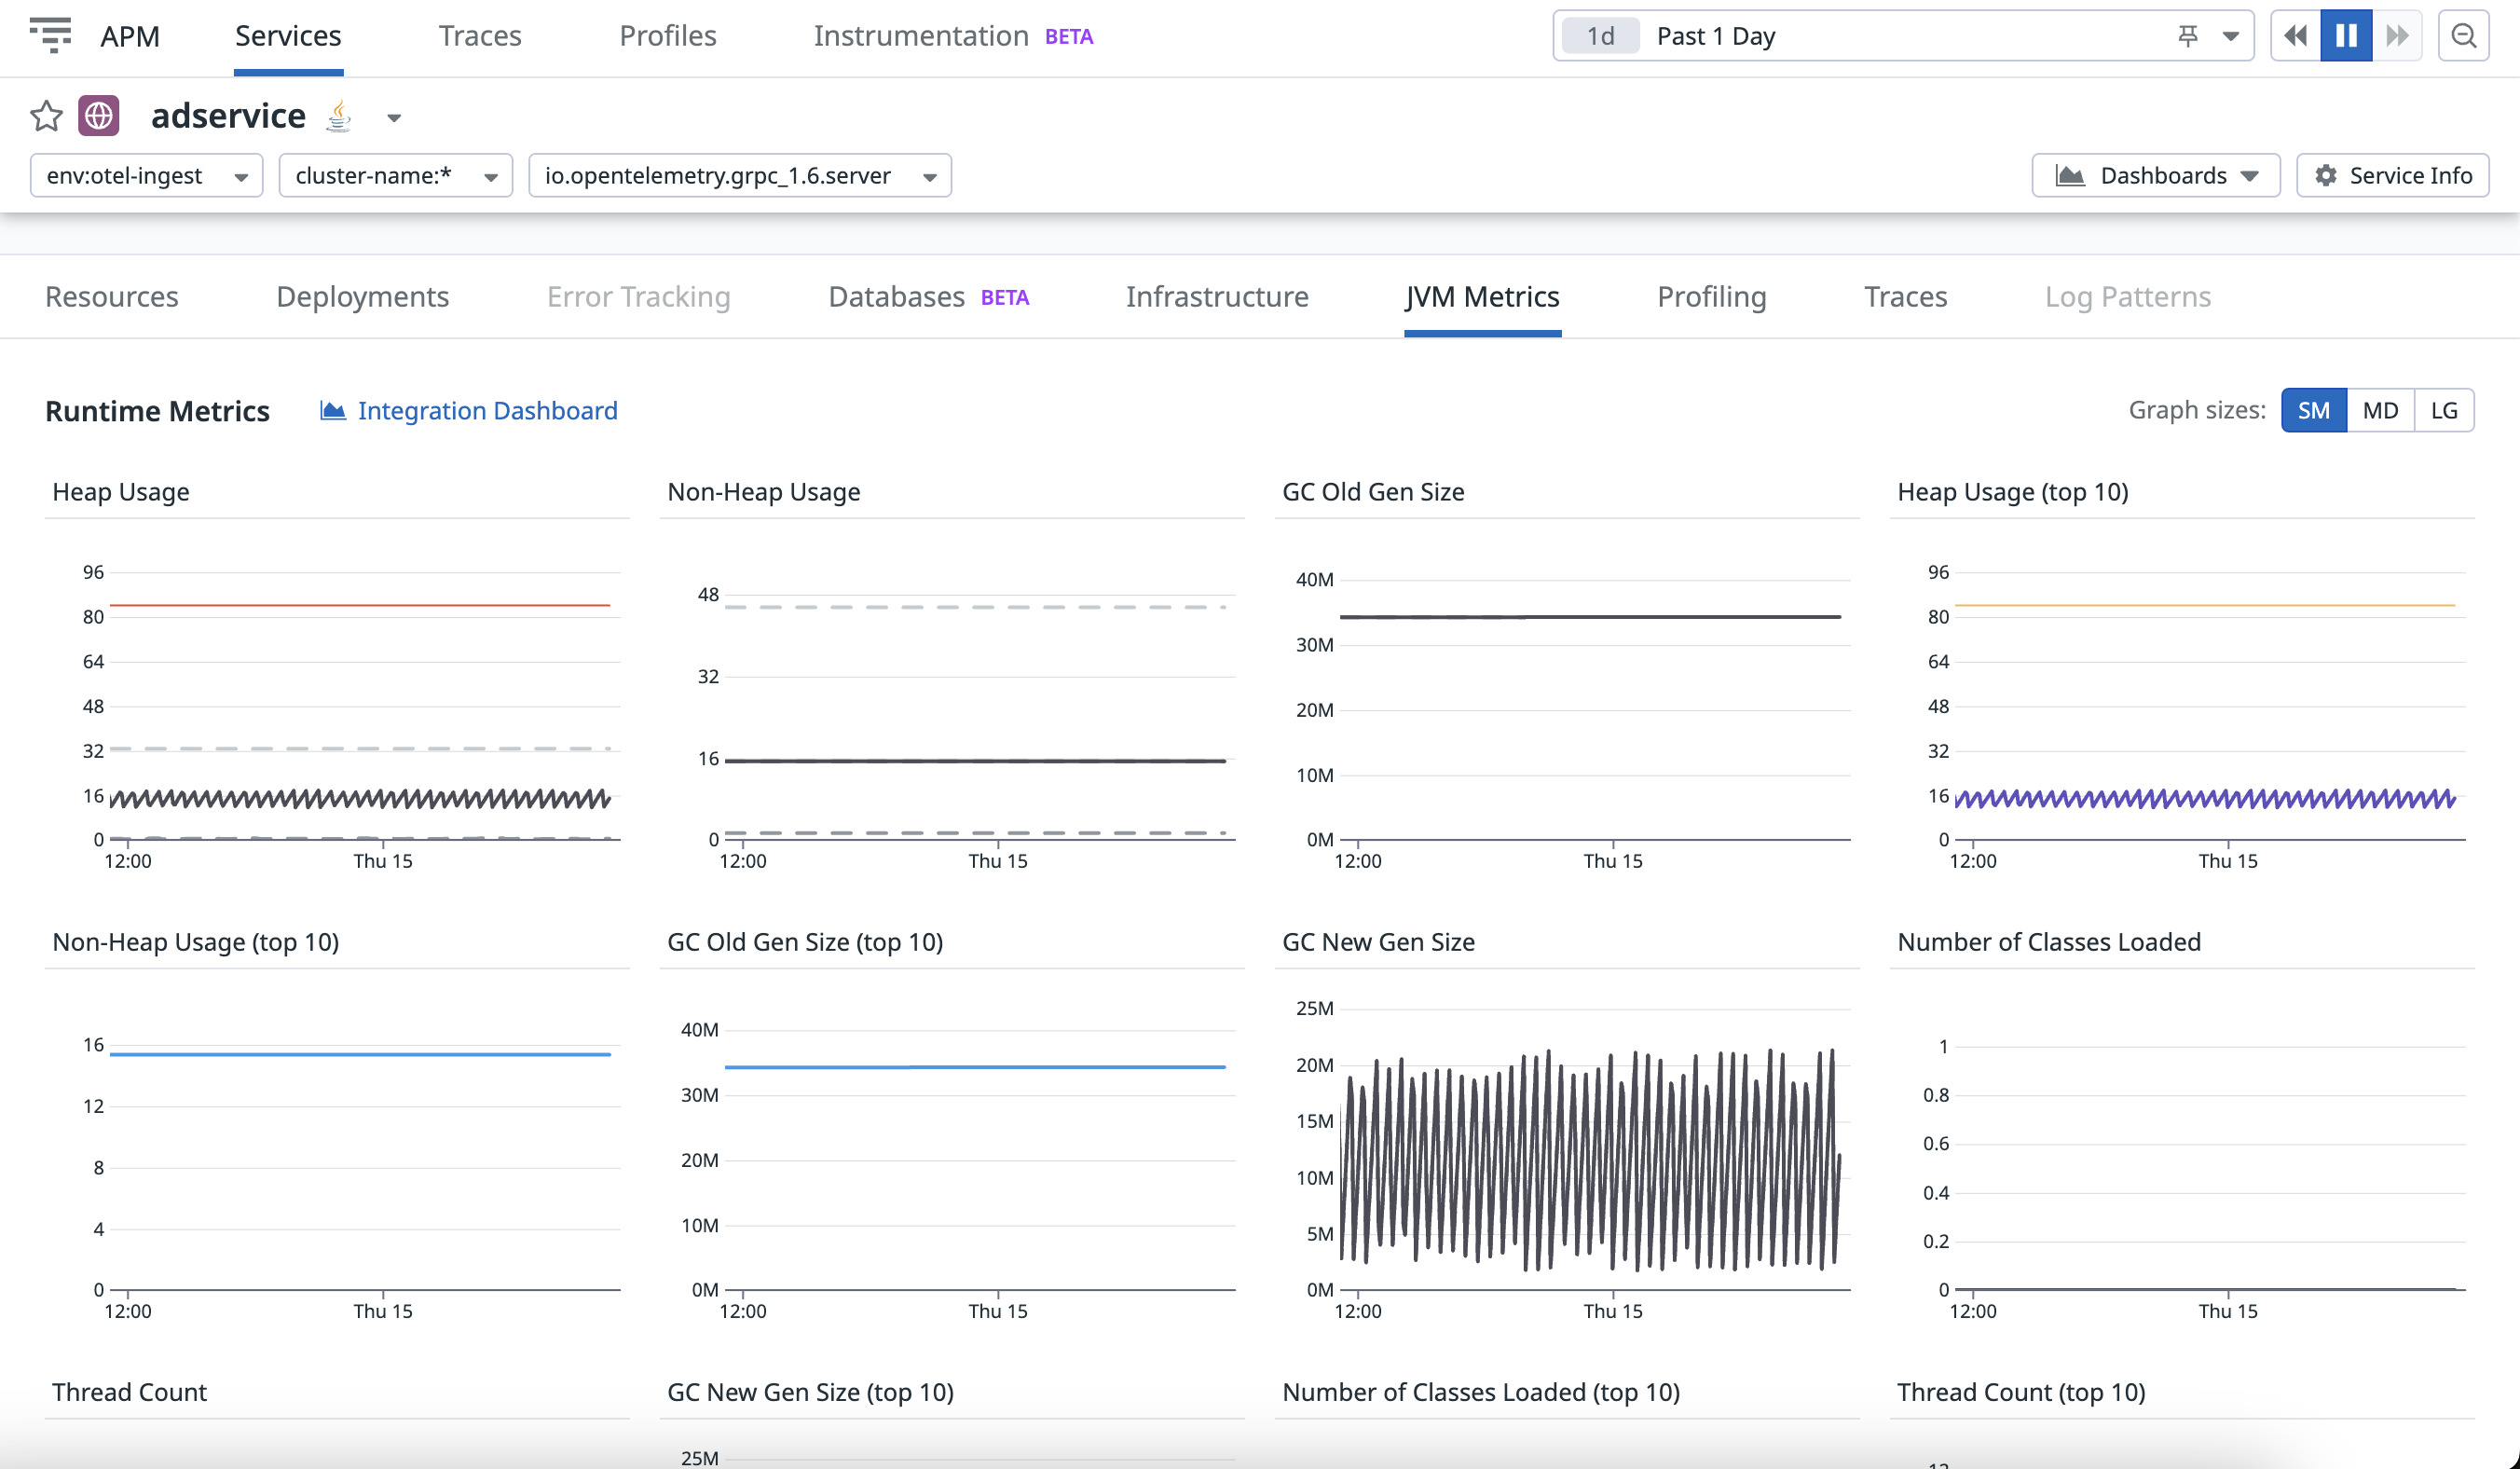
After setup is complete, see your runtime metrics in the a service’s details page (see Java example below), the flame graph metrics tab, and in default runtime dashboards.


