- Principales informations
- Getting Started
- Datadog
- Site Datadog
- DevSecOps
- Serverless for AWS Lambda
- Agent
- Intégrations
- Conteneurs
- Dashboards
- Monitors
- Logs
- Tracing
- Profileur
- Tags
- API
- Service Catalog
- Session Replay
- Continuous Testing
- Surveillance Synthetic
- Incident Management
- Database Monitoring
- Cloud Security Management
- Cloud SIEM
- Application Security Management
- Workflow Automation
- CI Visibility
- Test Visibility
- Intelligent Test Runner
- Code Analysis
- Learning Center
- Support
- Glossary
- Standard Attributes
- Guides
- Agent
- Intégrations
- OpenTelemetry
- Développeurs
- Authorization
- DogStatsD
- Checks custom
- Intégrations
- Create an Agent-based Integration
- Create an API Integration
- Create a Log Pipeline
- Integration Assets Reference
- Build a Marketplace Offering
- Create a Tile
- Create an Integration Dashboard
- Create a Recommended Monitor
- Create a Cloud SIEM Detection Rule
- OAuth for Integrations
- Install Agent Integration Developer Tool
- Checks de service
- IDE Plugins
- Communauté
- Guides
- API
- Application mobile
- CoScreen
- Cloudcraft
- In The App
- Dashboards
- Notebooks
- DDSQL Editor
- Alertes
- Infrastructure
- Métriques
- Watchdog
- Bits AI
- Service Catalog
- API Catalog
- Error Tracking
- Service Management
- Infrastructure
- Universal Service Monitoring
- Conteneurs
- Sans serveur
- Surveillance réseau
- Cloud Cost
- Application Performance
- APM
- Profileur en continu
- Database Monitoring
- Agent Integration Overhead
- Setup Architectures
- Configuration de Postgres
- Configuration de MySQL
- Configuration de SQL Server
- Setting Up Oracle
- Setting Up MongoDB
- Connecting DBM and Traces
- Données collectées
- Exploring Database Hosts
- Explorer les métriques de requête
- Explorer des échantillons de requêtes
- Dépannage
- Guides
- Data Streams Monitoring
- Data Jobs Monitoring
- Digital Experience
- RUM et Session Replay
- Product Analytics
- Surveillance Synthetic
- Continuous Testing
- Software Delivery
- CI Visibility
- CD Visibility
- Test Visibility
- Exécuteur de tests intelligent
- Code Analysis
- Quality Gates
- DORA Metrics
- Securité
- Security Overview
- Cloud SIEM
- Cloud Security Management
- Application Security Management
- AI Observability
- Log Management
- Pipelines d'observabilité
- Log Management
- Administration
RUM Performance Overview Dashboards
Cette page n'est pas encore disponible en français, sa traduction est en cours.
Si vous avez des questions ou des retours sur notre projet de traduction actuel, n'hésitez pas à nous contacter.
Si vous avez des questions ou des retours sur notre projet de traduction actuel, n'hésitez pas à nous contacter.
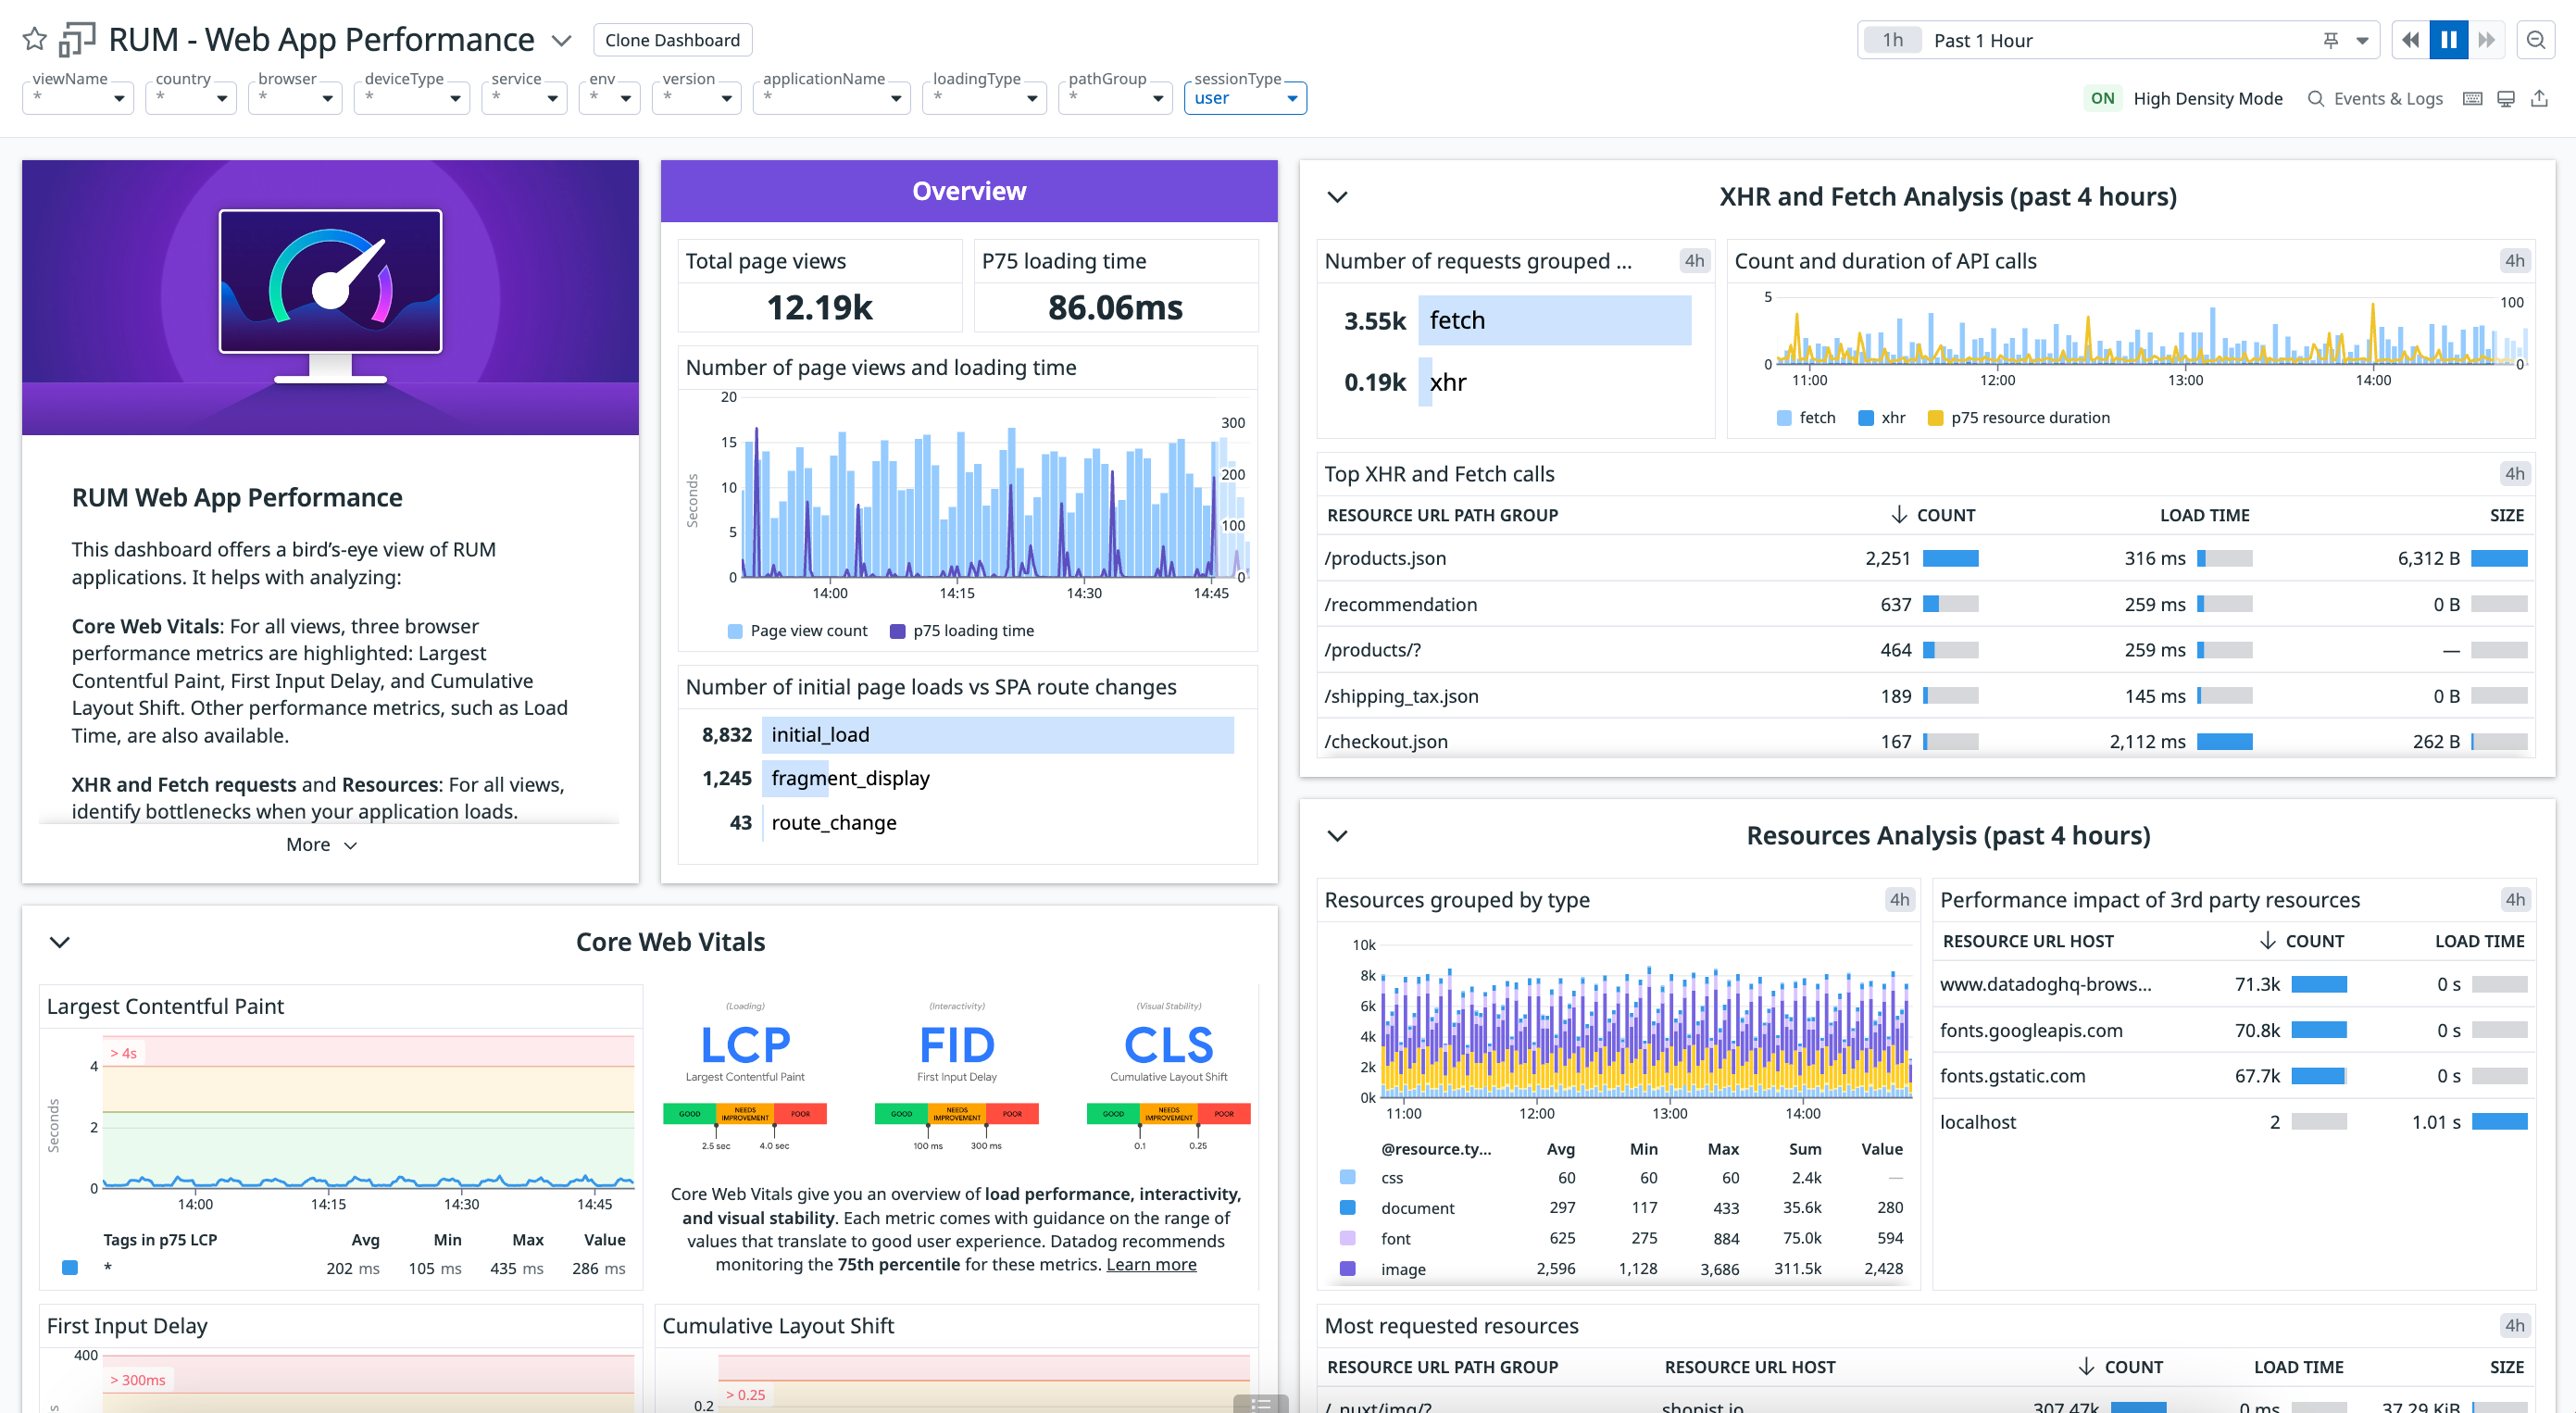
Web app performance
The web app performance dashboard offers a bird’s-eye view of RUM web applications. It shows:
- Core web vitals: For all views, three browser performance metrics are highlighted: Largest Contentful Paint, First Input Delay, and Cumulative Layout Shift. Other performance metrics, such as Load Time, are also available.
- XHR and Fetch requests and resources: For all views, identify bottlenecks when your application loads.
- Long tasks : Events that block the browser’s main thread for more than 50ms.
For more information about the data displayed, see RUM Browser Data Collected.
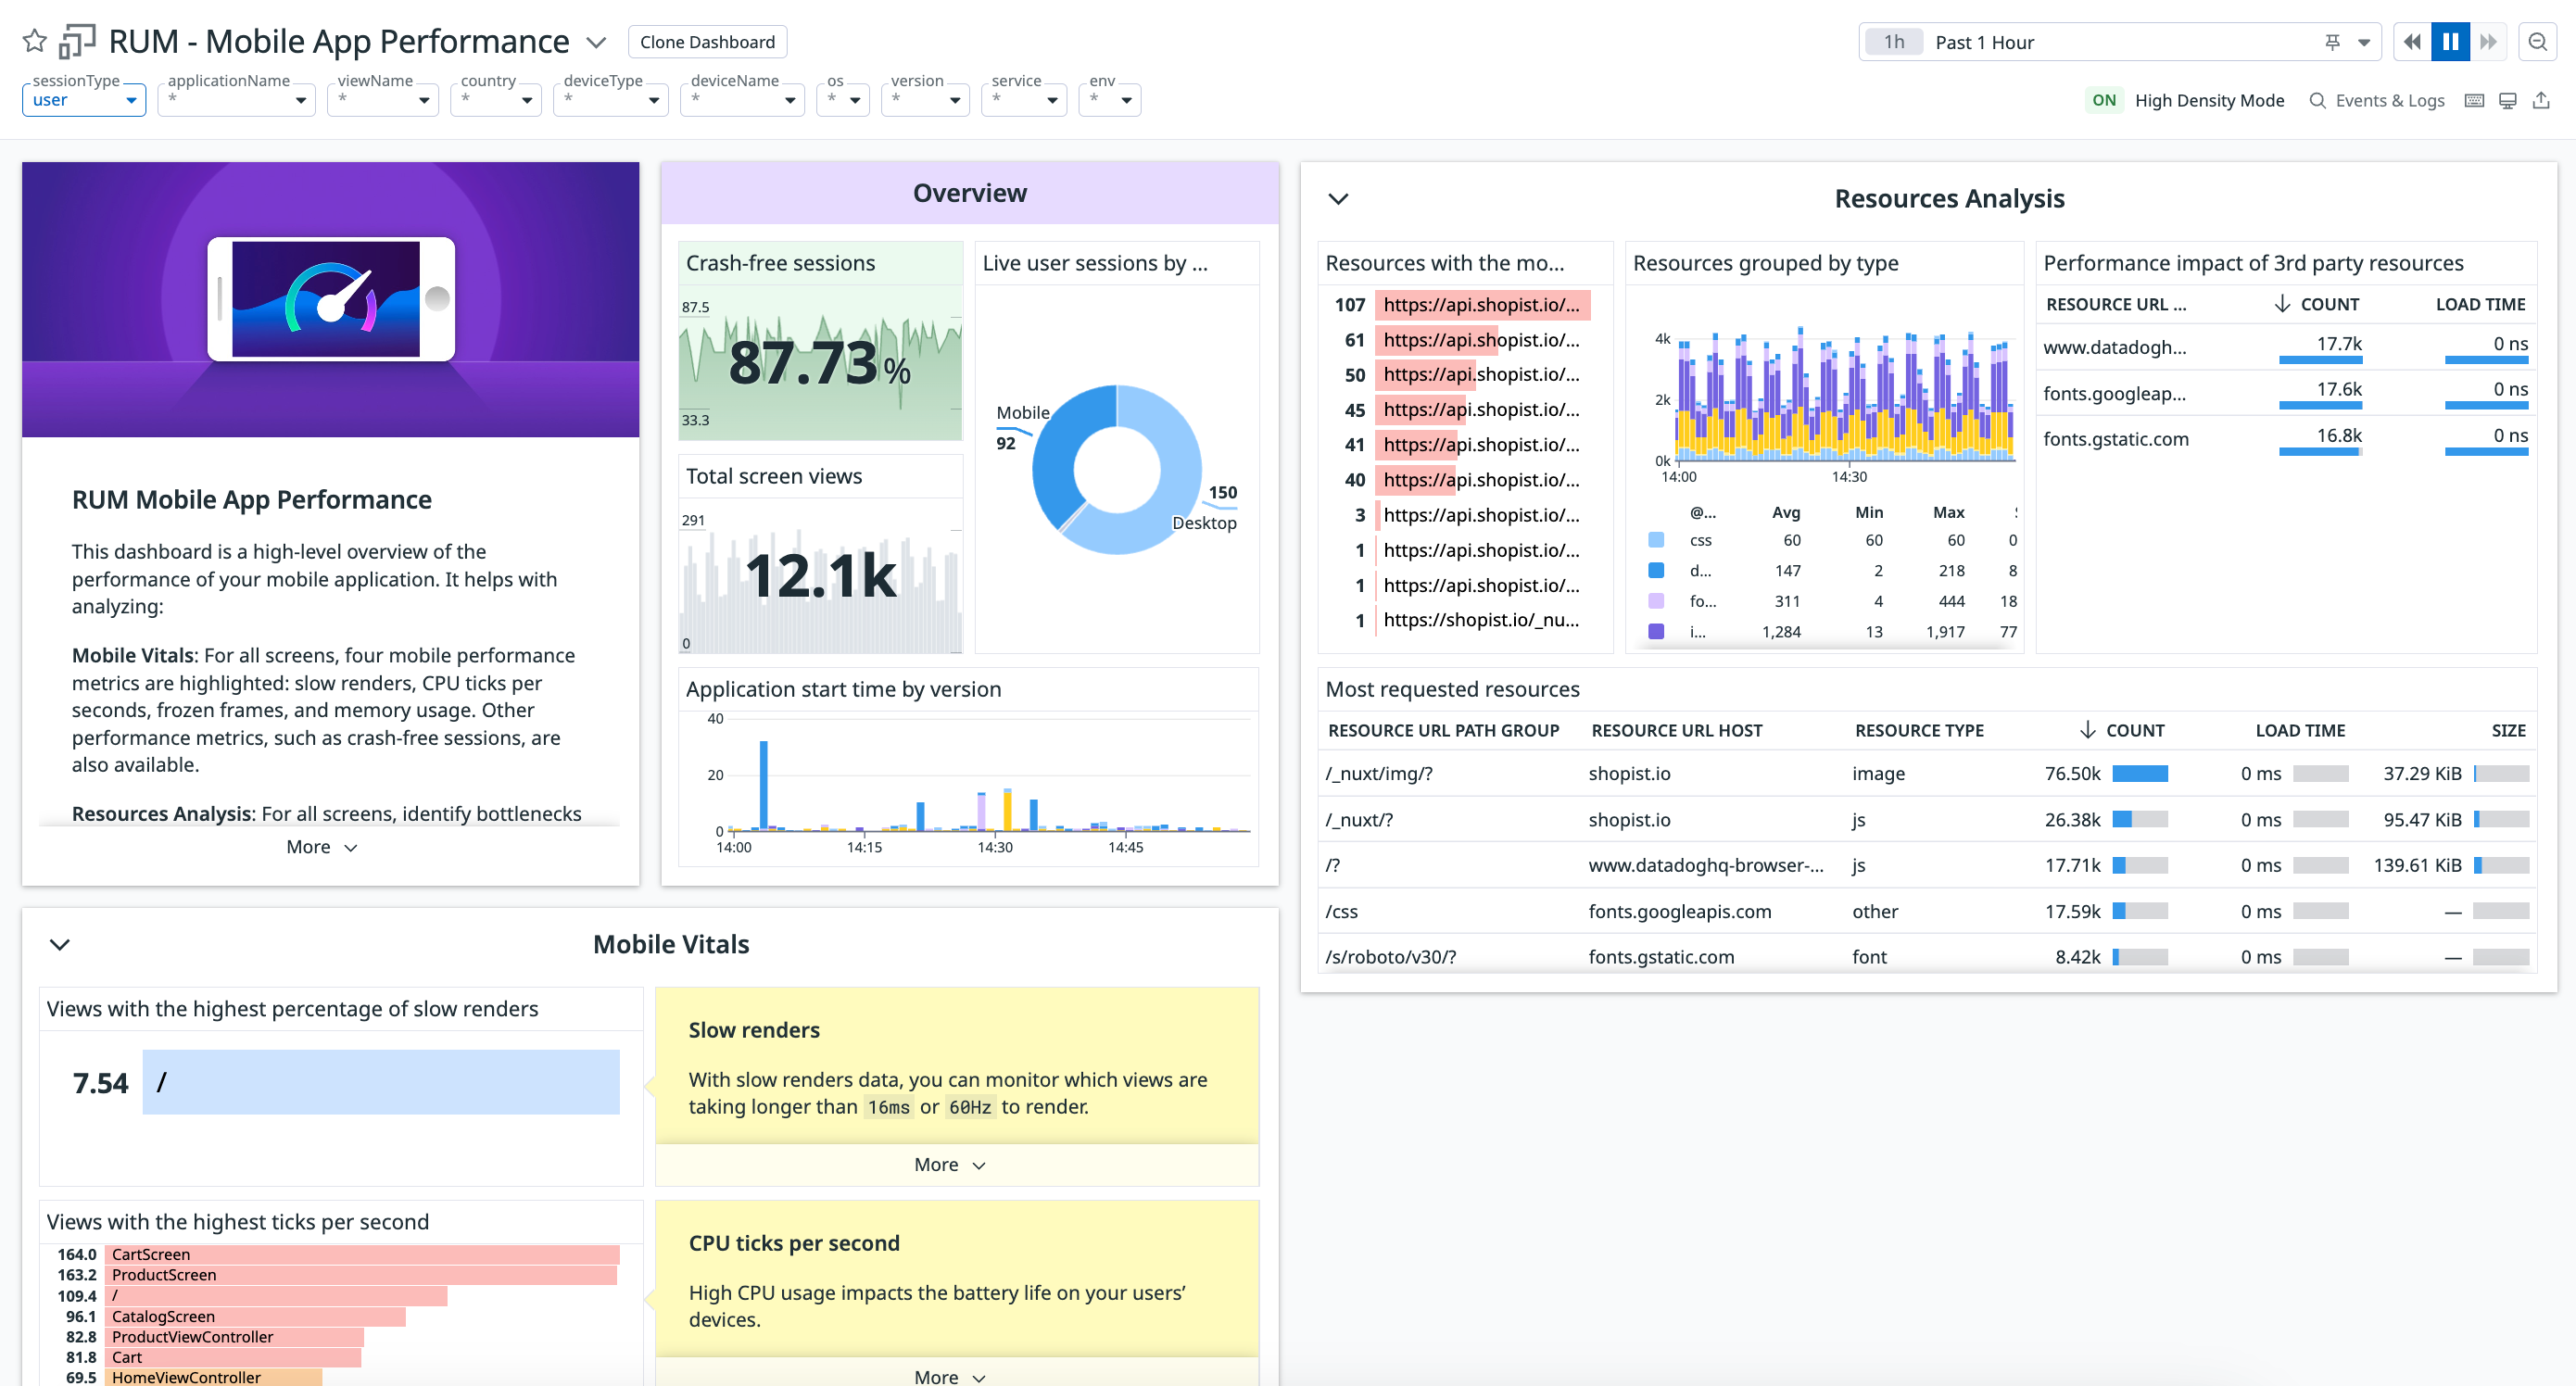
Mobile app performance
The mobile app performance dashboard gives an overview of RUM mobile applications. It shows:
- Mobile vitals: For all screens, four mobile performance metrics are highlighted: slow renders, CPU ticks per seconds, frozen frames, and memory usage. Other performance metrics, such as crash-free sessions, are also available.
- Resources analysis: For all screens, identify bottlenecks when your application requests content.
- Crashes and errors: Identify where crashes and errors can surface in your application.
For more information about the data displayed, see our documentation for each platform: iOS RUM, Android RUM, React Native RUM, and Flutter RUM.
Resources
The RUM resources dashboard helps you identify which resources have the heaviest impact on your application. It shows:
- Most requested resources: Visualize which resources are being loaded the most, and measure their size and load time.
- XHR and Fetch requests: Requests repartition, method, and error status codes.
- Resource load timings: Monitor the trends in resource timings (DNS Lookup, Initial Connection, Time To First Byte, Download) collected by the browser SDK.
- 3rd party resources: Understand which of your 3rd party resources are having the most impact on your application.
For more information about the data displayed, see Real User Monitoring Data Security.
Further Reading
Documentation, liens et articles supplémentaires utiles:


