- Principales informations
- Getting Started
- Datadog
- Site Datadog
- DevSecOps
- Serverless for AWS Lambda
- Agent
- Intégrations
- Conteneurs
- Dashboards
- Monitors
- Logs
- Tracing
- Profileur
- Tags
- API
- Service Catalog
- Session Replay
- Continuous Testing
- Surveillance Synthetic
- Incident Management
- Database Monitoring
- Cloud Security Management
- Cloud SIEM
- Application Security Management
- Workflow Automation
- CI Visibility
- Test Visibility
- Intelligent Test Runner
- Code Analysis
- Learning Center
- Support
- Glossary
- Standard Attributes
- Guides
- Agent
- Intégrations
- OpenTelemetry
- Développeurs
- Authorization
- DogStatsD
- Checks custom
- Intégrations
- Create an Agent-based Integration
- Create an API Integration
- Create a Log Pipeline
- Integration Assets Reference
- Build a Marketplace Offering
- Create a Tile
- Create an Integration Dashboard
- Create a Recommended Monitor
- Create a Cloud SIEM Detection Rule
- OAuth for Integrations
- Install Agent Integration Developer Tool
- Checks de service
- IDE Plugins
- Communauté
- Guides
- API
- Application mobile
- CoScreen
- Cloudcraft
- In The App
- Dashboards
- Notebooks
- DDSQL Editor
- Alertes
- Infrastructure
- Métriques
- Watchdog
- Bits AI
- Service Catalog
- API Catalog
- Error Tracking
- Service Management
- Infrastructure
- Universal Service Monitoring
- Conteneurs
- Sans serveur
- Surveillance réseau
- Cloud Cost
- Application Performance
- APM
- Profileur en continu
- Database Monitoring
- Agent Integration Overhead
- Setup Architectures
- Configuration de Postgres
- Configuration de MySQL
- Configuration de SQL Server
- Setting Up Oracle
- Setting Up MongoDB
- Connecting DBM and Traces
- Données collectées
- Exploring Database Hosts
- Explorer les métriques de requête
- Explorer des échantillons de requêtes
- Dépannage
- Guides
- Data Streams Monitoring
- Data Jobs Monitoring
- Digital Experience
- RUM et Session Replay
- Product Analytics
- Surveillance Synthetic
- Continuous Testing
- Software Delivery
- CI Visibility
- CD Visibility
- Test Visibility
- Exécuteur de tests intelligent
- Code Analysis
- Quality Gates
- DORA Metrics
- Securité
- Security Overview
- Cloud SIEM
- Cloud Security Management
- Application Security Management
- AI Observability
- Log Management
- Pipelines d'observabilité
- Log Management
- Administration
Correlate APM Data with Other Telemetry
Cette page n'est pas encore disponible en français, sa traduction est en cours.
Si vous avez des questions ou des retours sur notre projet de traduction actuel, n'hésitez pas à nous contacter.
Si vous avez des questions ou des retours sur notre projet de traduction actuel, n'hésitez pas à nous contacter.
Correlating data by various Datadog products gives context to help estimate the business impact and find the root cause of an issue in a few clicks. Set up connections between incoming data to facilitate quick pivots in your explorers and dashboards.
Correlate Database Monitoring and traces
Inject trace IDs into DBM data collection to correlate the two data sources. View database information in APM and APM information in DBM to see a comprehensive, unified view of your system’s performance. See Connect DBM and Traces to set it up.
Correlate logs and traces
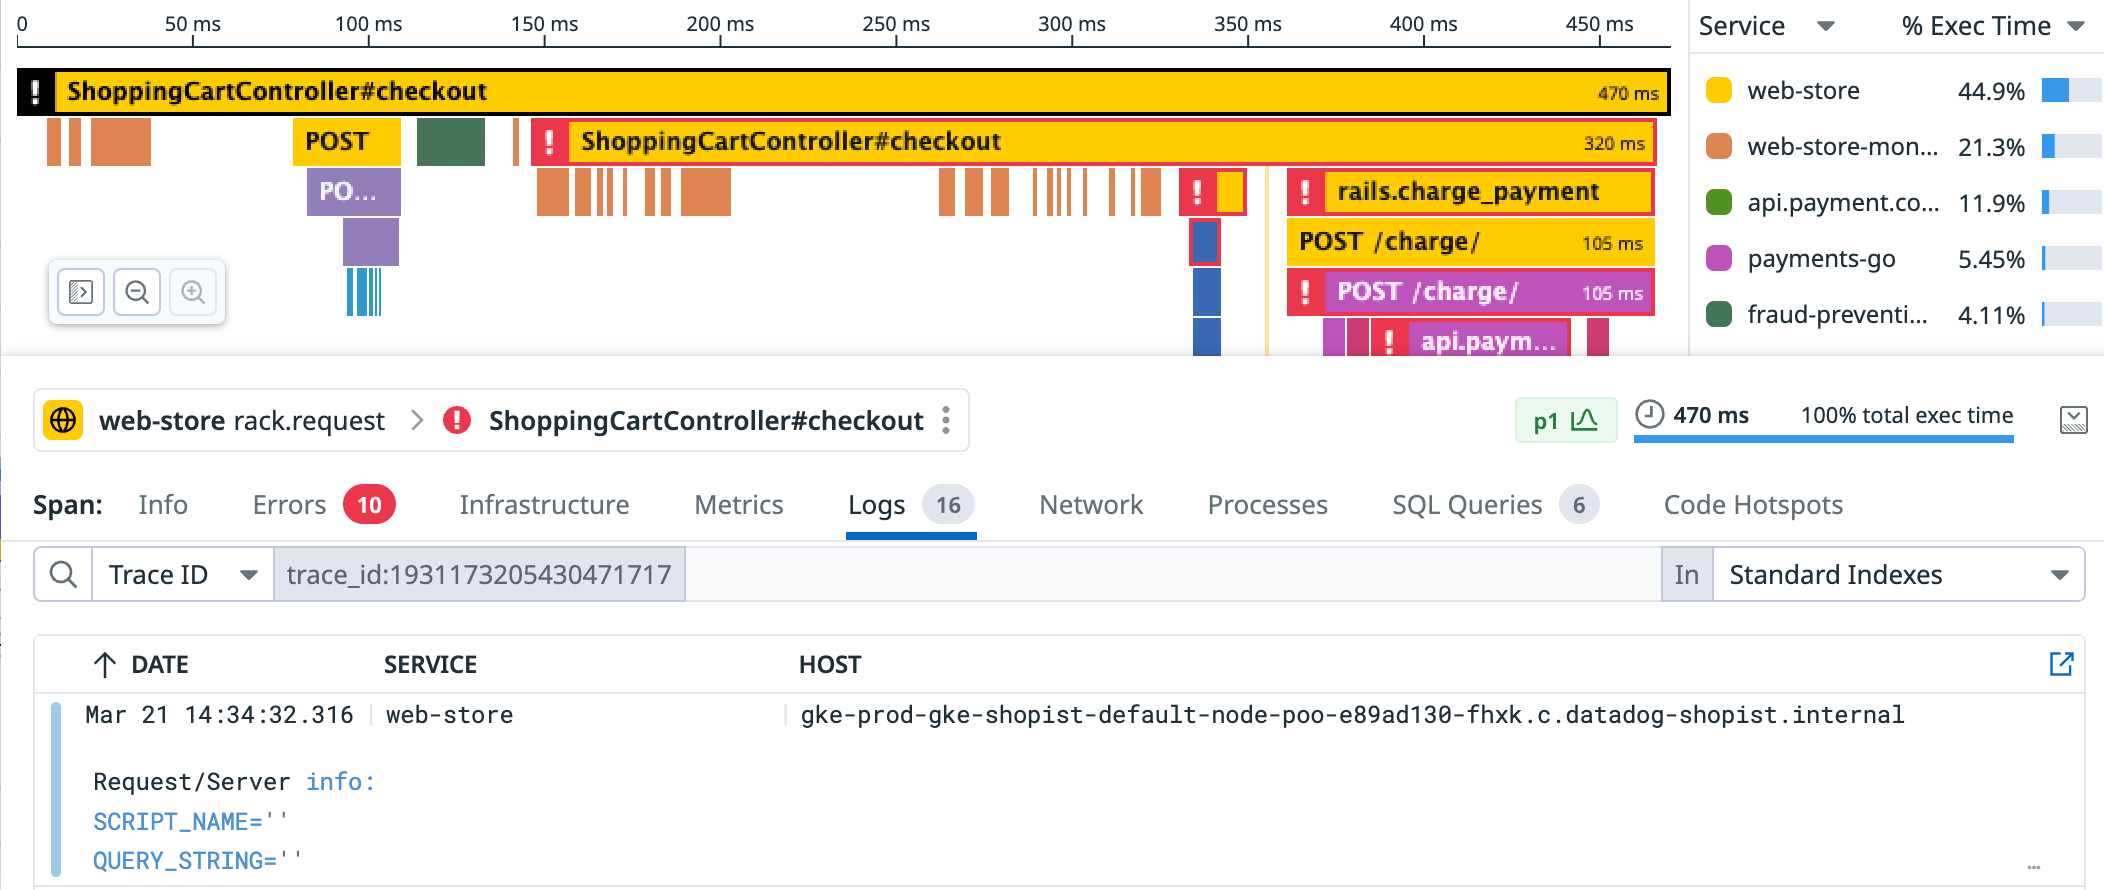
Inject trace IDs into logs, and leverage unified service tagging to find the exact logs associated with a specific service and version, or all logs correlated to an observed trace. See Connect Logs and Traces to set it up.
Correlate RUM and traces
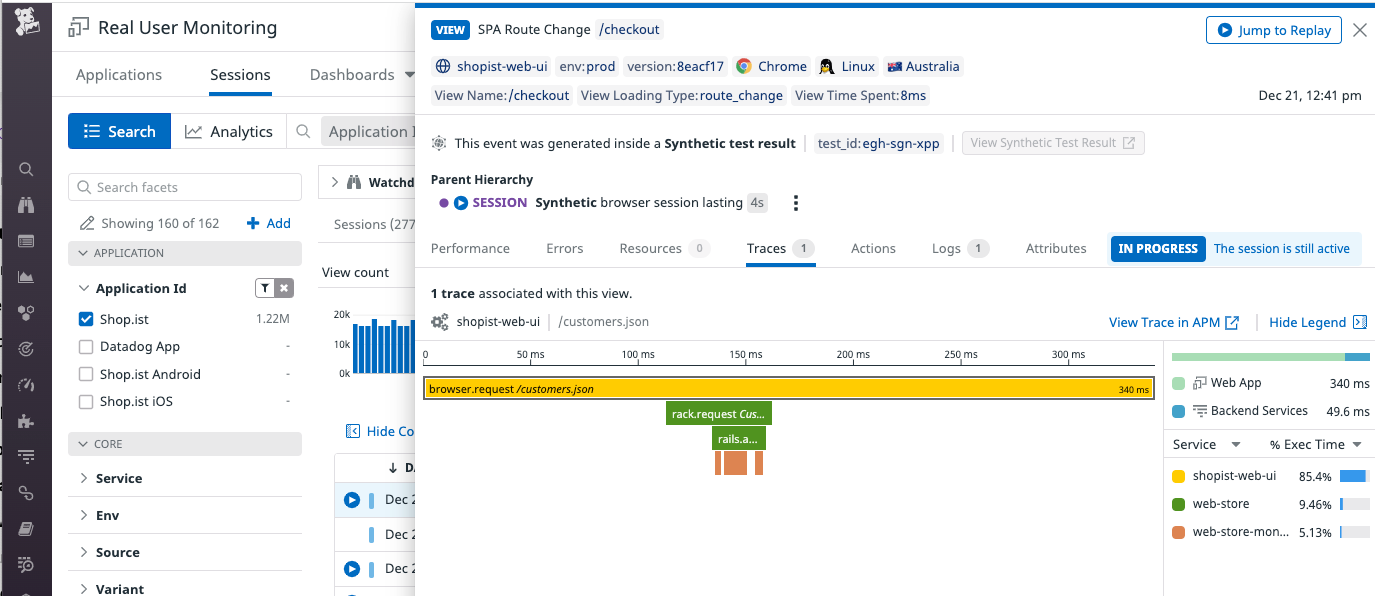
Correlate data collected in front end views with trace and spans on the back end by Connecting RUM and Traces. Pinpoint issues anywhere in your stack and understand what your users are experiencing.
Correlate synthetic tests and traces
Follow the data from failing synthetic tests directly through to the root causes by digging into related traces. Connect Synthetics and Traces to speed up troubleshooting your code.
Correlate profiles and traces
Performance data for application code that has both tracing and profiling enabled is automatically correlated, letting you move between the two types of analysis to troubleshoot and problem solve. You can move directly from span information to profiling data on the Profiles tab, and find specific lines of code related to performance issues. Similarly, you can debug slow and resource-consuming endpoints directly in the Profiling UI.
Read Investigate Slow Traces or Endpoints for more information.
Further Reading
Documentation, liens et articles supplémentaires utiles:


