- Essentials
- Getting Started
- Datadog
- Datadog Site
- DevSecOps
- Serverless for AWS Lambda
- Agent
- Integrations
- Containers
- Dashboards
- Monitors
- Logs
- APM Tracing
- Profiler
- Tags
- API
- Service Catalog
- Session Replay
- Continuous Testing
- Synthetic Monitoring
- Incident Management
- Database Monitoring
- Cloud Security Management
- Cloud SIEM
- Application Security Management
- Workflow Automation
- CI Visibility
- Test Visibility
- Test Impact Analysis
- Code Analysis
- Learning Center
- Support
- Glossary
- Standard Attributes
- Guides
- Agent
- Integrations
- OpenTelemetry
- Developers
- Authorization
- DogStatsD
- Custom Checks
- Integrations
- Create an Agent-based Integration
- Create an API Integration
- Create a Log Pipeline
- Integration Assets Reference
- Build a Marketplace Offering
- Create a Tile
- Create an Integration Dashboard
- Create a Recommended Monitor
- Create a Cloud SIEM Detection Rule
- OAuth for Integrations
- Install Agent Integration Developer Tool
- Service Checks
- IDE Plugins
- Community
- Guides
- API
- Datadog Mobile App
- CoScreen
- Cloudcraft
- In The App
- Dashboards
- Notebooks
- DDSQL Editor
- Sheets
- Monitors and Alerting
- Infrastructure
- Metrics
- Watchdog
- Bits AI
- Service Catalog
- API Catalog
- Error Tracking
- Service Management
- Infrastructure
- Application Performance
- APM
- Continuous Profiler
- Database Monitoring
- Data Streams Monitoring
- Data Jobs Monitoring
- Digital Experience
- Real User Monitoring
- Product Analytics
- Synthetic Testing and Monitoring
- Continuous Testing
- Software Delivery
- CI Visibility
- CD Visibility
- Test Optimization
- Code Analysis
- Quality Gates
- DORA Metrics
- Security
- Security Overview
- Cloud SIEM
- Cloud Security Management
- Application Security Management
- AI Observability
- Log Management
- Observability Pipelines
- Log Management
- Administration
Getting Started with Continuous Testing
Overview
Continuous Testing enables you to automatically run and monitor the same Synthetic tests you’ve configured in your staging, QA, and pre-production environments, which proactively alert your team and block your pipeline deployments when code changes cause test failures.
Your Continuous Testing tests can:
- Launch API requests on your systems
- Simulate browser scenarios within your web application
- Test functionality within your iOS and Android applications
You can set up parallelization, which allows you to execute multiple tests in your CI/CD pipelines simultaneously rather than sequentially to help speed up your building, testing, and deployment processes. Once your tests run, examine test results and CI batches in the Synthetic Monitoring & Testing Results Explorer.
To improve your developer workflow with Continuous Testing, you can:
- Use the
datadog-ciNPM package to run tests directly in your CI pipeline. - Use the Datadog Synthetics VS Code Integration to run tests directly in your IDE.
Continuous Testing accelerates your organization’s application development by automating end-to-end testing across the entire software lifecycle. You can run tests in local and staging environments, parallelize test runs, and integrate with CI providers.
Prerequisites
If you haven’t already, create a Datadog account.
Create a Continuous Testing test
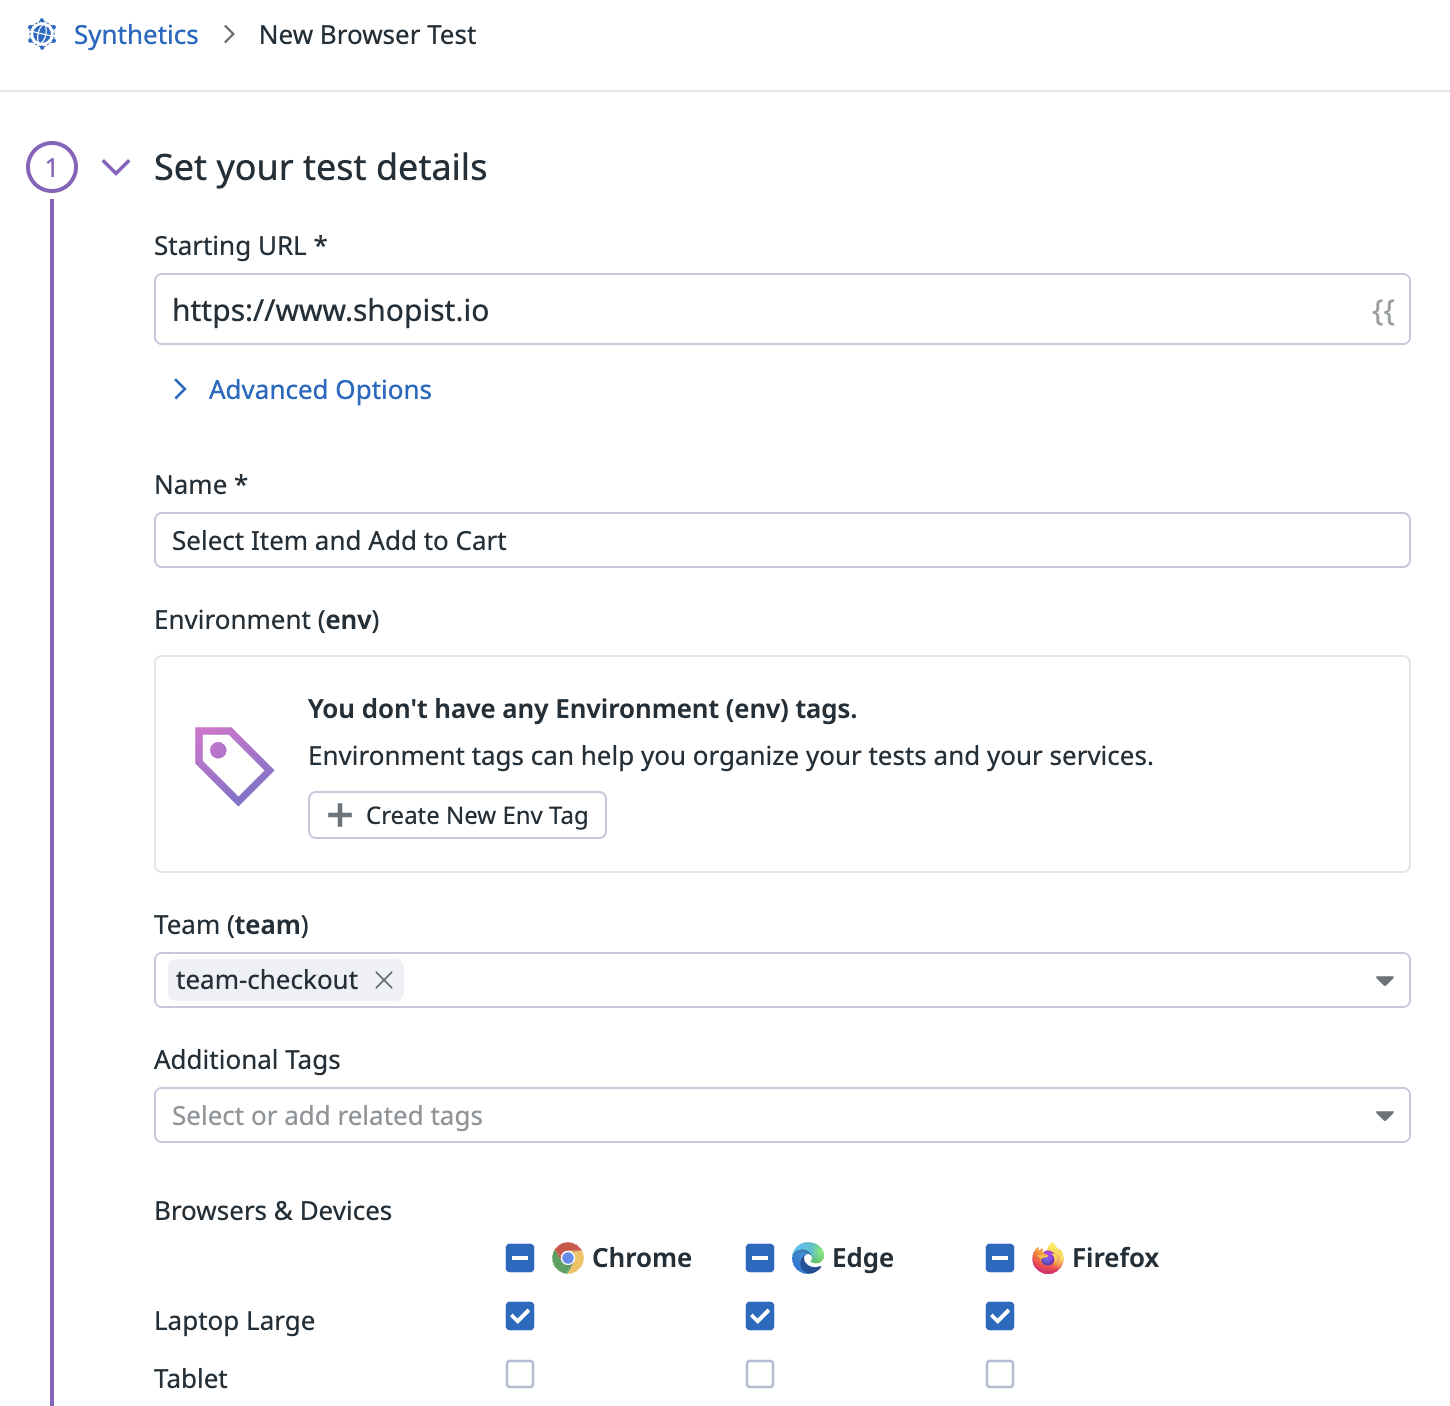
To set up a Continuous Testing test, first create a Synthetic test in Datadog. In this example, create a browser test on the site https://www.shopist.io, a test e-commerce web application.
Browser tests simulate a user’s journey through your web application beginning at your Starting URL. Ensuring your Starting URL is a resource in your staging environment makes it easier to test changes before moving them into production.
Configure your test details
Navigate to Digital Experience > Synthetic Monitoring & Testing > New Test.
In the top right corner, click New Test > Browser Test.
Define your browser test:
- Add the URL of the website you want to monitor into the Starting URL field. For this example, enter
https://www.shopist.io. - Select Advanced Options to set custom request options, certificates, authentication credentials, and more. In this example, no specific advanced option is needed.
- Name your test and set a Team Tag such as team-checkout. Tags allow you to keep your test suite organized and find tests you’re interested in through the Synthetic Monitoring & Testing Results Explorer.
- Choose the browsers and devices to test.
- Add the URL of the website you want to monitor into the Starting URL field. For this example, enter
Continue filling out your test details and your recording like you normally would.
Integrate with a CI provider or collaboration tool
Accelerate your application development by combining testing and troubleshooting in Continuous Testing, streamlining your workflows, and minimizing context switching.
To integrate with a CI provider or a collaboration tool like Slack or Jira, see the respective documentation:
Run your Continuous Testing tests
To improve your development workflow, you can use datadog-ci in your CLI as a CI environment to configure your test. Then run your test directly in your IDE as a developer environment.
Running tests in the CLI
Extend your use of Continuous Testing by using the datadog-ci NPM package. datadog-ci lets you execute commands from within your CI/CD scripts to test your application before deployment. You can automate blocking and rolling back changes when tests fail. Read the datadog-ci Configuration page for installation and setup instructions.
You can use datadog-ci to execute only those tests tagged with specific Datadog Teams tags. For example, to run all tests tagged as team-checkout:
Navigate to your command line.
Run the following command:
datadog-ci synthetics run-tests -search 'tag:team-checkout' --config global.config.json
For more information about running the Synthetics command and using reporters, see the Configuration documentation.
Running tests in your IDE
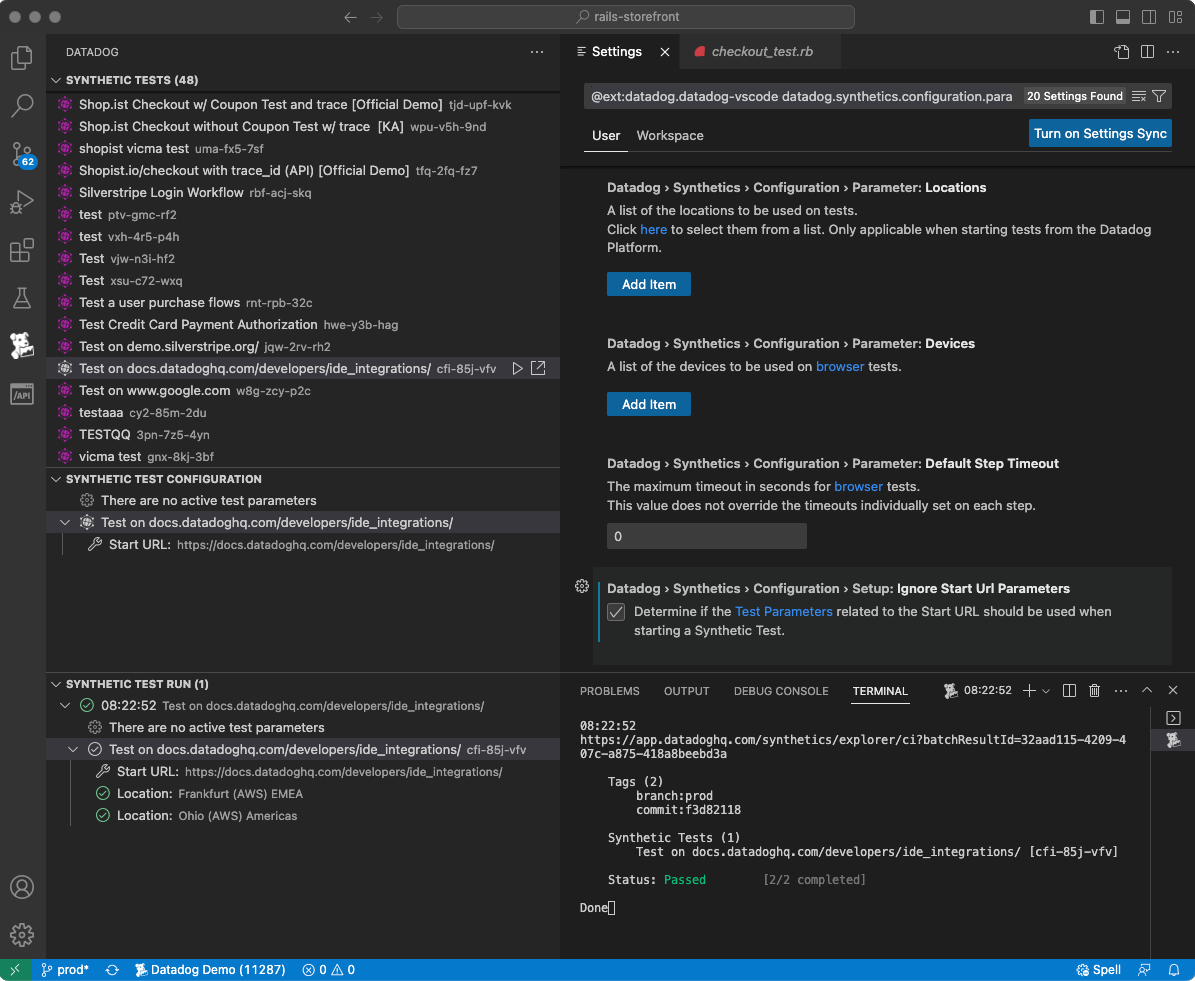
Separately, you can use the Datadog Synthetics VS Code Integration to help you:
- Use a private location or a local environment to accelerate development locally.
- Run HTTP API tests and browser tests and see their results within VS Code.
- Test only what matters by executing relevant tests at the same time.
Running tests in VS Code
- Open VS Code and install the Datadog Extension from the VS Code Extensions view.
- Open the Datadog Synthetics extension and sign in when prompted.
- Select a Synthetic test to run.
- Set a Start URL.
- Run the test.
Examine results in the Synthetic Monitoring & Testing Results Explorer
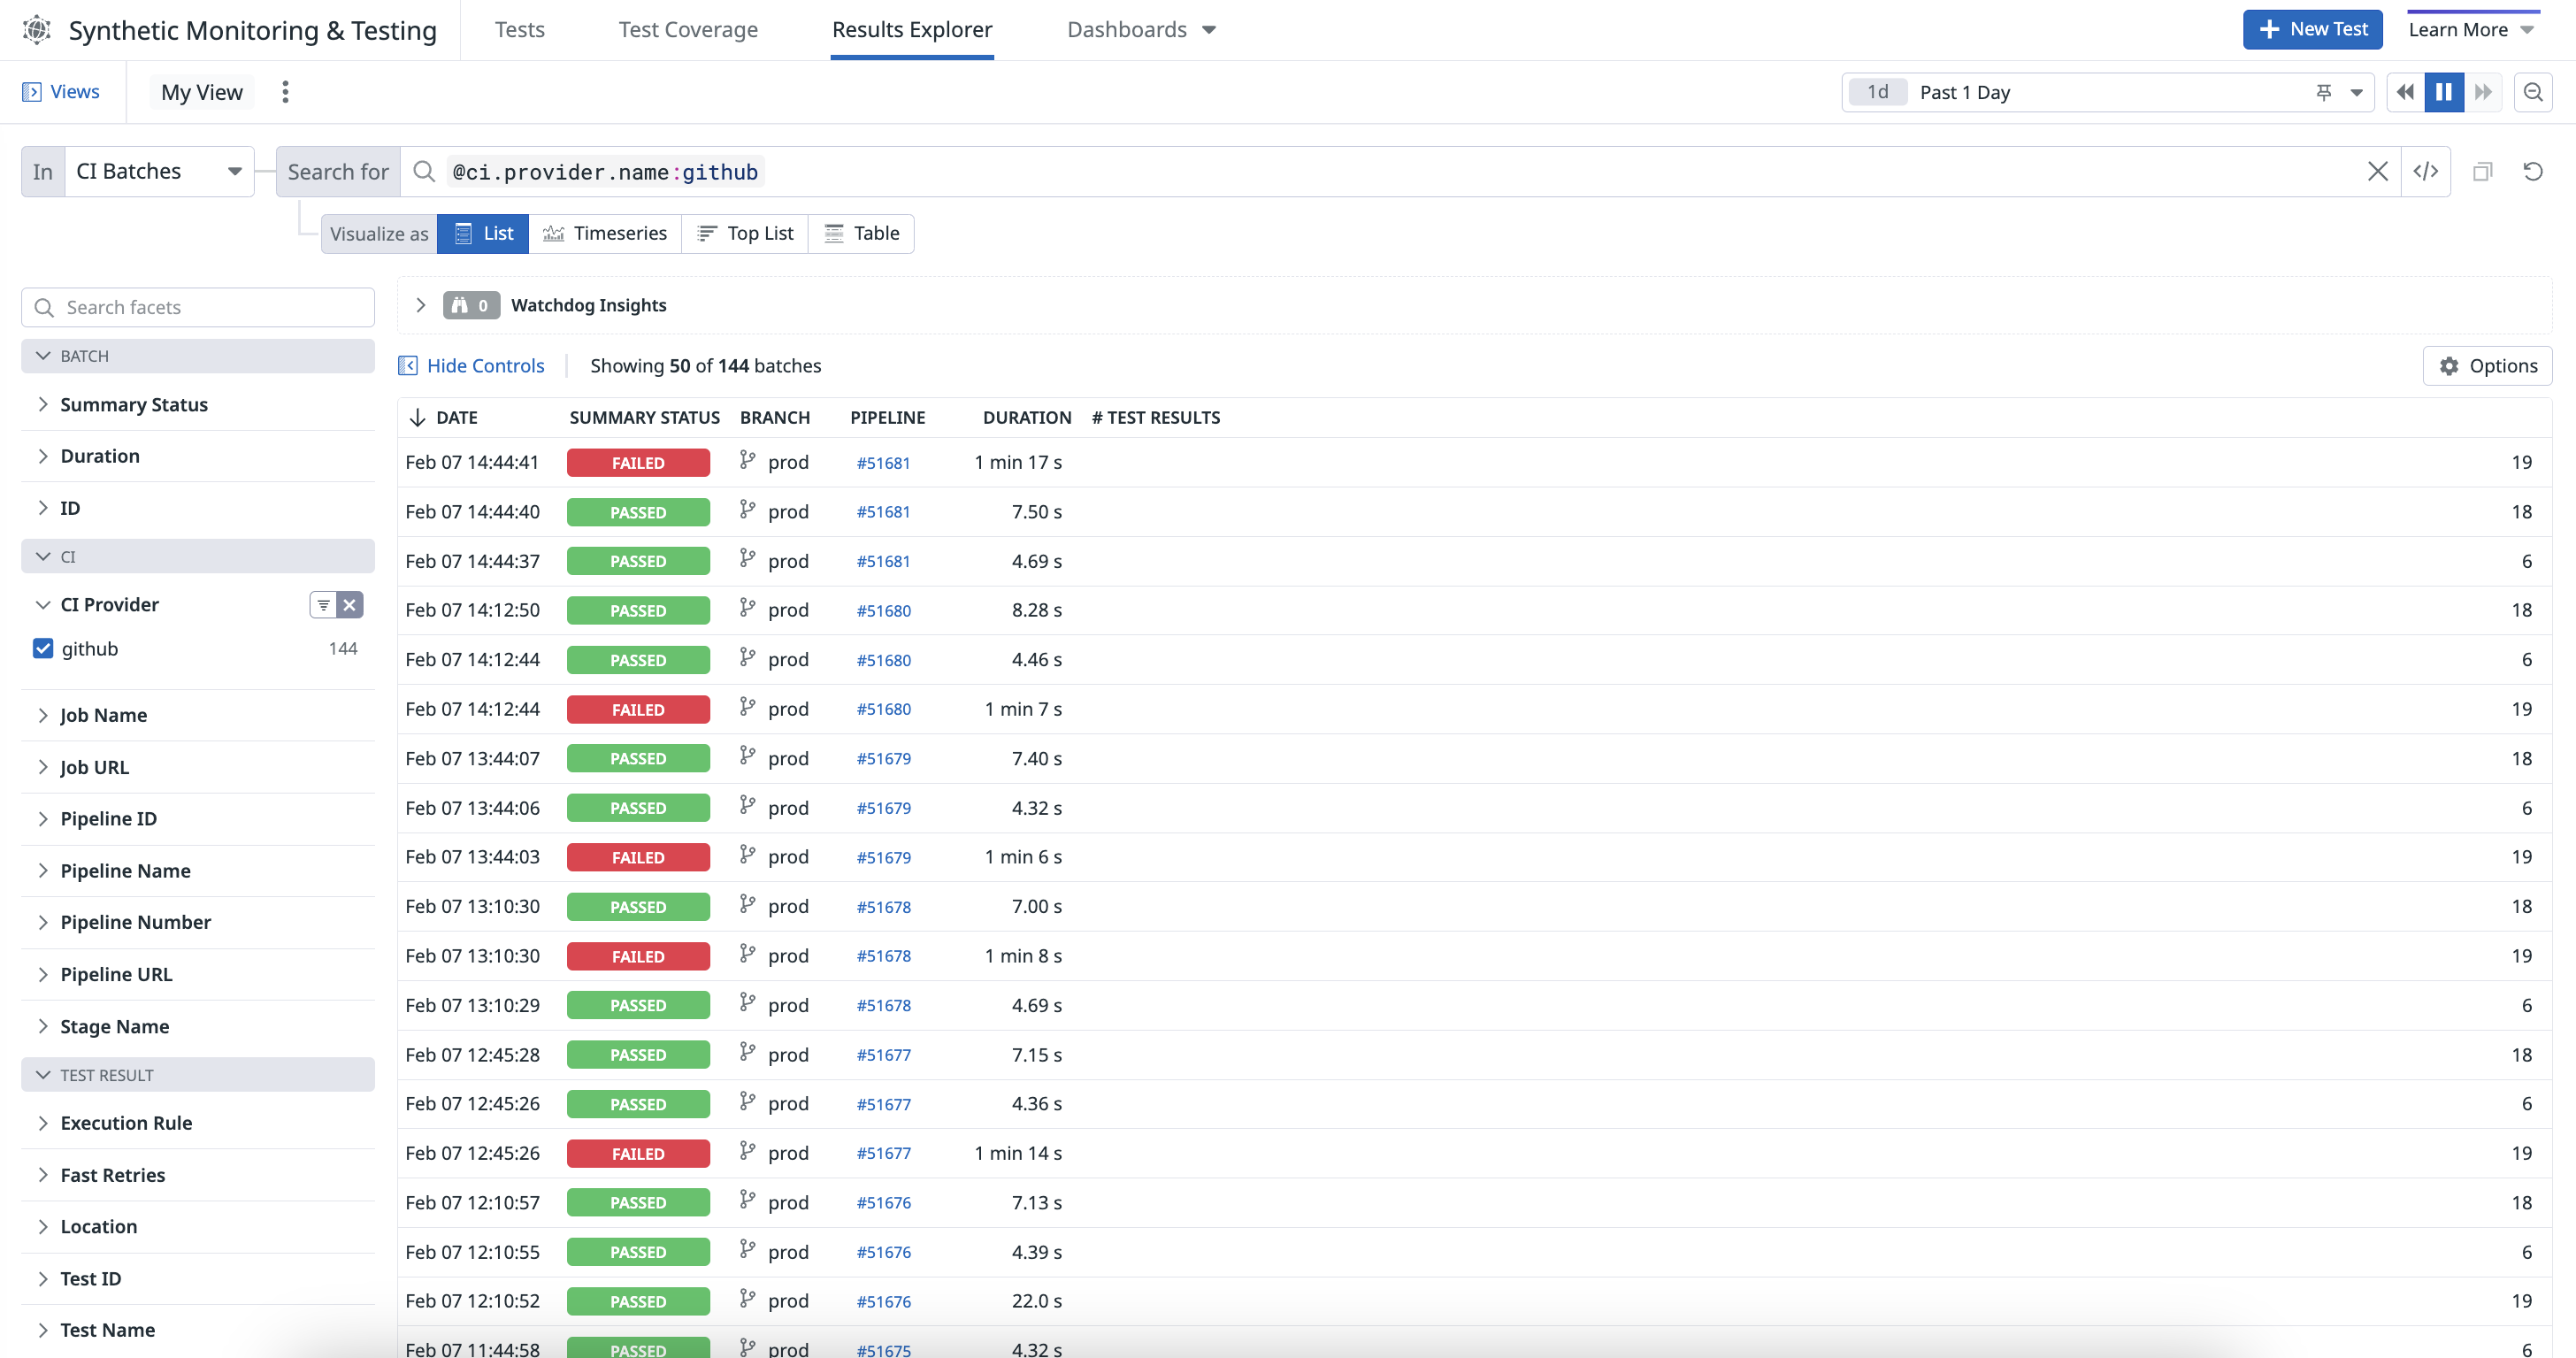
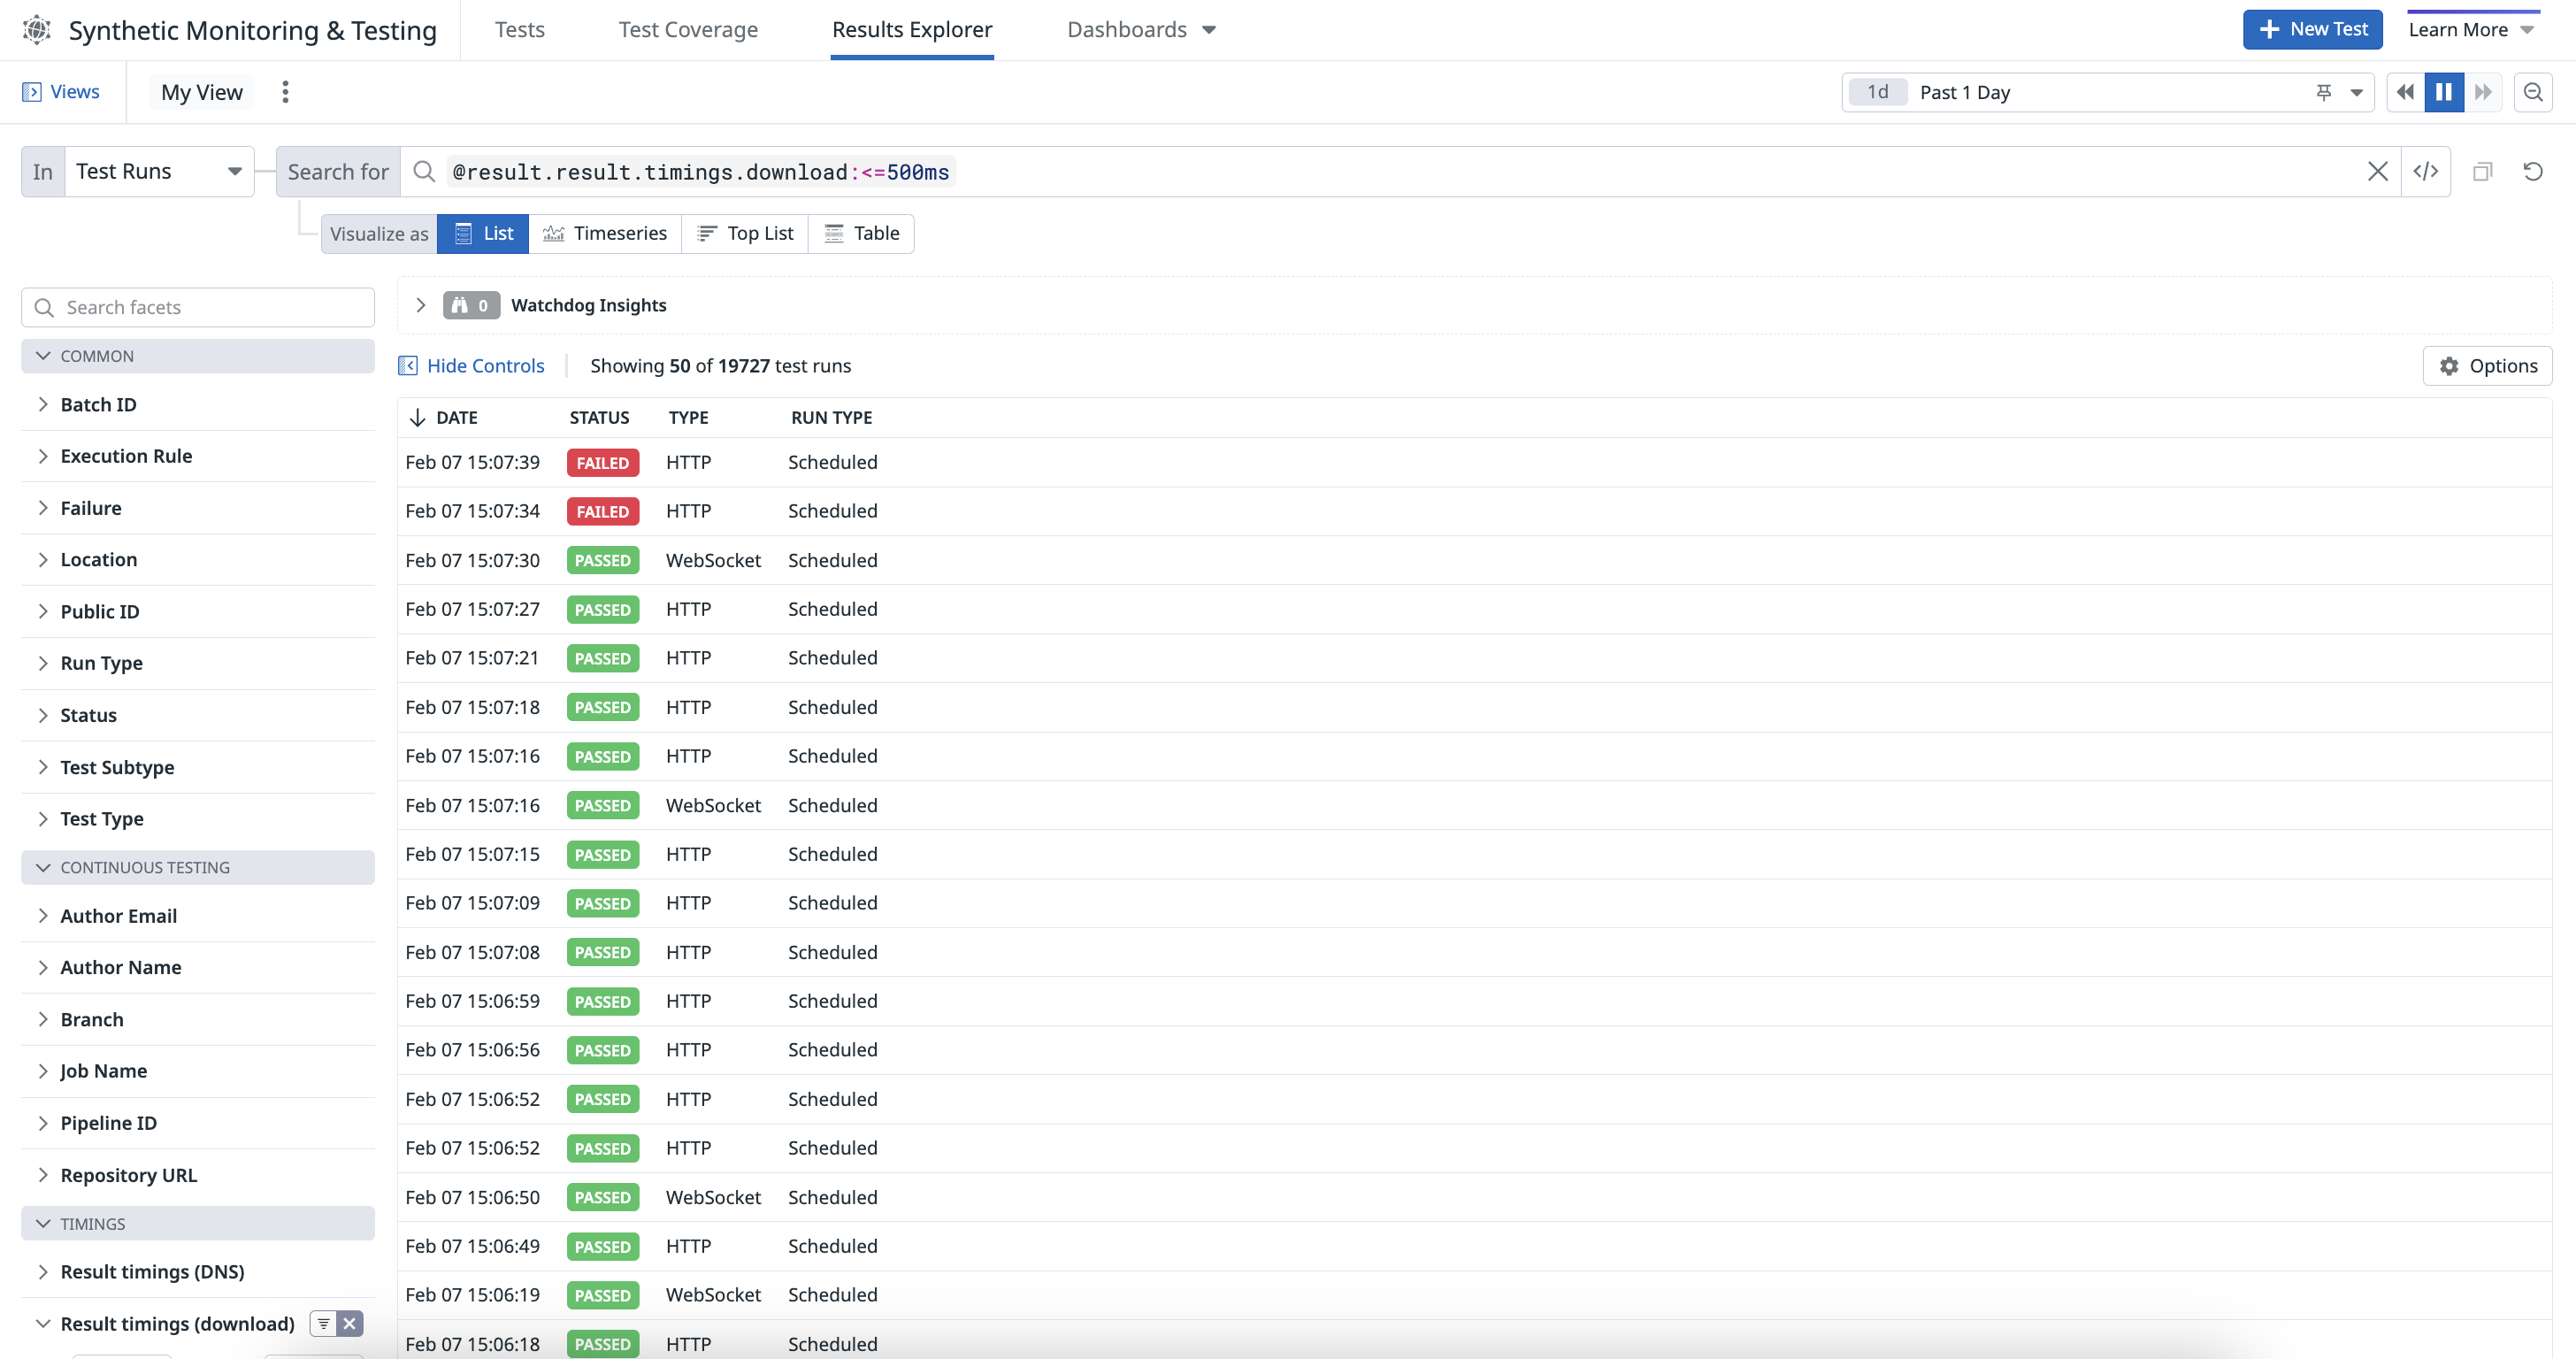
The Synthetic Monitoring & Testing Results Explorer allows you to create visualizations and filter CI batches and test runs for your Continuous Testing tests.
Navigate to Digital Experience > Synthetic Monitoring & Testing > New Test, then select CI Batches or Test Runs to see results from your CI batches or test runs in the Explorer. Select a CI batch or test from the list to get a more detailed view of the result.
Create a search query
Explore one of the following out-of-the-box search queries to start filtering your CI batches or test runs.
Optionally, you can create a query to search your test runs. Using the browser test you created above, locate the Test ID and create a search query using the common test run facets.
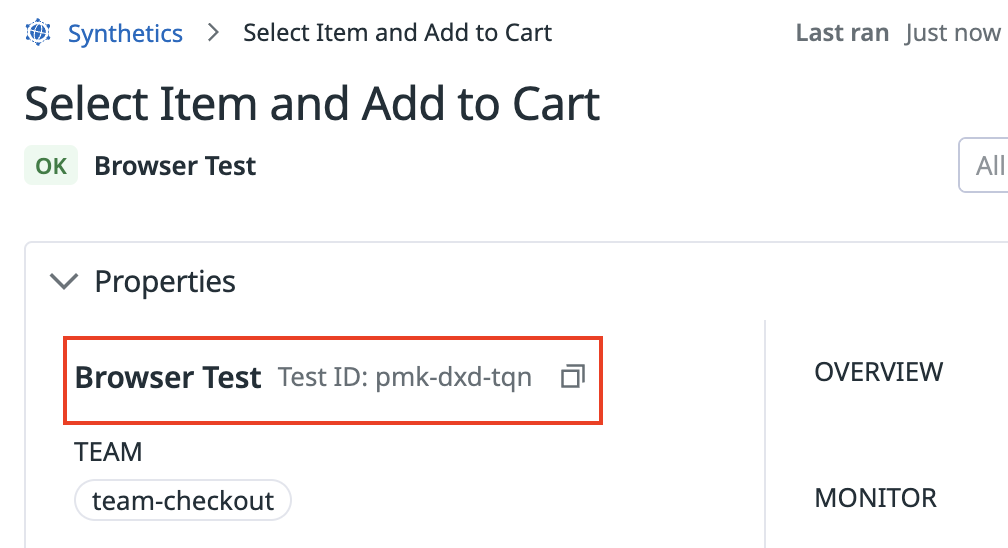
To find the ID of your browser test:
- Navigate to the Tests page.
- Select a test.
- Look for the Test ID in the Properties section.
For more information about using facets in your search query, see Search Test Runs.
To export your view of the Synthetic Monitoring & Testing Results Explorer, click > Views. For more information, see Saved Views.
Set parallelization preferences
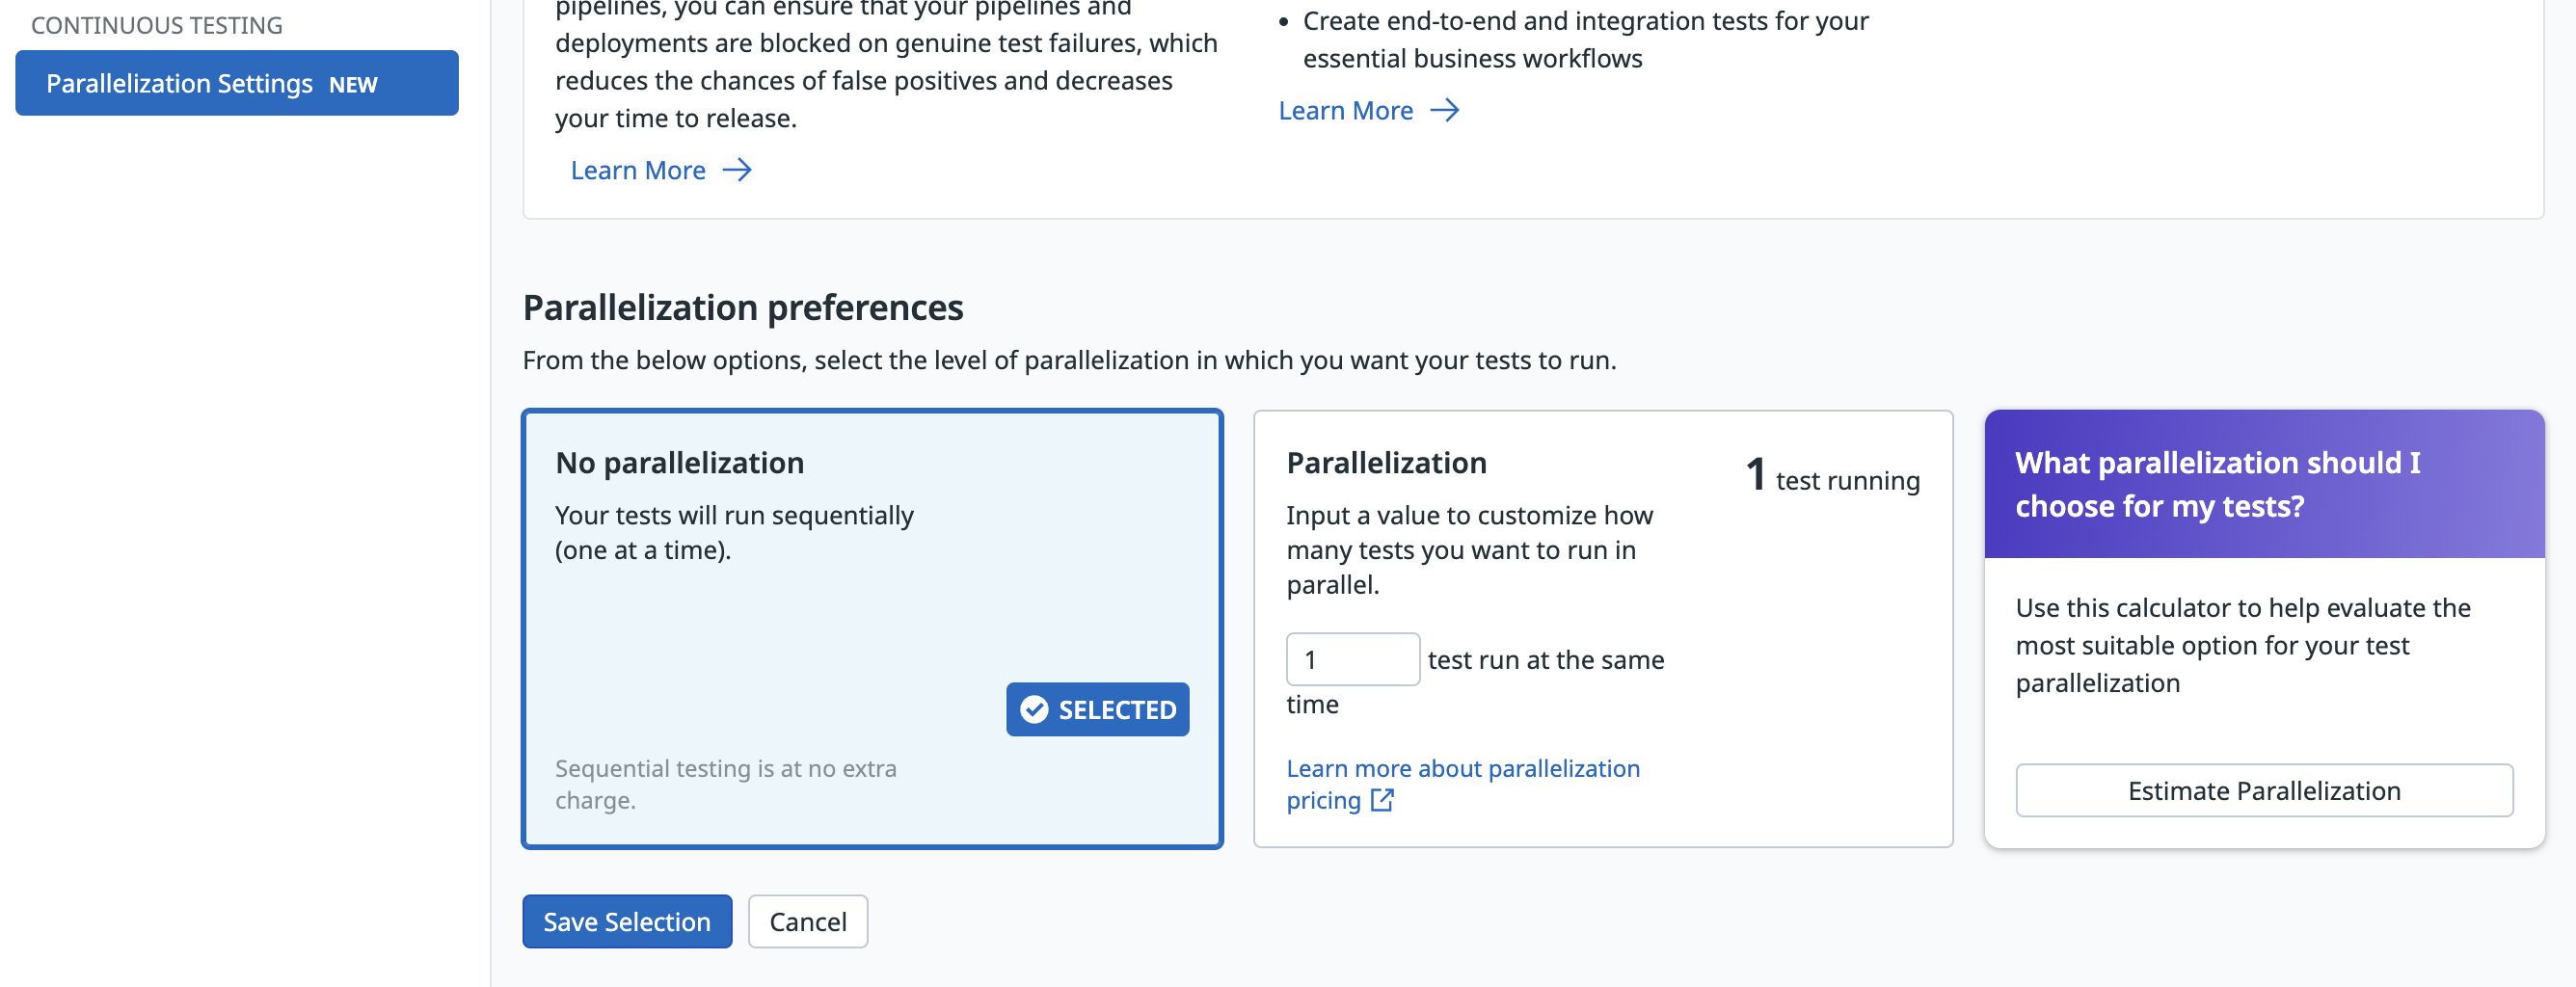
By default, Synthetic tests are not parallelized. Parallelization allows you to run multiple tests in your CI/CD pipelines simultaneously. If you want to parallelize your tests, you can use the Estimate Parallelization calculator to determine your needs.
Navigate to Digital Experience > Synthetic Monitoring & Testing > Settings to locate the calculator.
For instance, if you have 24 tests per CI batch, each taking 2 minutes to complete, and your target is for all tests to be completed within 4 minutes, you need to run 12 tests in parallel.
$$\text"estimated parallelization" = {\text"24 tests per CI batch"* \text"2 minute duration"} / \text"4 minute expected duration in your CI pipeline"$$
Once you’re done estimating your parallelization, input the number of test runs you want to execute at the same time in the Parallelization modal. Then, click Save Selection.
For more information, see the Parallelization documentation.
Further Reading
Additional helpful documentation, links, and articles:
