- Essentials
- Getting Started
- Datadog
- Datadog Site
- DevSecOps
- Serverless for AWS Lambda
- Agent
- Integrations
- Containers
- Dashboards
- Monitors
- Logs
- APM Tracing
- Profiler
- Tags
- API
- Service Catalog
- Session Replay
- Continuous Testing
- Synthetic Monitoring
- Incident Management
- Database Monitoring
- Cloud Security Management
- Cloud SIEM
- Application Security Management
- Workflow Automation
- CI Visibility
- Test Visibility
- Test Impact Analysis
- Code Analysis
- Learning Center
- Support
- Glossary
- Standard Attributes
- Guides
- Agent
- Integrations
- OpenTelemetry
- Developers
- Authorization
- DogStatsD
- Custom Checks
- Integrations
- Create an Agent-based Integration
- Create an API Integration
- Create a Log Pipeline
- Integration Assets Reference
- Build a Marketplace Offering
- Create a Tile
- Create an Integration Dashboard
- Create a Recommended Monitor
- Create a Cloud SIEM Detection Rule
- OAuth for Integrations
- Install Agent Integration Developer Tool
- Service Checks
- IDE Plugins
- Community
- Guides
- API
- Datadog Mobile App
- CoScreen
- Cloudcraft
- In The App
- Dashboards
- Notebooks
- DDSQL Editor
- Sheets
- Monitors and Alerting
- Infrastructure
- Metrics
- Watchdog
- Bits AI
- Service Catalog
- API Catalog
- Error Tracking
- Service Management
- Infrastructure
- Application Performance
- APM
- Continuous Profiler
- Database Monitoring
- Data Streams Monitoring
- Data Jobs Monitoring
- Digital Experience
- Real User Monitoring
- Product Analytics
- Synthetic Testing and Monitoring
- Continuous Testing
- Software Delivery
- CI Visibility
- CD Visibility
- Test Optimization
- Code Analysis
- Quality Gates
- DORA Metrics
- Security
- Security Overview
- Cloud SIEM
- Cloud Security Management
- Application Security Management
- AI Observability
- Log Management
- Observability Pipelines
- Log Management
- Administration
Apollo
Supported OS
Overview
The Apollo Datadog integration enables you to forward Studio performance metrics to your Datadog account. Datadog supports an advanced function API, which enables you to create graphs and alerts for GraphQL metrics.

Studio forwards the following metrics to Datadog:
apollo.operations.count- The number of GraphQL operations that were executed. This includes queries, mutations, and operations that resulted in an error.apollo.operations.error_count- The number of GraphQL operations that resulted in an error. This includes GraphQL execution errors, and HTTP errors if Studio failed to connect to your server.apollo.operations.cache_hit_count- The number of GraphQL queries for which the result was served from Apollo Server’s full query cache.A histogram of GraphQL operation response times, measured in milliseconds. Due to Studio’s aggregation method (logarithmic binning), these values are accurate to +/- 5%:
apollo.operations.latency.minapollo.operations.latency.medianapollo.operations.latency.95percentileapollo.operations.latency.99percentileapollo.operations.latency.maxapollo.operations.latency.avg
These metrics are aggregated in 60-second intervals and tagged with the GraphQL operation name as operation:<query-name>. Unique query signatures with the same operation name are merged, and queries without an operation name are ignored.
These metrics are also tagged with both the associated Studio graph ID (as graph:<graph-id>) and the associated variant name (as variant:<variant-name>), so multiple graphs from Studio can send data to the same Datadog account. If you haven’t set a variant name, then current is used.
(Integrations set up prior to October 2020 have metric names starting with apollo.engine.operations instead of apollo.operations and use a service tag instead of graph. You can migrate to the new metric names in your graph’s Integrations page in Apollo Studio.)
Setup
Configuration
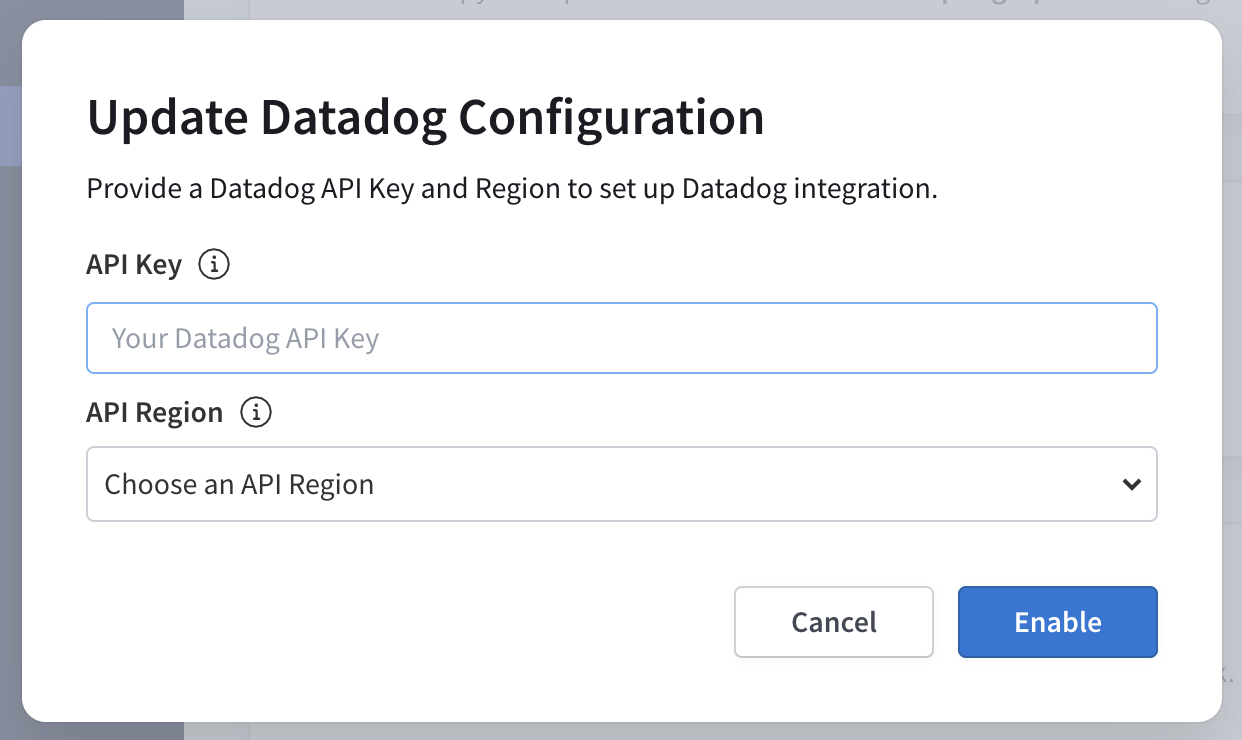
Getting set up with the Apollo Datadog integration is as simple as providing a Datadog API key and region to Studio. There’s no further configuration required.
Go to your Datadog Integrations page and click on the Apollo tile. Then go to the Configuration tab and click Install Integration at the bottom.
Go to your Datadog APIs page and create an API key.
Determine your Datadog API region by looking at your browser’s address bar:
- If the domain name is
app.datadoghq.com, then your API region isUS. - If the domain name is
app.datadoghq.eu, then your API region isEU.
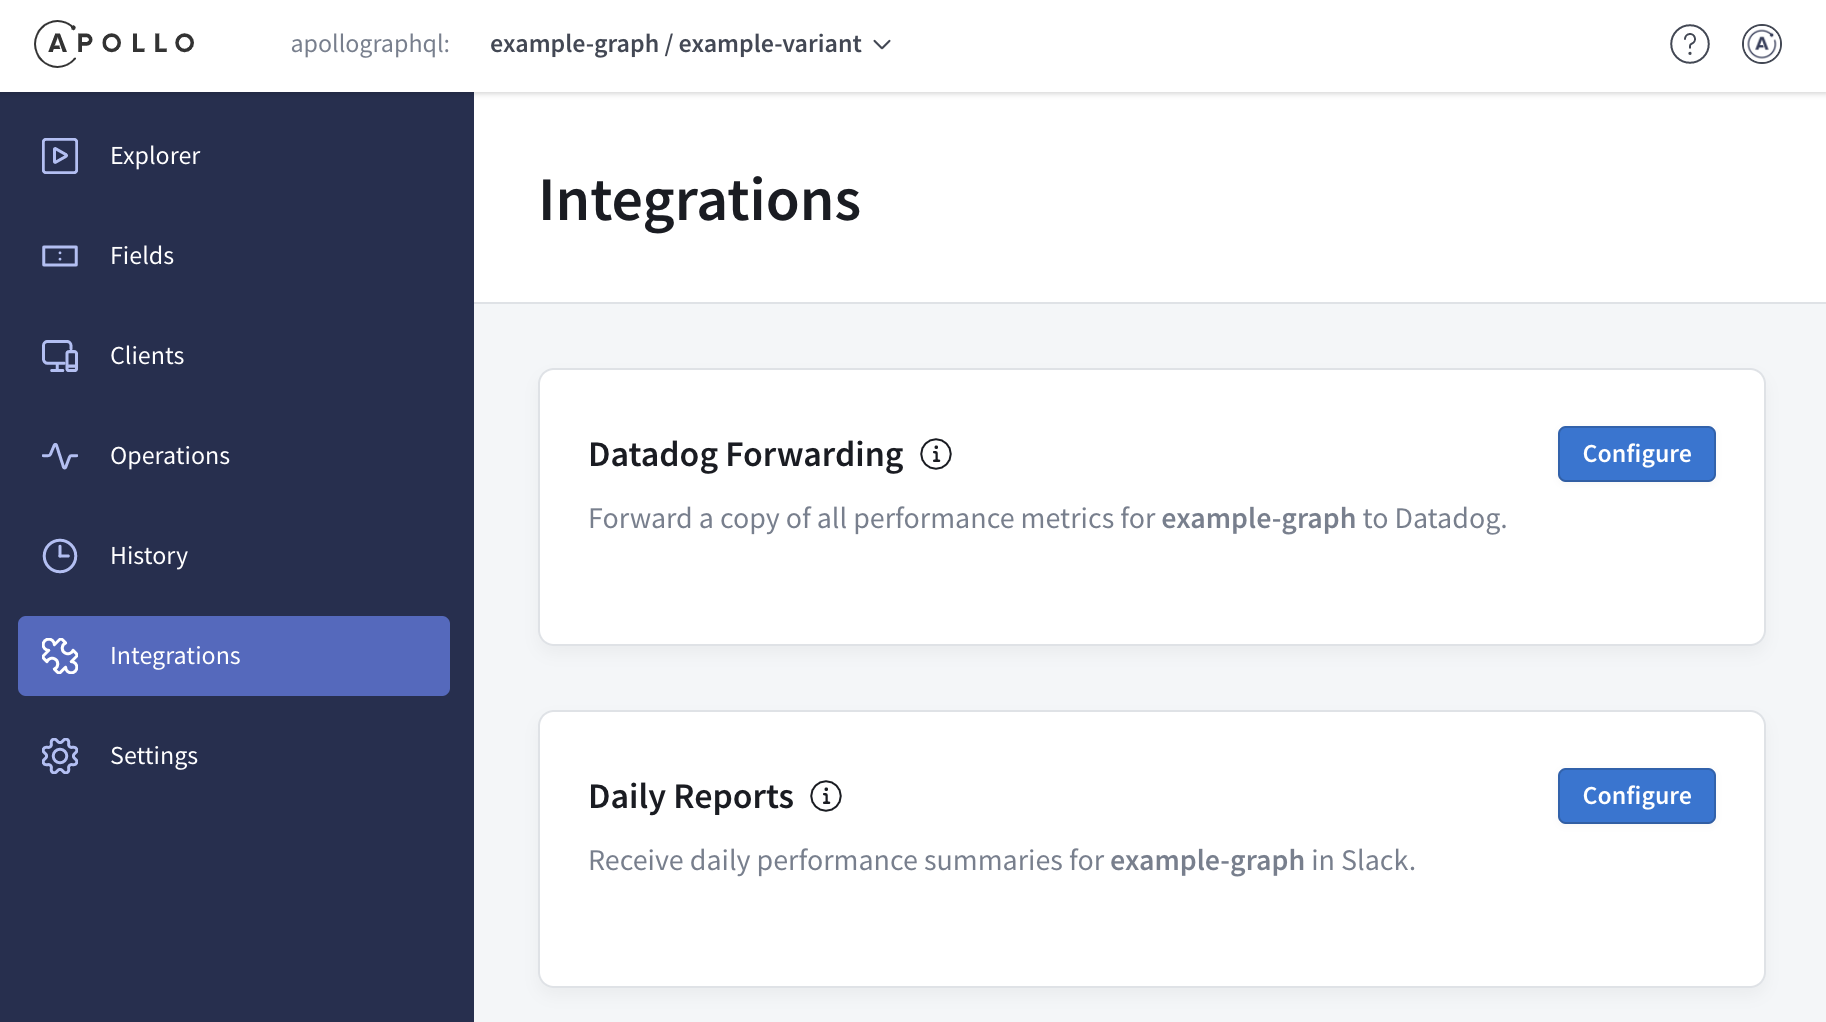
In Studio, go to your graph’s Integrations page:

In the Datadog Forwarding section, click Configure. Provide your API key and region, then click Enable. Because all forwarded metrics are tagged with the corresponding graph’s ID (
graph:<graph-id>), you can use the same API key for all of your graphs.
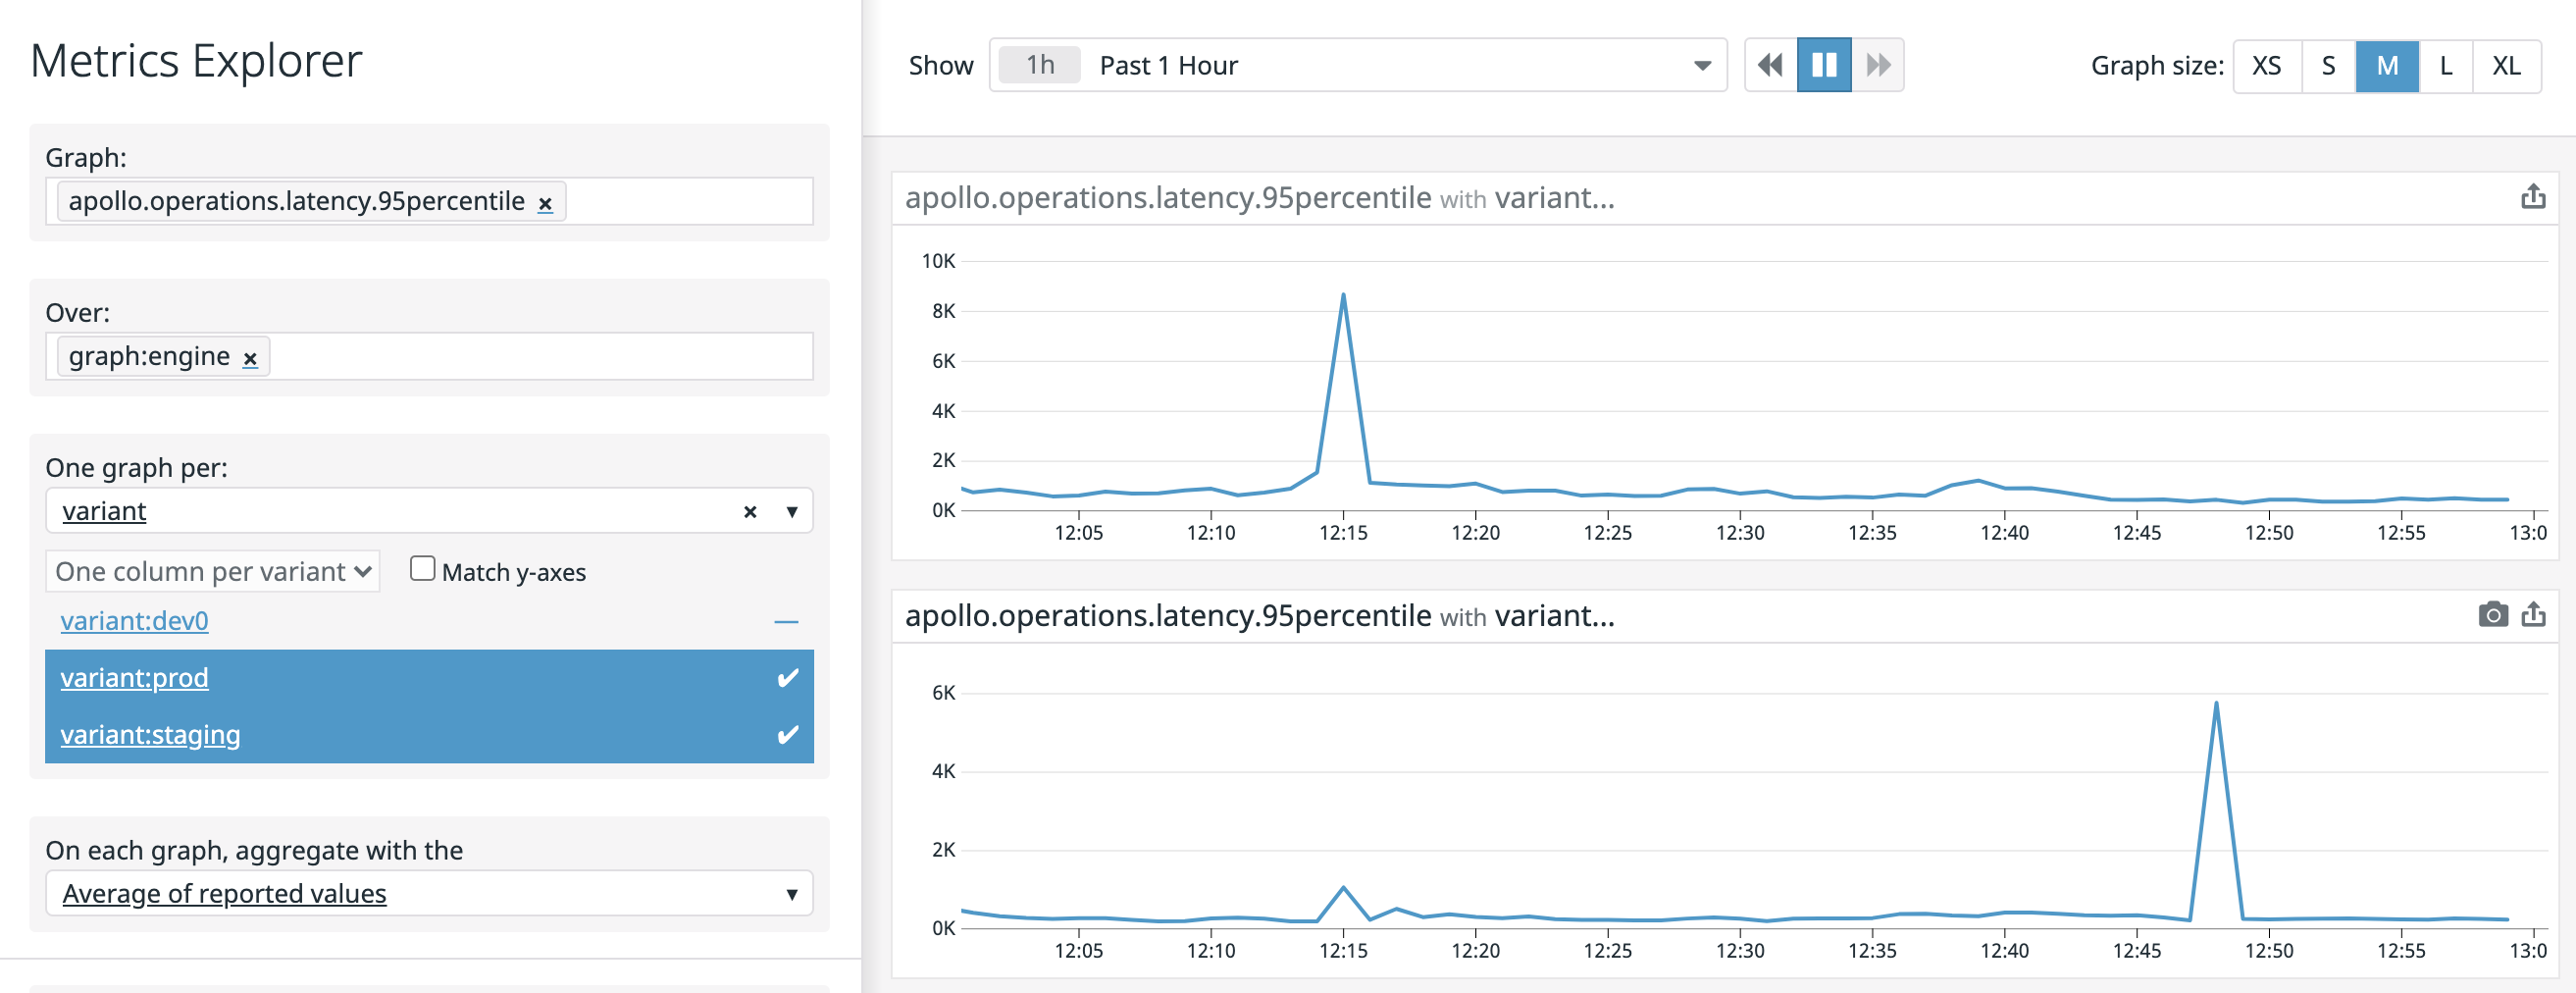
Go to the Datadog metrics explorer to see your metrics. Metrics may take up to five minutes to be visible.
Usage
See the Apollo integrations docs for more detailed usage information.
Data Collected
Metrics
| apollo.operations.count (gauge) | Number of GraphQL operations (queries and mutations) processed. Shown as operation |
| apollo.operations.latency.avg (gauge) | Total request duration for a GraphQL operation, average. Shown as millisecond |
| apollo.operations.latency.median (gauge) | Total request duration for a GraphQL operation, median/50th percentile. Shown as millisecond |
| apollo.operations.latency.95percentile (gauge) | Total request duration for a GraphQL operation, 95th percentile. Shown as millisecond |
| apollo.operations.latency.99percentile (gauge) | Total request duration for a GraphQL operation, 99th percentile. Shown as millisecond |
| apollo.operations.latency.max (gauge) | Total request duration for a GraphQL operation, max/100th percentile. Shown as millisecond |
| apollo.operations.latency.min (gauge) | Total request duration for a GraphQL operation, min/0th percentile. Shown as millisecond |
| apollo.operations.error_count (gauge) | Number of GraphQL operations that resulted in a GraphQL error, including HTTP errors from origins. Shown as error |
| apollo.operations.cache_hit_count (gauge) | Number of GraphQL queries that were served from the full response cache. Shown as hit |
| apollo.engine.operations.count (gauge) | Number of GraphQL operations (queries and mutations) processed. (Legacy metric; new integrations use apollo.operations.count.) Shown as operation |
| apollo.engine.operations.latency.avg (gauge) | Total request duration for a GraphQL operation, average. (Legacy metric; new integrations use apollo.operations.latency.avg.) Shown as millisecond |
| apollo.engine.operations.latency.median (gauge) | Total request duration for a GraphQL operation, median/50th percentile. (Legacy metric; new integrations use apollo.operations.latency.median.) Shown as millisecond |
| apollo.engine.operations.latency.95percentile (gauge) | Total request duration for a GraphQL operation, 95th percentile. (Legacy metric; new integrations use apollo.operations.latency.95percentile.) Shown as millisecond |
| apollo.engine.operations.latency.99percentile (gauge) | Total request duration for a GraphQL operation, 99th percentile. (Legacy metric; new integrations use apollo.operations.latency.99percentile.) Shown as millisecond |
| apollo.engine.operations.latency.max (gauge) | Total request duration for a GraphQL operation, max/100th percentile. (Legacy metric; new integrations use apollo.operations.latency.max.) Shown as millisecond |
| apollo.engine.operations.latency.min (gauge) | Total request duration for a GraphQL operation, min/0th percentile. (Legacy metric; new integrations use apollo.operations.latency.min.) Shown as millisecond |
| apollo.engine.operations.error_count (gauge) | Number of GraphQL operations that resulted in a GraphQL error, including HTTP errors from origins. (Legacy metric; new integrations use apollo.operations.error_count.) Shown as error |
| apollo.engine.operations.cache_hit_count (gauge) | Number of GraphQL queries that were served from the full response cache. (Legacy metric; new integrations use apollo.operations.cachehitcount.) Shown as hit |
Events
The Apollo integration does not include any events at this time.
Service Checks
The Apollo integration does not include any service checks at this time.
Troubleshooting
Need help? Contact Datadog Support.
