- Essentials
- Getting Started
- Datadog
- Datadog Site
- DevSecOps
- Serverless for AWS Lambda
- Agent
- Integrations
- Containers
- Dashboards
- Monitors
- Logs
- APM Tracing
- Profiler
- Tags
- API
- Service Catalog
- Session Replay
- Continuous Testing
- Synthetic Monitoring
- Incident Management
- Database Monitoring
- Cloud Security Management
- Cloud SIEM
- Application Security Management
- Workflow Automation
- CI Visibility
- Test Visibility
- Test Impact Analysis
- Code Analysis
- Learning Center
- Support
- Glossary
- Standard Attributes
- Guides
- Agent
- Integrations
- OpenTelemetry
- Developers
- Authorization
- DogStatsD
- Custom Checks
- Integrations
- Create an Agent-based Integration
- Create an API Integration
- Create a Log Pipeline
- Integration Assets Reference
- Build a Marketplace Offering
- Create a Tile
- Create an Integration Dashboard
- Create a Recommended Monitor
- Create a Cloud SIEM Detection Rule
- OAuth for Integrations
- Install Agent Integration Developer Tool
- Service Checks
- IDE Plugins
- Community
- Guides
- API
- Datadog Mobile App
- CoScreen
- Cloudcraft
- In The App
- Dashboards
- Notebooks
- DDSQL Editor
- Sheets
- Monitors and Alerting
- Infrastructure
- Metrics
- Watchdog
- Bits AI
- Service Catalog
- API Catalog
- Error Tracking
- Service Management
- Infrastructure
- Application Performance
- APM
- Continuous Profiler
- Database Monitoring
- Data Streams Monitoring
- Data Jobs Monitoring
- Digital Experience
- Real User Monitoring
- Product Analytics
- Synthetic Testing and Monitoring
- Continuous Testing
- Software Delivery
- CI Visibility
- CD Visibility
- Test Optimization
- Code Analysis
- Quality Gates
- DORA Metrics
- Security
- Security Overview
- Cloud SIEM
- Cloud Security Management
- Application Security Management
- AI Observability
- Log Management
- Observability Pipelines
- Log Management
- Administration
Signal Sciences
Supported OS
Overview
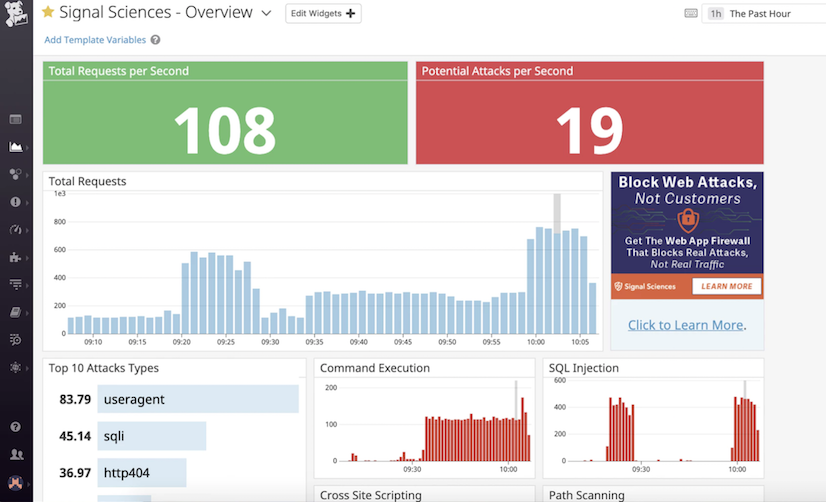
Send Signal Sciences metrics and events to Datadog to monitor real-time attacks and abuse against your applications, APIs, and microservices, and to ensure Signal Sciences is functioning and inspecting traffic as expected.


Get metrics and events from Signal Sciences in real-time to:
See metrics from the WAF related to:
- Total Requests
- Top Types of Potential Attacks
- Command Execution
- SQL Injection
- Cross Site Scripting
- Path Scanning
- Anomalous Traffic
- Unknown Sources
- Server 400/500s
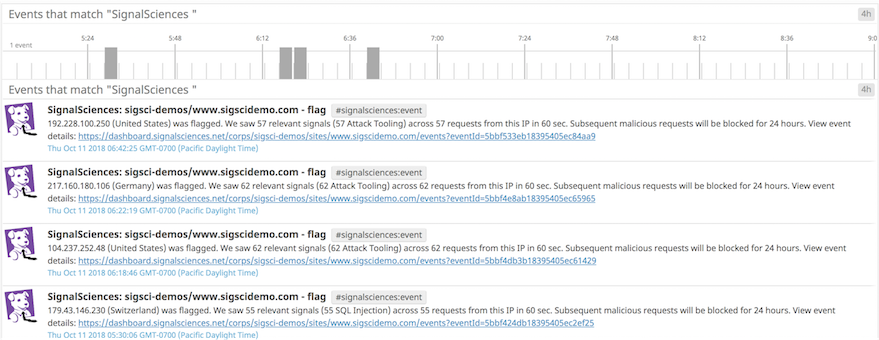
See IPs that Signal Sciences has blocked and/or flagged as malicious from any of the following activities:
- OWASP Injection Attacks
- Application DoS
- Brute Force Attacks
- Application Abuse & Misuse
- Request Rate Limiting
- Account Takeover
- Bad Bots
- Virtual Patching
See alerts on Signal Sciences agent status
Setup
To use the Signal Sciences-Datadog integration, you must be a customer of Signal Sciences. For more information about Signal Sciences, see https://www.signalsciences.com.
Configuration
Metrics collection
Install the Signal Sciences agent.
Configure the Signal Sciences agent to use DogStatsD:
Add the following line to each agent’s agent.config file:
statsd-type = "dogstatsd"When this is done the agent’s StatsD client has tagging enabled and metrics such as
sigsci.agent.signal.<SIGNAL_TYPE>are sent assigsci.agent.signaland tagged withsignal_type:<SIGNAL_TYPE>.Example:
sigsci.agent.signal.http404=>sigsci.agent.signalwith tagsignal_type:http404If using Kubernetes to run the Datadog Agent, make sure to enable DogStatsD non local traffic as described in the Kubernetes DogStatsD documentation.
Configure the SigSci agent to send metrics to the Datadog Agent:
Add the following line to each agent’s
agent.configfile:statsd-address="<DATADOG_AGENT_HOSTNAME>:<DATADOG_AGENT_PORT>"Click the button to install the integration.
In Datadog, verify that the “Signal Sciences - Overview” dashboard is created and starting to capture metrics.
Events collection
Within Datadog, create an API key.
In your Signal Sciences Dashboard on the Site navigation bar, click Manage > Integrations and click Add next to the Datadog Event integration.
Enter the API Key in the API Key field.
Click Add.
For more information, see the Datadog Signal Sciences integration.
Data Collected
Metrics
| sigsci.agent.waf.total (rate) | The number of requests inspected per second. Shown as request |
| sigsci.agent.waf.error (rate) | The number of errors per second while processing requests. Shown as error |
| sigsci.agent.waf.allow (rate) | The number of allow operations per second. Shown as operation |
| sigsci.agent.waf.block (rate) | The number of block operations per second. Shown as operation |
| sigsci.agent.waf.perf.decision_time.50pct (gauge) | The decision time 50th percentile. Shown as second |
| sigsci.agent.waf.perf.decision_time.95pct (gauge) | The decision time 95th percentile. Shown as second |
| sigsci.agent.waf.perf.decision_time.99pct (gauge) | The decision time 99th percentile. Shown as second |
| sigsci.agent.waf.perf.queue_time.50pct (gauge) | The queue time 50th percentile. Shown as second |
| sigsci.agent.waf.perf.queue_time.95pct (gauge) | The queue time 95th percentile. Shown as second |
| sigsci.agent.waf.perf.queue_time.99pct (gauge) | The queue time 99th percentile. Shown as second |
| sigsci.agent.rpc.connections.open (gauge) | The number of open rpc connections. Shown as connection |
| sigsci.agent.runtime.cpu_pct (gauge) | CPU percent used by the agent. Shown as percent |
| sigsci.agent.runtime.mem.sys_bytes (gauge) | Memory used by the agent. Shown as byte |
| sigsci.agent.runtime.uptime (gauge) | Agent uptime in seconds. Shown as second |
| sigsci.agent.signal (rate) | Number of signals of each type per second.. |
Events
Events are created and sent to your Datadog Event Stream when an IP address is flagged in Signal Sciences.
Service Checks
The Signal Sciences integration does not include any service checks.
Troubleshooting
Need help? Contact Datadog support.
Further Reading
Additional helpful documentation, links, and articles:
