- 重要な情報
- はじめに
- Datadog
- Datadog サイト
- DevSecOps
- AWS Lambda のサーバーレス
- エージェント
- インテグレーション
- コンテナ
- ダッシュボード
- アラート設定
- ログ管理
- トレーシング
- プロファイラー
- タグ
- API
- Service Catalog
- Session Replay
- Continuous Testing
- Synthetic モニタリング
- Incident Management
- Database Monitoring
- Cloud Security Management
- Cloud SIEM
- Application Security Management
- Workflow Automation
- CI Visibility
- Test Visibility
- Intelligent Test Runner
- Code Analysis
- Learning Center
- Support
- 用語集
- Standard Attributes
- ガイド
- インテグレーション
- エージェント
- OpenTelemetry
- 開発者
- 認可
- DogStatsD
- カスタムチェック
- インテグレーション
- Create an Agent-based Integration
- Create an API Integration
- Create a Log Pipeline
- Integration Assets Reference
- Build a Marketplace Offering
- Create a Tile
- Create an Integration Dashboard
- Create a Recommended Monitor
- Create a Cloud SIEM Detection Rule
- OAuth for Integrations
- Install Agent Integration Developer Tool
- サービスのチェック
- IDE インテグレーション
- コミュニティ
- ガイド
- API
- モバイルアプリケーション
- CoScreen
- Cloudcraft
- アプリ内
- Service Management
- インフラストラクチャー
- アプリケーションパフォーマンス
- APM
- Continuous Profiler
- データベース モニタリング
- Data Streams Monitoring
- Data Jobs Monitoring
- Digital Experience
- Software Delivery
- CI Visibility (CI/CDの可視化)
- CD Visibility
- Test Visibility
- Intelligent Test Runner
- Code Analysis
- Quality Gates
- DORA Metrics
- セキュリティ
- セキュリティの概要
- Cloud SIEM
- クラウド セキュリティ マネジメント
- Application Security Management
- AI Observability
- ログ管理
- Observability Pipelines(観測データの制御)
- ログ管理
- 管理
CI パイプラインの検索と管理
CI Visibility is not available in the selected site () at this time.
Overview
The Pipelines page is useful for developers who want to keep an eye on the build pipeline for their service.
This page answers the following questions:
- Is the pipeline for your service performant and reliable, especially on the default branch?
- If not, what’s the root cause?
You can access high-level accumulation and trends, including:
- An overview of the health of the whole build system, with aggregated stats for pipeline runs and branches.
- A window to quickly spotting and fixing immediate, urgent issues like broken pipelines to production.
- How each pipeline has run, over time, and with what results and trends.
- The breakdown of where time is spent in each build stage, over time, so you can focus your improvement efforts where it makes the biggest difference.
Search for pipelines
To see your pipelines, navigate to Software Delivery > CI Visibility > CI Pipeline List.
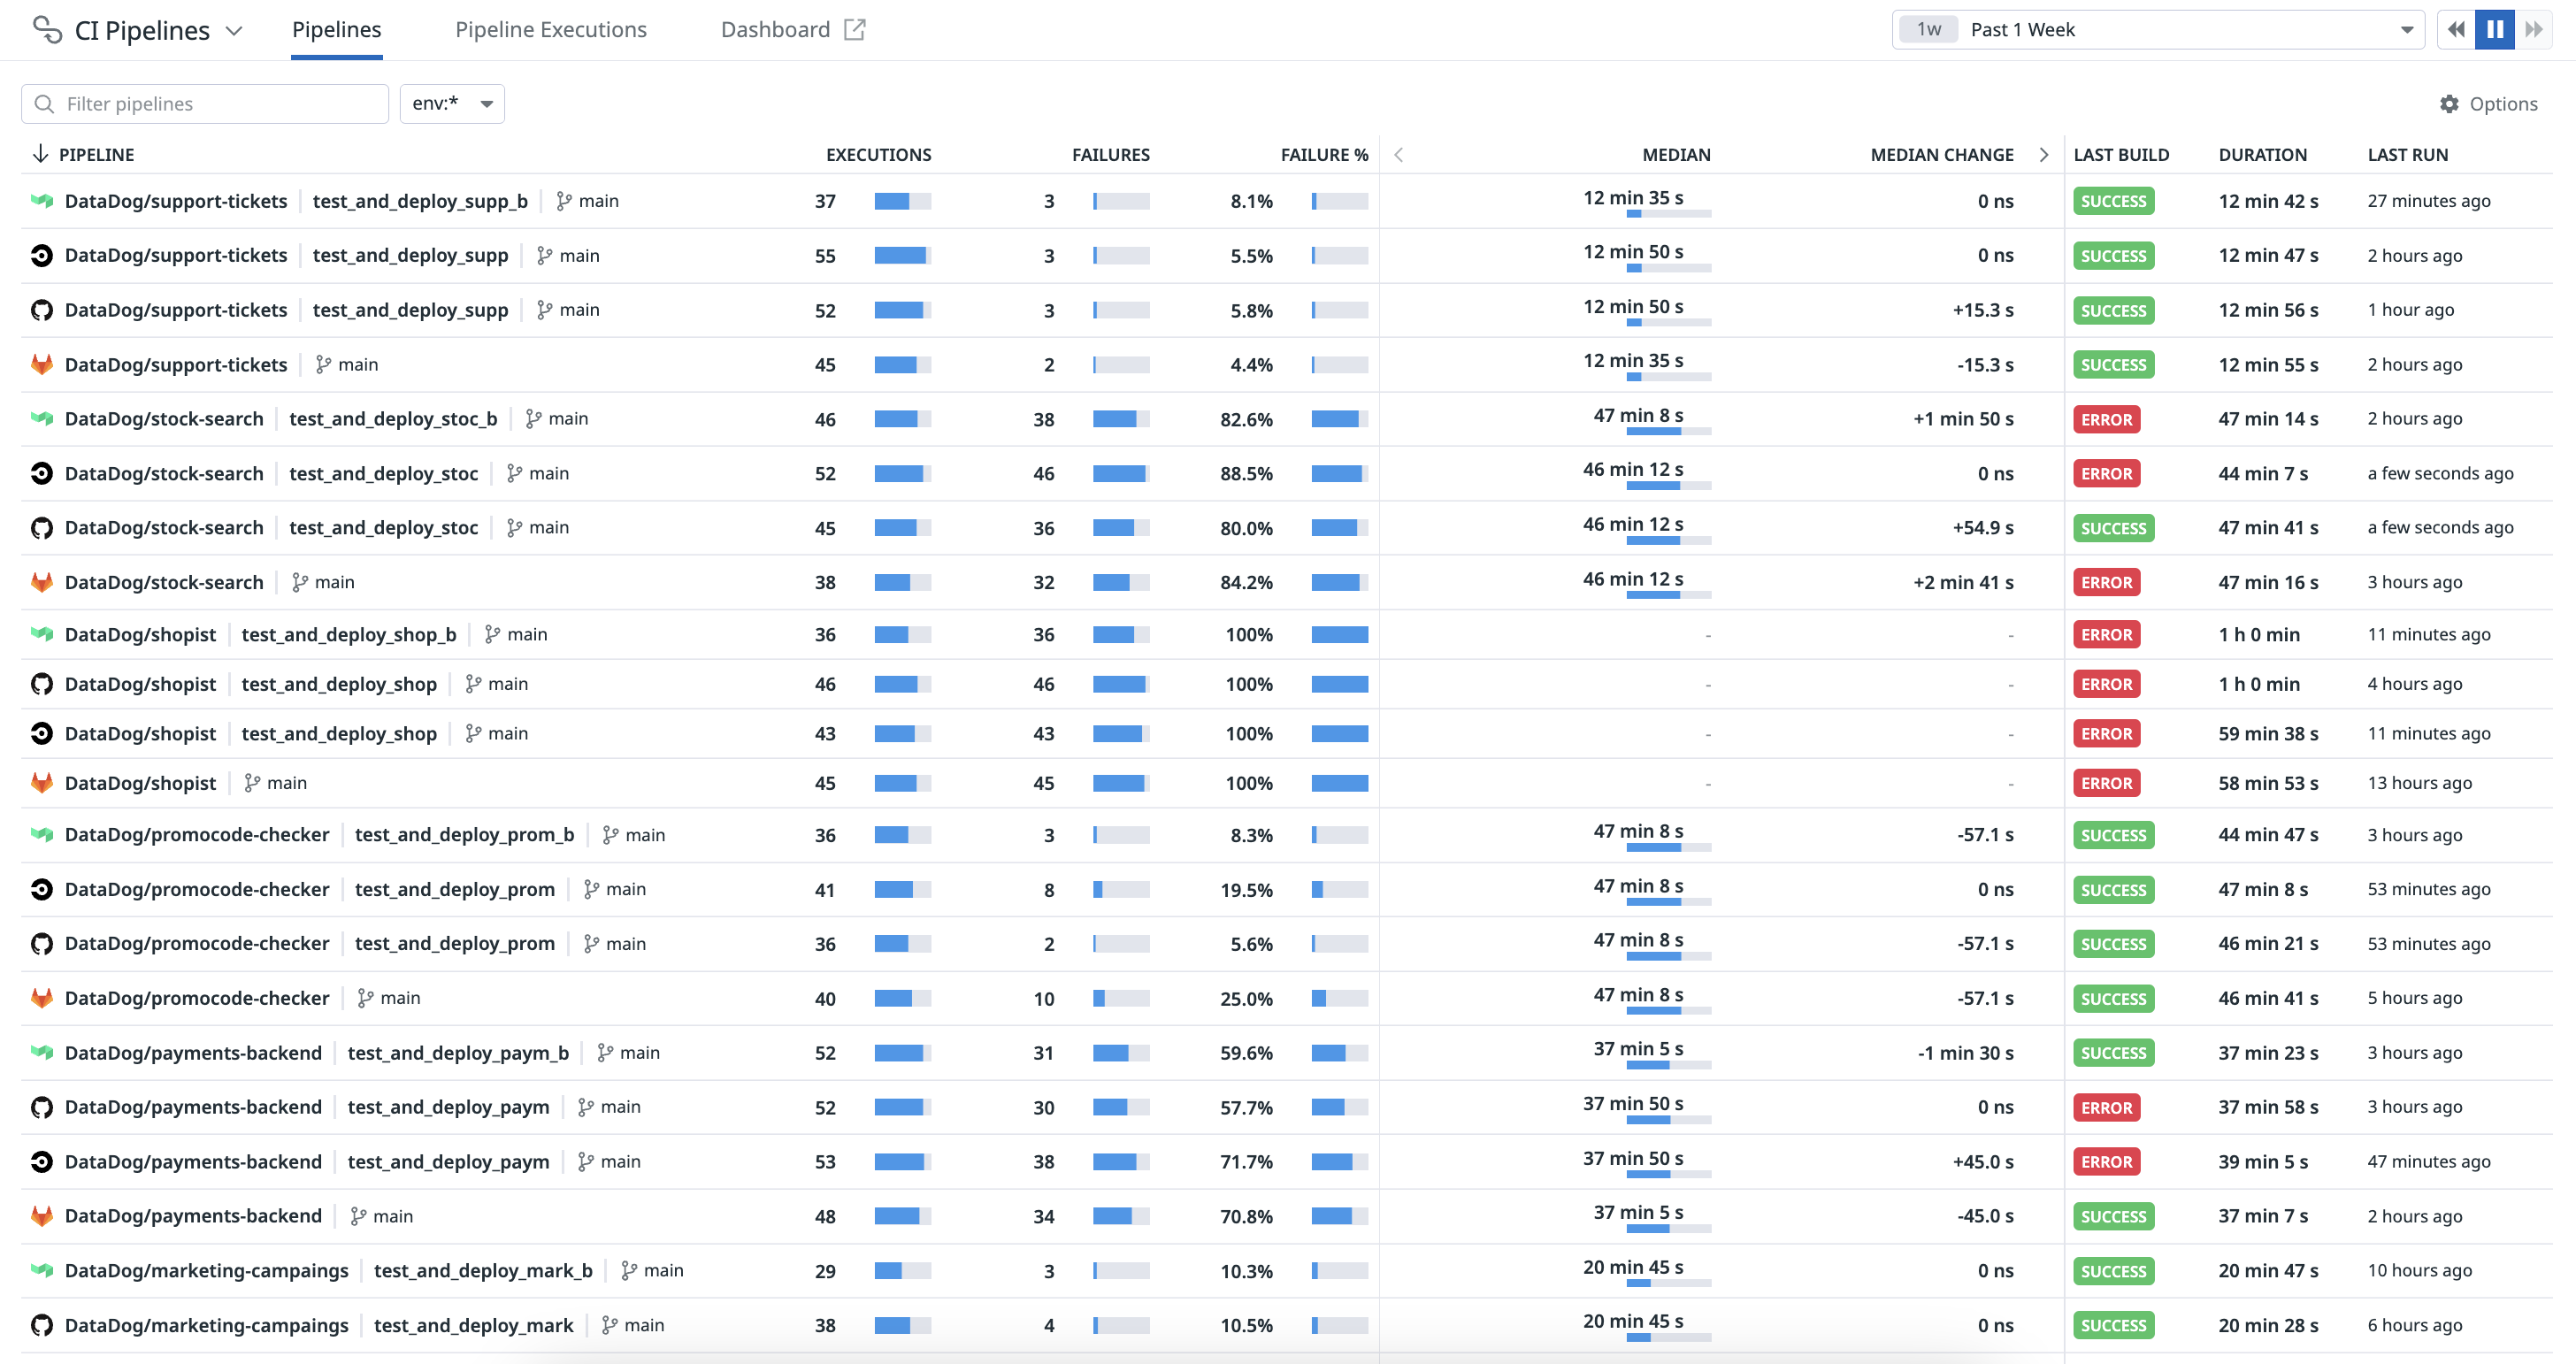
The Pipelines page shows aggregate stats for the default branch of each pipeline over the selected time frame, as well as the status of the latest pipeline execution. Use this page to see all your pipelines and get a quick view of their health. Only pipelines with Git information associated to the default branch (usually named main or prod), as well as pipelines without any Git information, are displayed on this page.
The metrics shown include build frequency, failure rate, median duration, and change in median duration on both an absolute and relative basis. This information reveals which pipelines are high-usage and potentially high-resource consumers, or are experiencing regressions. The last build result, duration, and last runtime shows you the effect of the last commit.
You can filter the page by pipeline name to see the pipelines you’re most concerned with. Click on a pipeline that is slow or failing to dig into details that show what commit might have introduced the performance regression or build error. If you are using Datadog Teams, you can filter for specific pipelines associated to your team using custom tags that match team handles.
Pipeline details and executions
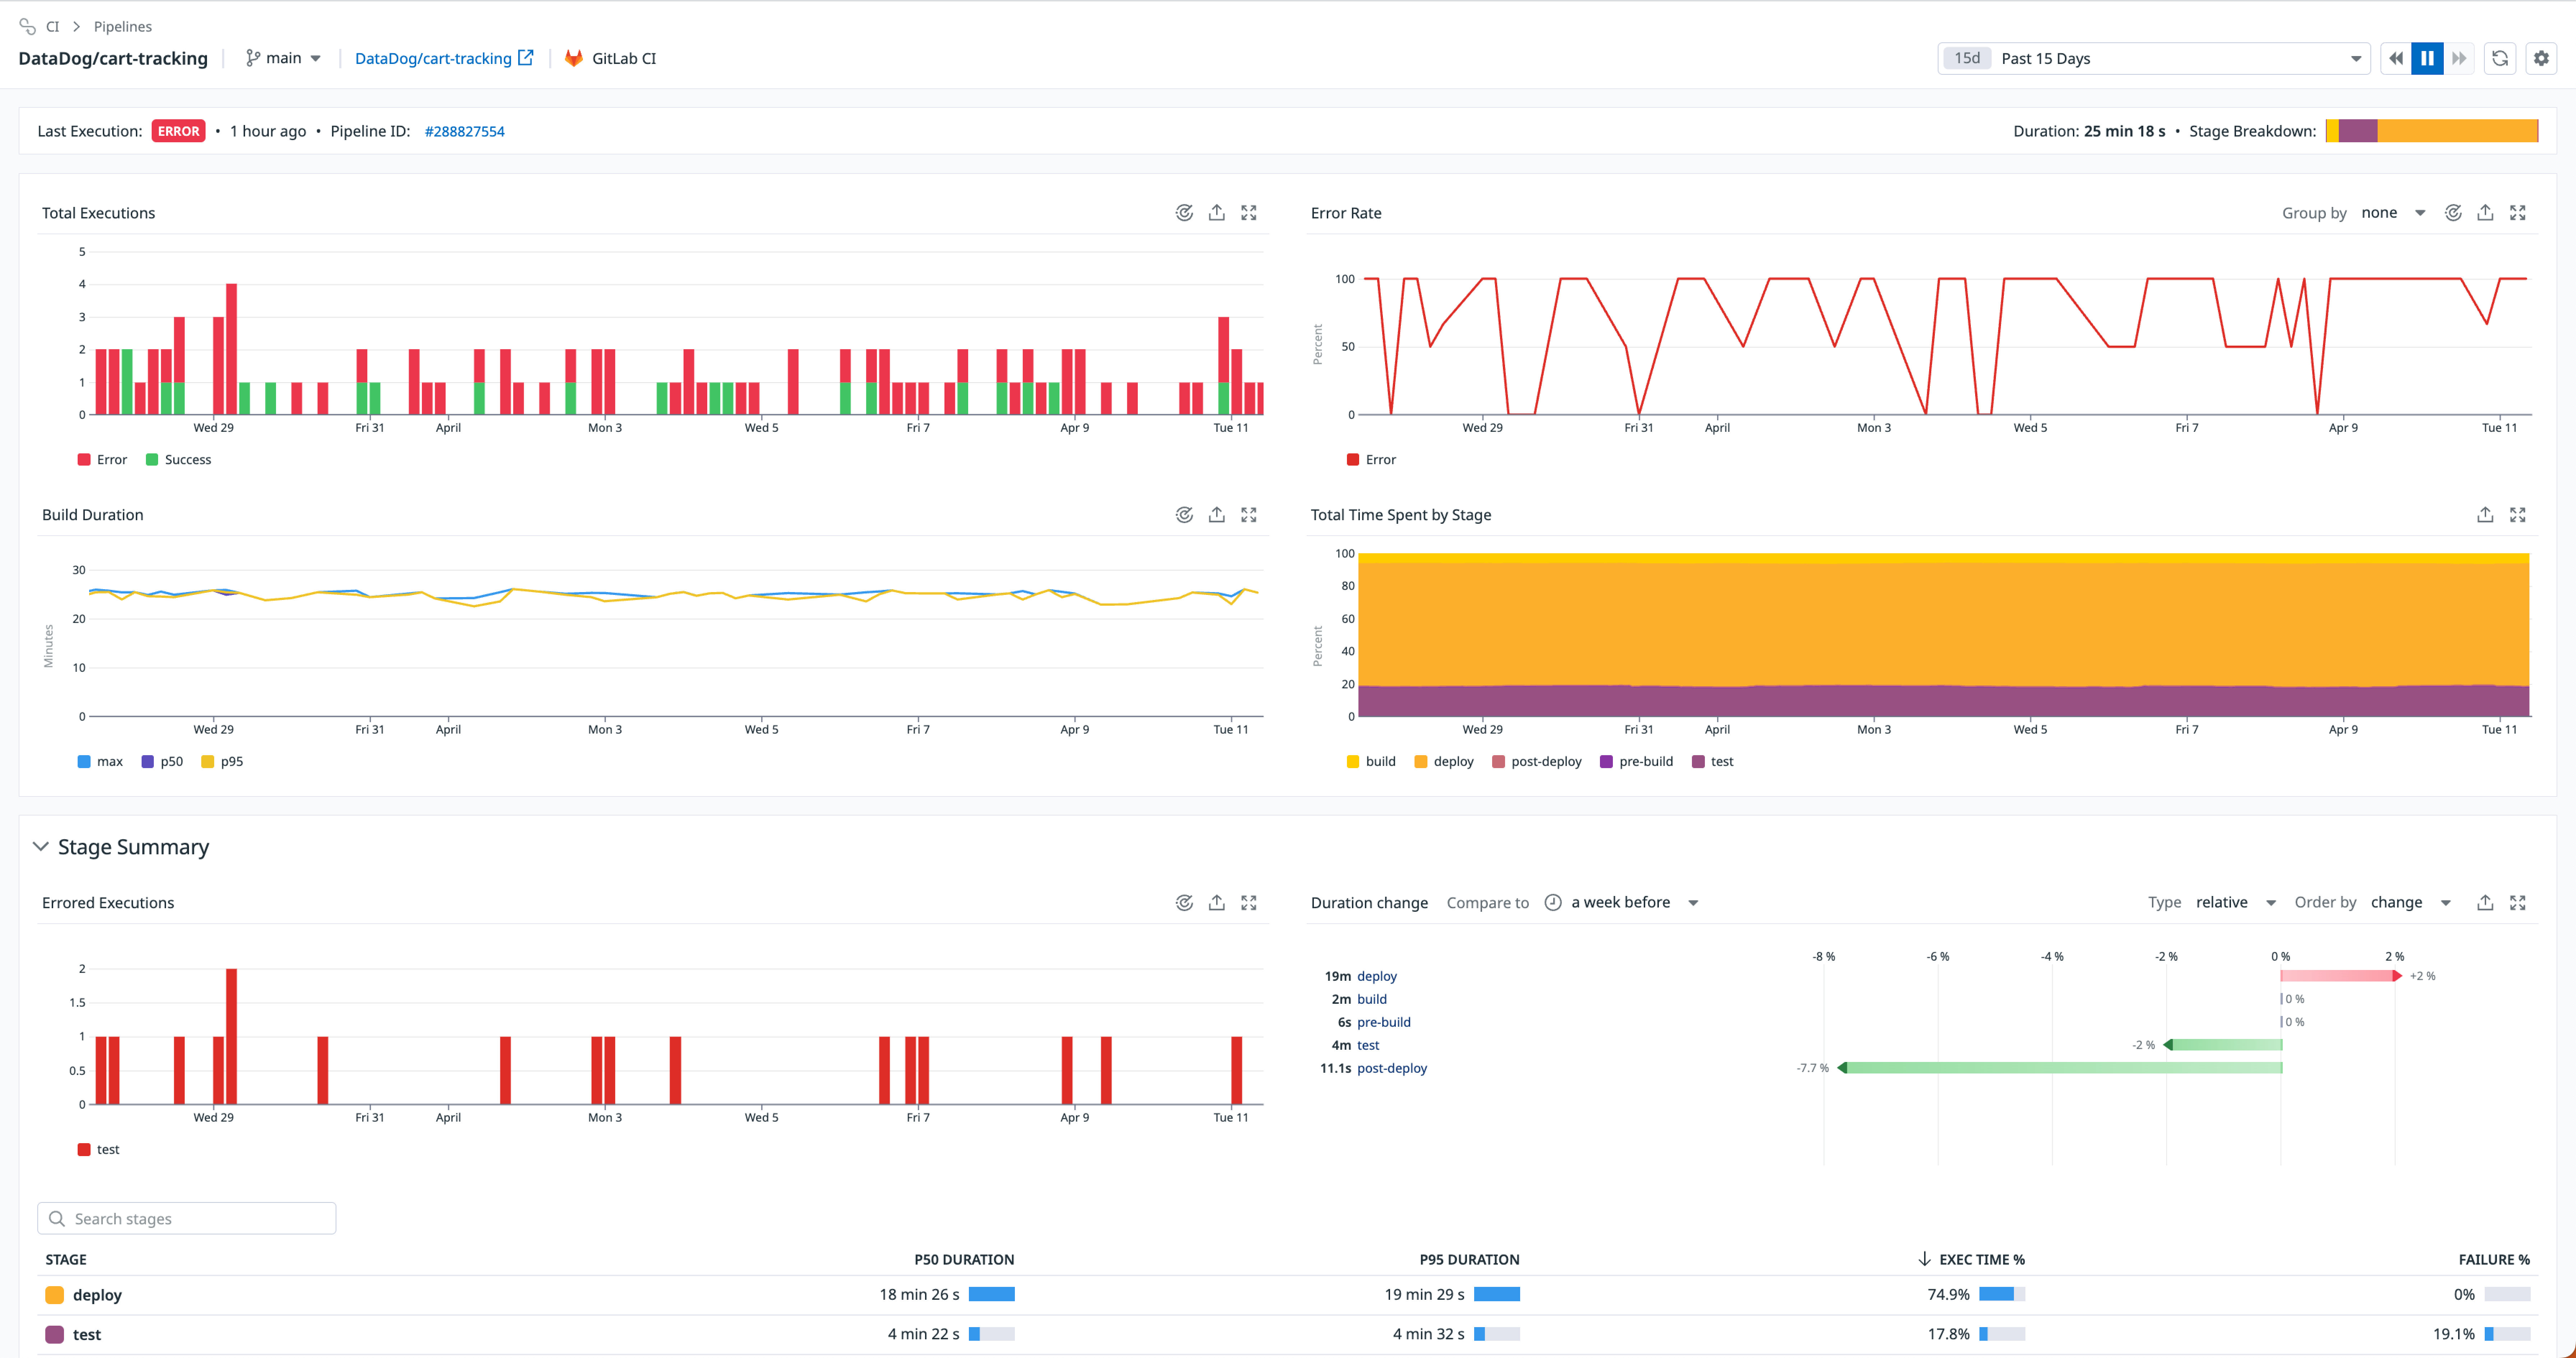
Click into a specific pipeline to see the Pipeline Details page which provides views of the data for the pipeline you selected over a specified time frame.
Get insights on the selected pipeline such as total and failed executions over time, build duration percentiles, error rates, and total time spent breakdown by stage. There are also summary tables for stages and jobs so you can quickly sort them in terms of duration, percentage of overall execution time, or failure rate.
The pipeline execution list shows all the times that pipeline (or its stages or jobs) ran during the selected time frame, for the selected branch. Use the facets on the left side to filter the list to exactly the pipelines, stages, or jobs you want to see.
View unified pipeline trace
To see the unified pipeline trace, click on the View unified trace checkbox on the pipeline execution page.
The unified trace shows in a single trace all pipeline traces generated due to the different partial retries of your pipeline. If the pipeline execution has no partial retries, the unified trace shows only the trace of a single pipeline execution.
Highlight critical path
To highlight the critical path on the trace, click on the Critical path checkbox on the pipeline execution page.
The critical path highlights the spans that you need to speed up if you want to reduce the overall execution time of your pipeline. If a CI job is on the critical path, it means it is part of the longest path through the trace in terms of execution time. Speeding up the CI Jobs on the critical path is strictly necessary to speed up the CI pipeline.
Explore connections to services, resources, and network events
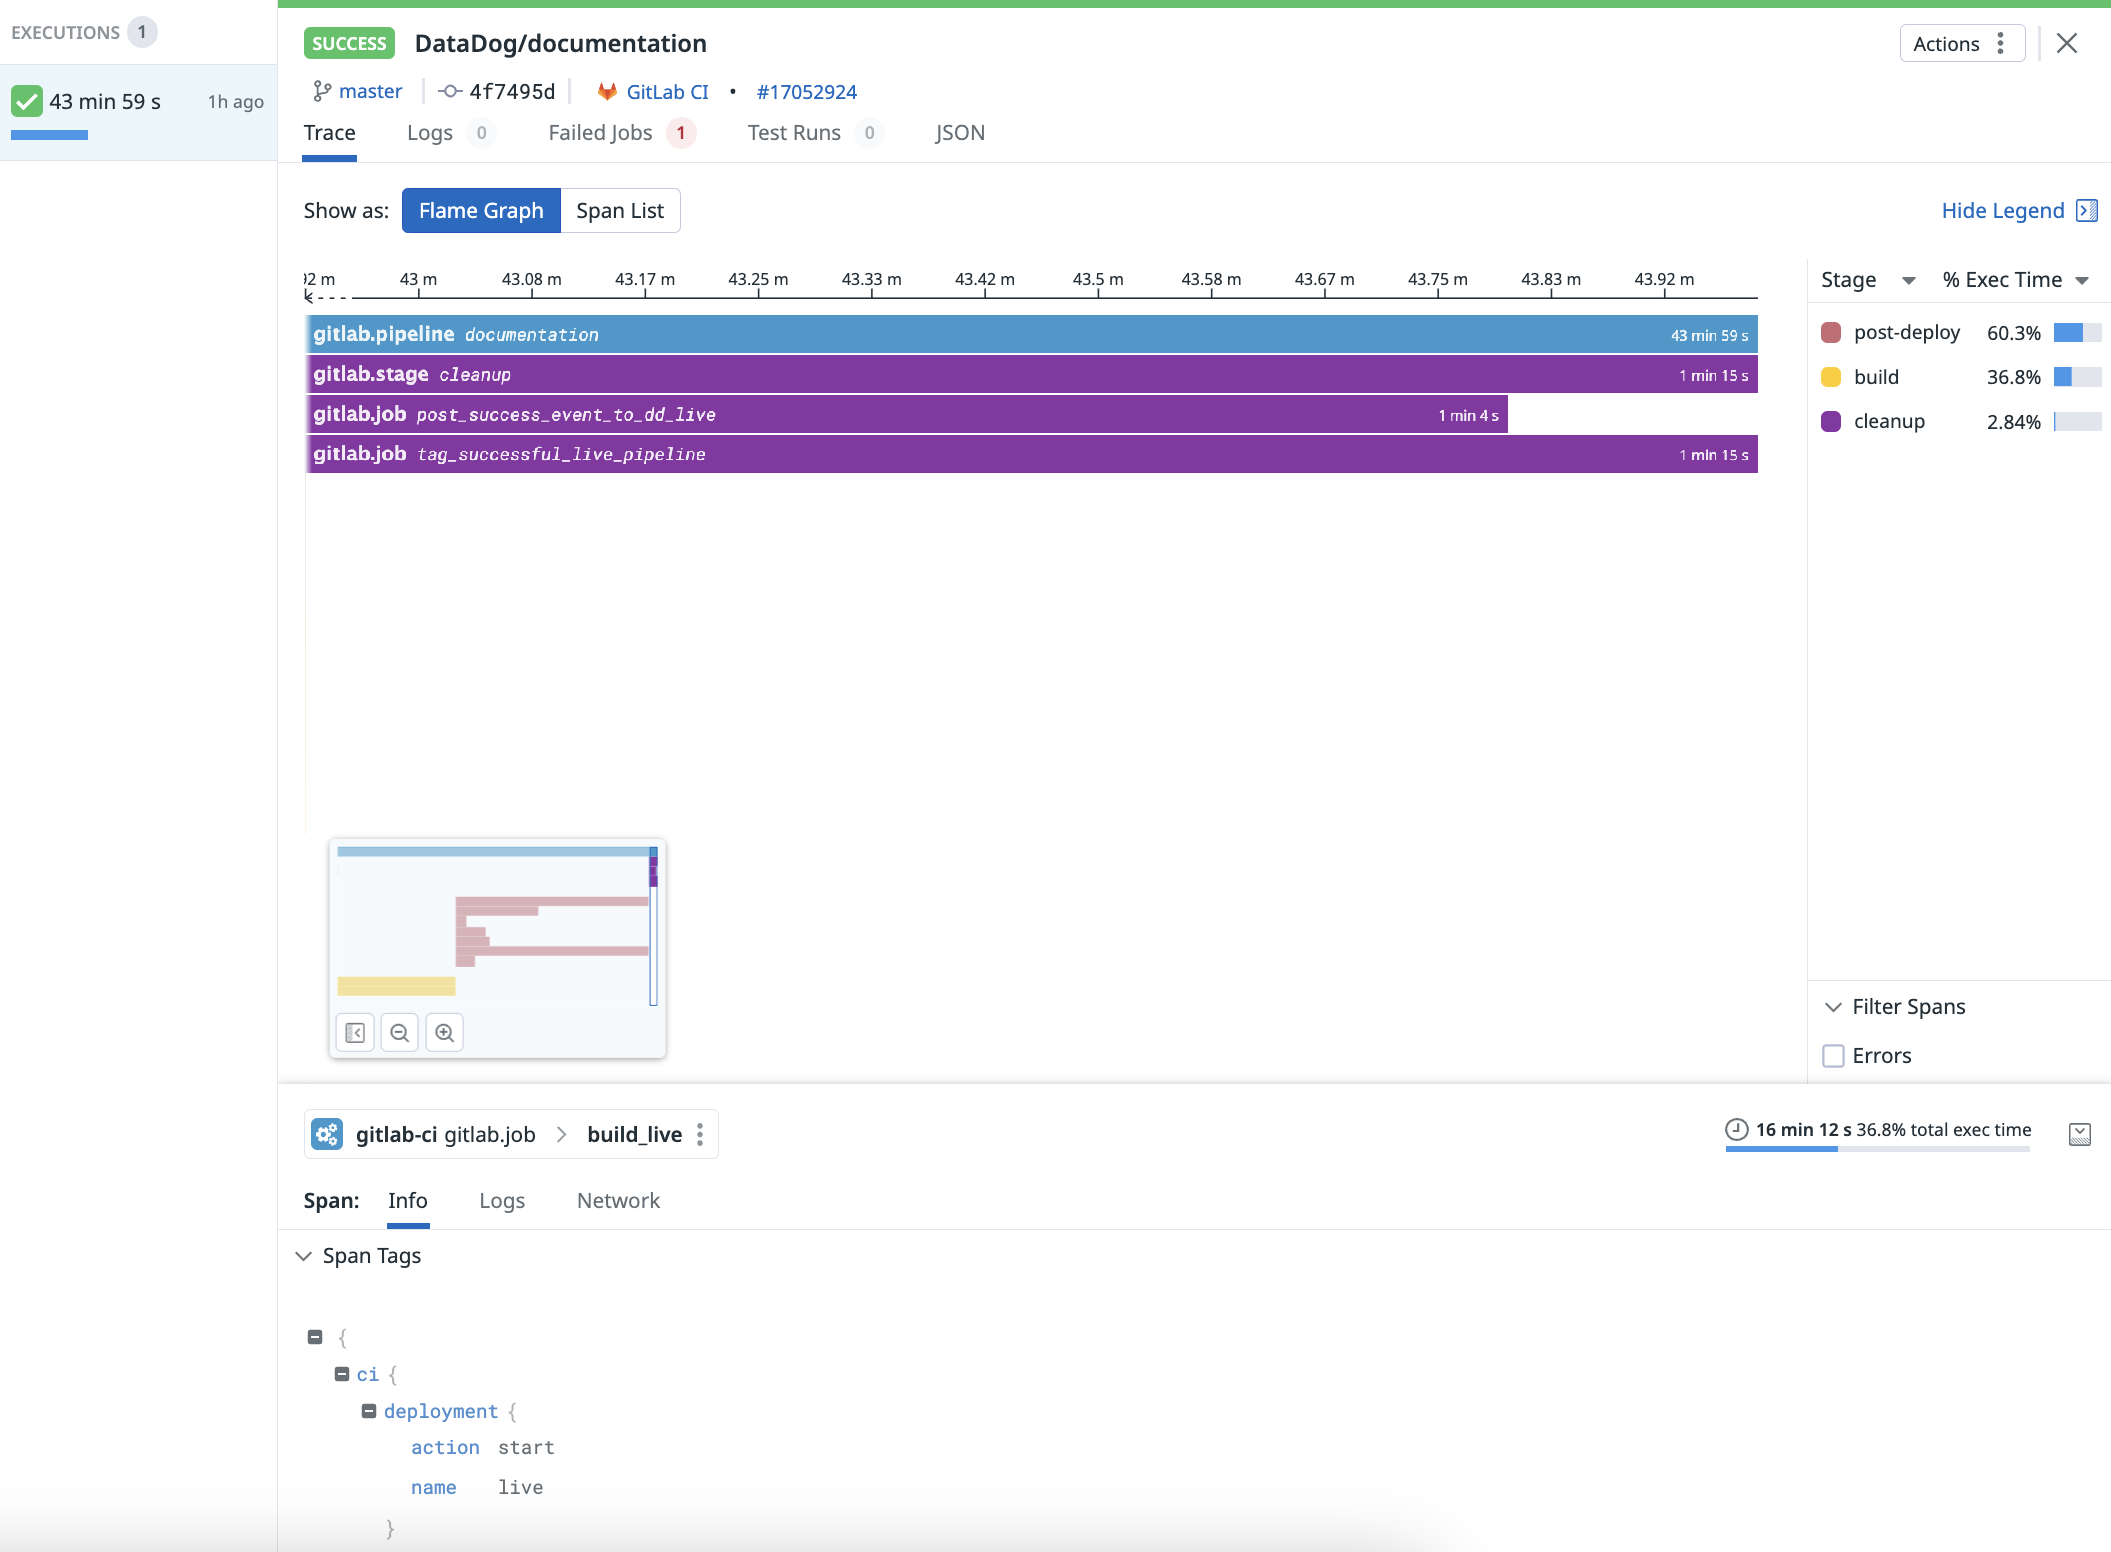
Click one of the executions to open the pipeline execution view and see the flame graph or span list for the pipeline and its stages. The Executions (n) list on the left side gives you quick access to the data for each retry of the pipeline for the same commit.
Click the CI provider link (gitlab-ci gitlab.pipeline > documentation in the following image) to investigate the Resource, Service, or Analytics page for the pipeline, stage, or job specifically. You can also find complete tags information and links to network monitoring events.
Explore connections to logs
If job log collection is supported and enabled for the CI provider, related log events can be found in the Logs tab of the pipeline execution view.
Job log collection is supported for the following providers:
AI-generated log summaries
AI-generated log summaries are in private beta. To request access, fill out this form.
Pipeline Visibility は、CI ジョブログに基づいて、AI が生成するパイプラインエラーの説明を提供します。これらの説明は、各パイプラインの実行に対して Failed Jobs タブで確認できます。これらの要約を利用して、CI のエラーが開発者によって書かれたコードに関連しているのか、それとも CI パイプライン自体に関連しているのかを判断し、さらに実行失敗のトラブルシューティングも行うことができます。
その他の参考資料
お役に立つドキュメント、リンクや記事:


