- Essentials
- Getting Started
- Datadog
- Datadog Site
- DevSecOps
- Serverless for AWS Lambda
- Agent
- Integrations
- Containers
- Dashboards
- Monitors
- Logs
- APM Tracing
- Profiler
- Tags
- API
- Service Catalog
- Session Replay
- Continuous Testing
- Synthetic Monitoring
- Incident Management
- Database Monitoring
- Cloud Security Management
- Cloud SIEM
- Application Security Management
- Workflow Automation
- CI Visibility
- Test Visibility
- Test Impact Analysis
- Code Analysis
- Learning Center
- Support
- Glossary
- Standard Attributes
- Guides
- Agent
- Integrations
- OpenTelemetry
- Developers
- Authorization
- DogStatsD
- Custom Checks
- Integrations
- Create an Agent-based Integration
- Create an API Integration
- Create a Log Pipeline
- Integration Assets Reference
- Build a Marketplace Offering
- Create a Tile
- Create an Integration Dashboard
- Create a Recommended Monitor
- Create a Cloud SIEM Detection Rule
- OAuth for Integrations
- Install Agent Integration Developer Tool
- Service Checks
- IDE Plugins
- Community
- Guides
- API
- Datadog Mobile App
- CoScreen
- Cloudcraft
- In The App
- Dashboards
- Notebooks
- DDSQL Editor
- Sheets
- Monitors and Alerting
- Infrastructure
- Metrics
- Watchdog
- Bits AI
- Service Catalog
- API Catalog
- Error Tracking
- Service Management
- Infrastructure
- Application Performance
- APM
- Continuous Profiler
- Database Monitoring
- Data Streams Monitoring
- Data Jobs Monitoring
- Digital Experience
- Real User Monitoring
- Product Analytics
- Synthetic Testing and Monitoring
- Continuous Testing
- Software Delivery
- CI Visibility
- CD Visibility
- Test Optimization
- Code Analysis
- Quality Gates
- DORA Metrics
- Security
- Security Overview
- Cloud SIEM
- Cloud Security Management
- Application Security Management
- AI Observability
- Log Management
- Observability Pipelines
- Log Management
- Administration
Grouping Logs Into Patterns
Overview
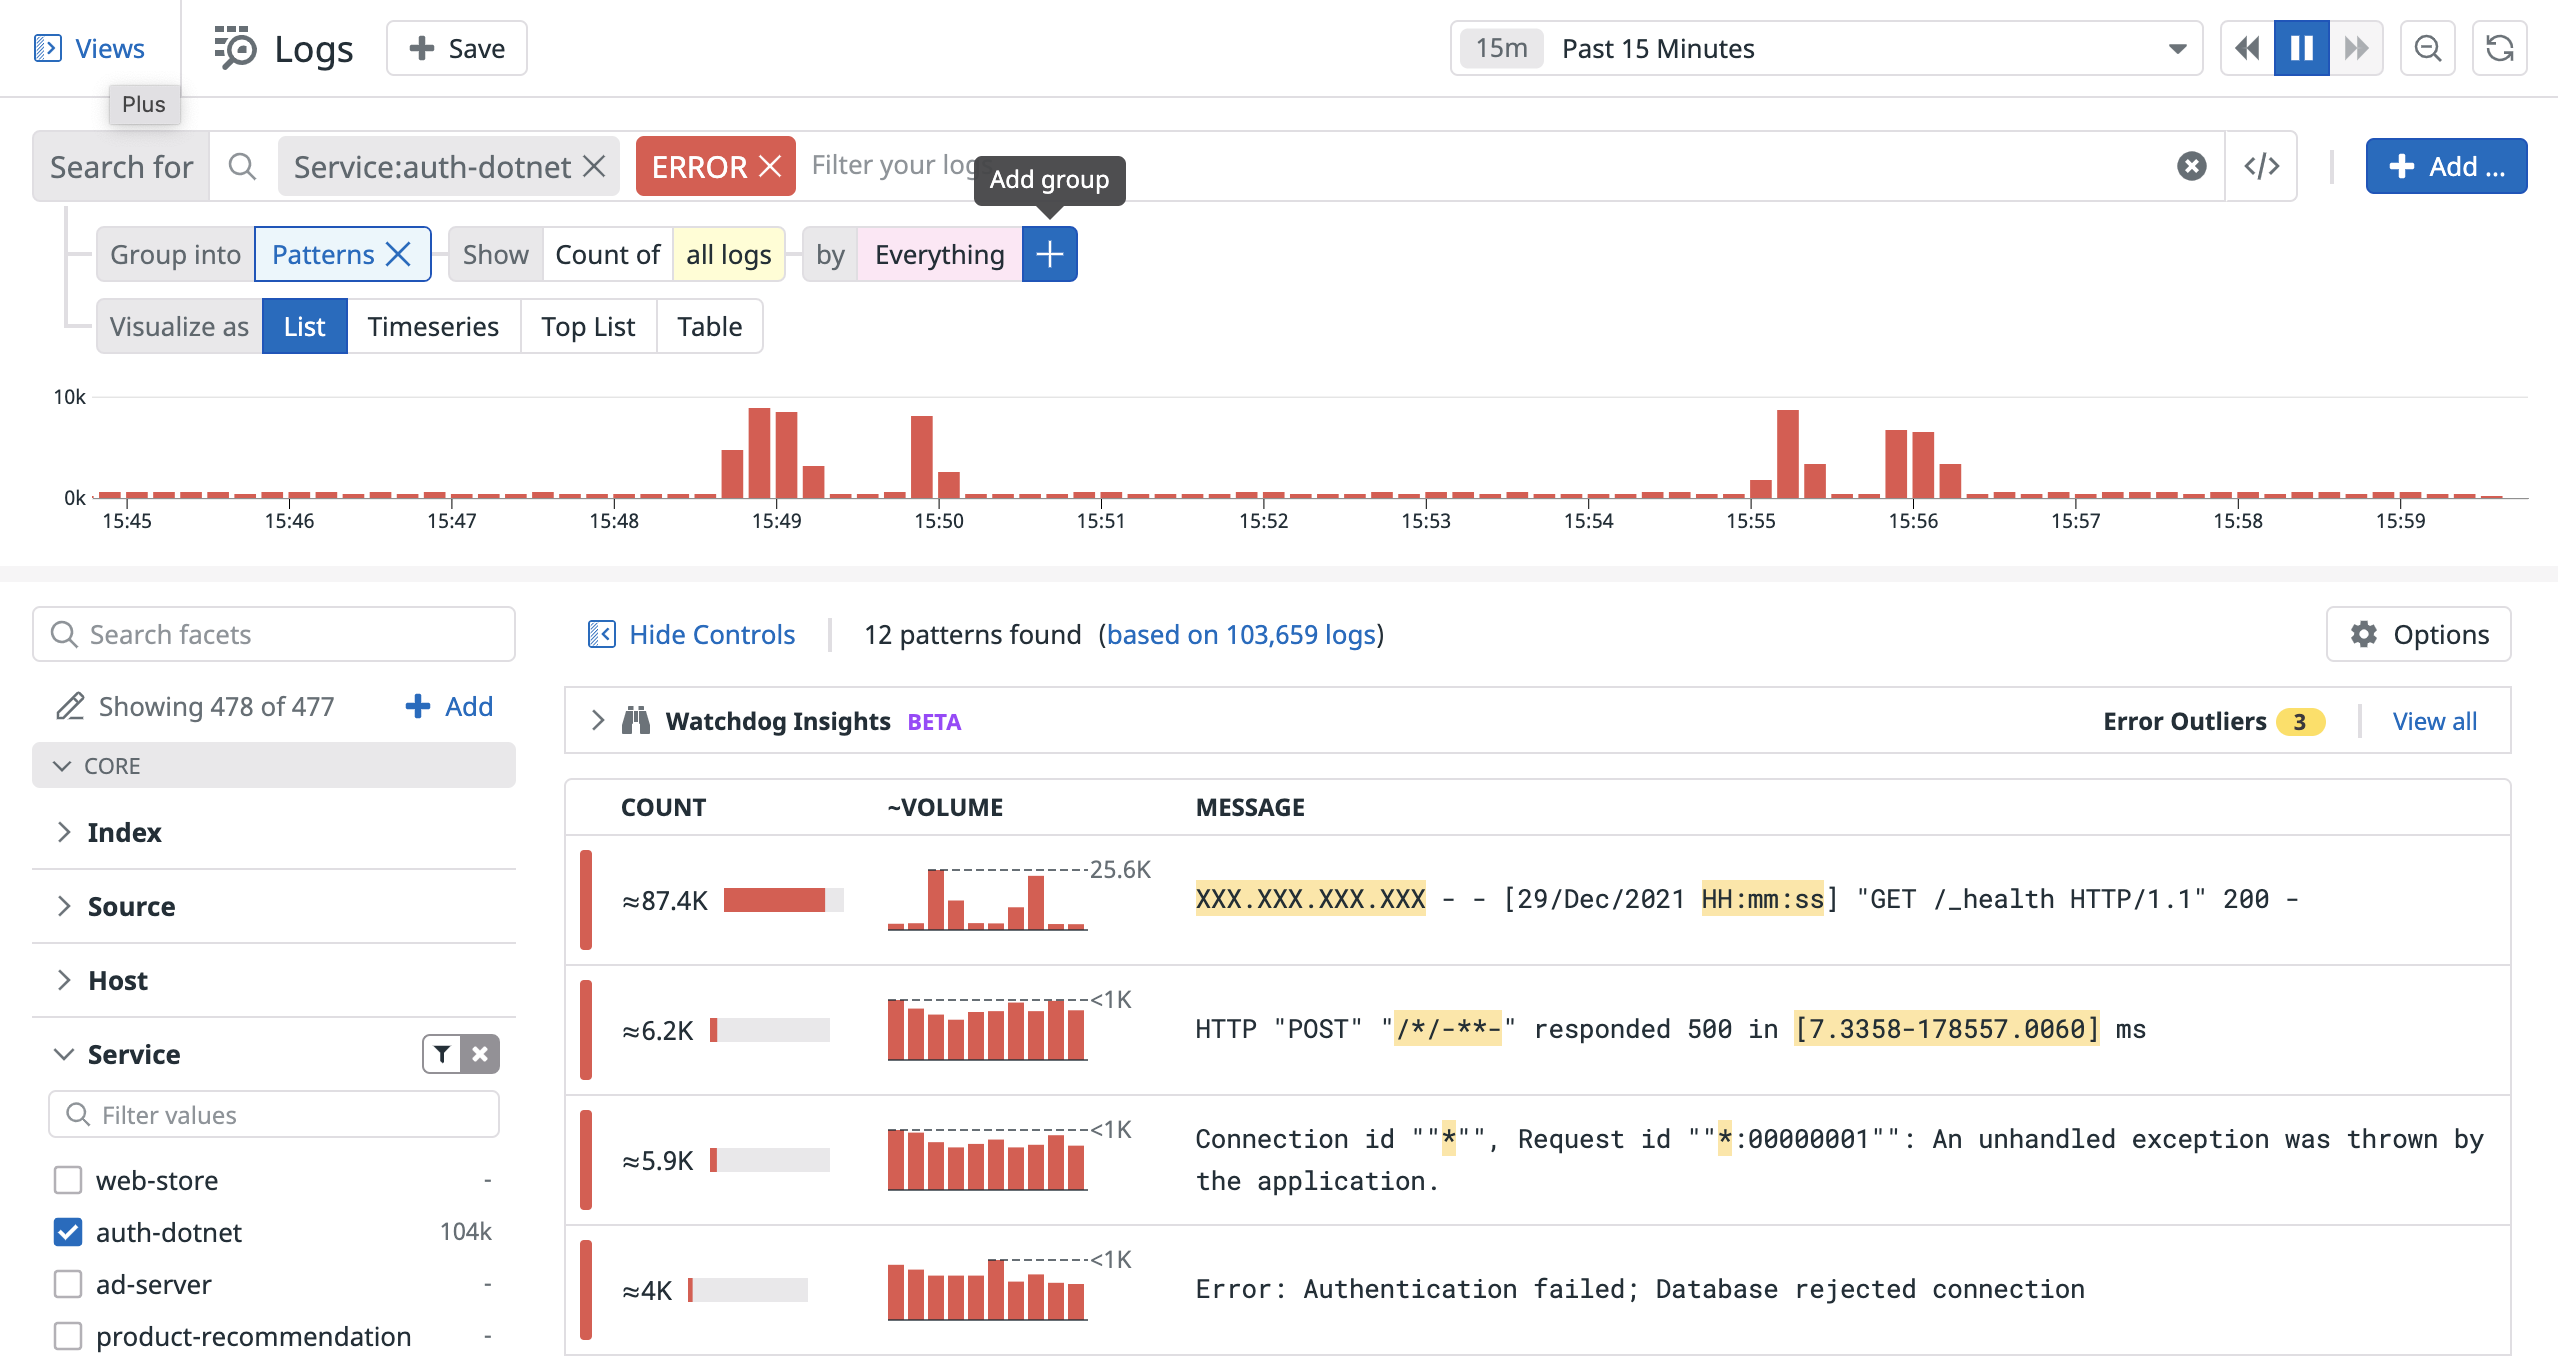
When aggregating indexed logs by Patterns, logs that have a message with similar structures are grouped altogether. Optionally, select one to three faceted fields to pre-aggregate your logs into groups before patterns are detected within these groupings.
The Patterns view is helpful for detecting and filtering noisy error patterns that could cause you to miss other issues. The pattern detection is based on 10,000 log samples. Refine your search to see patterns limited to a specific subset of logs.
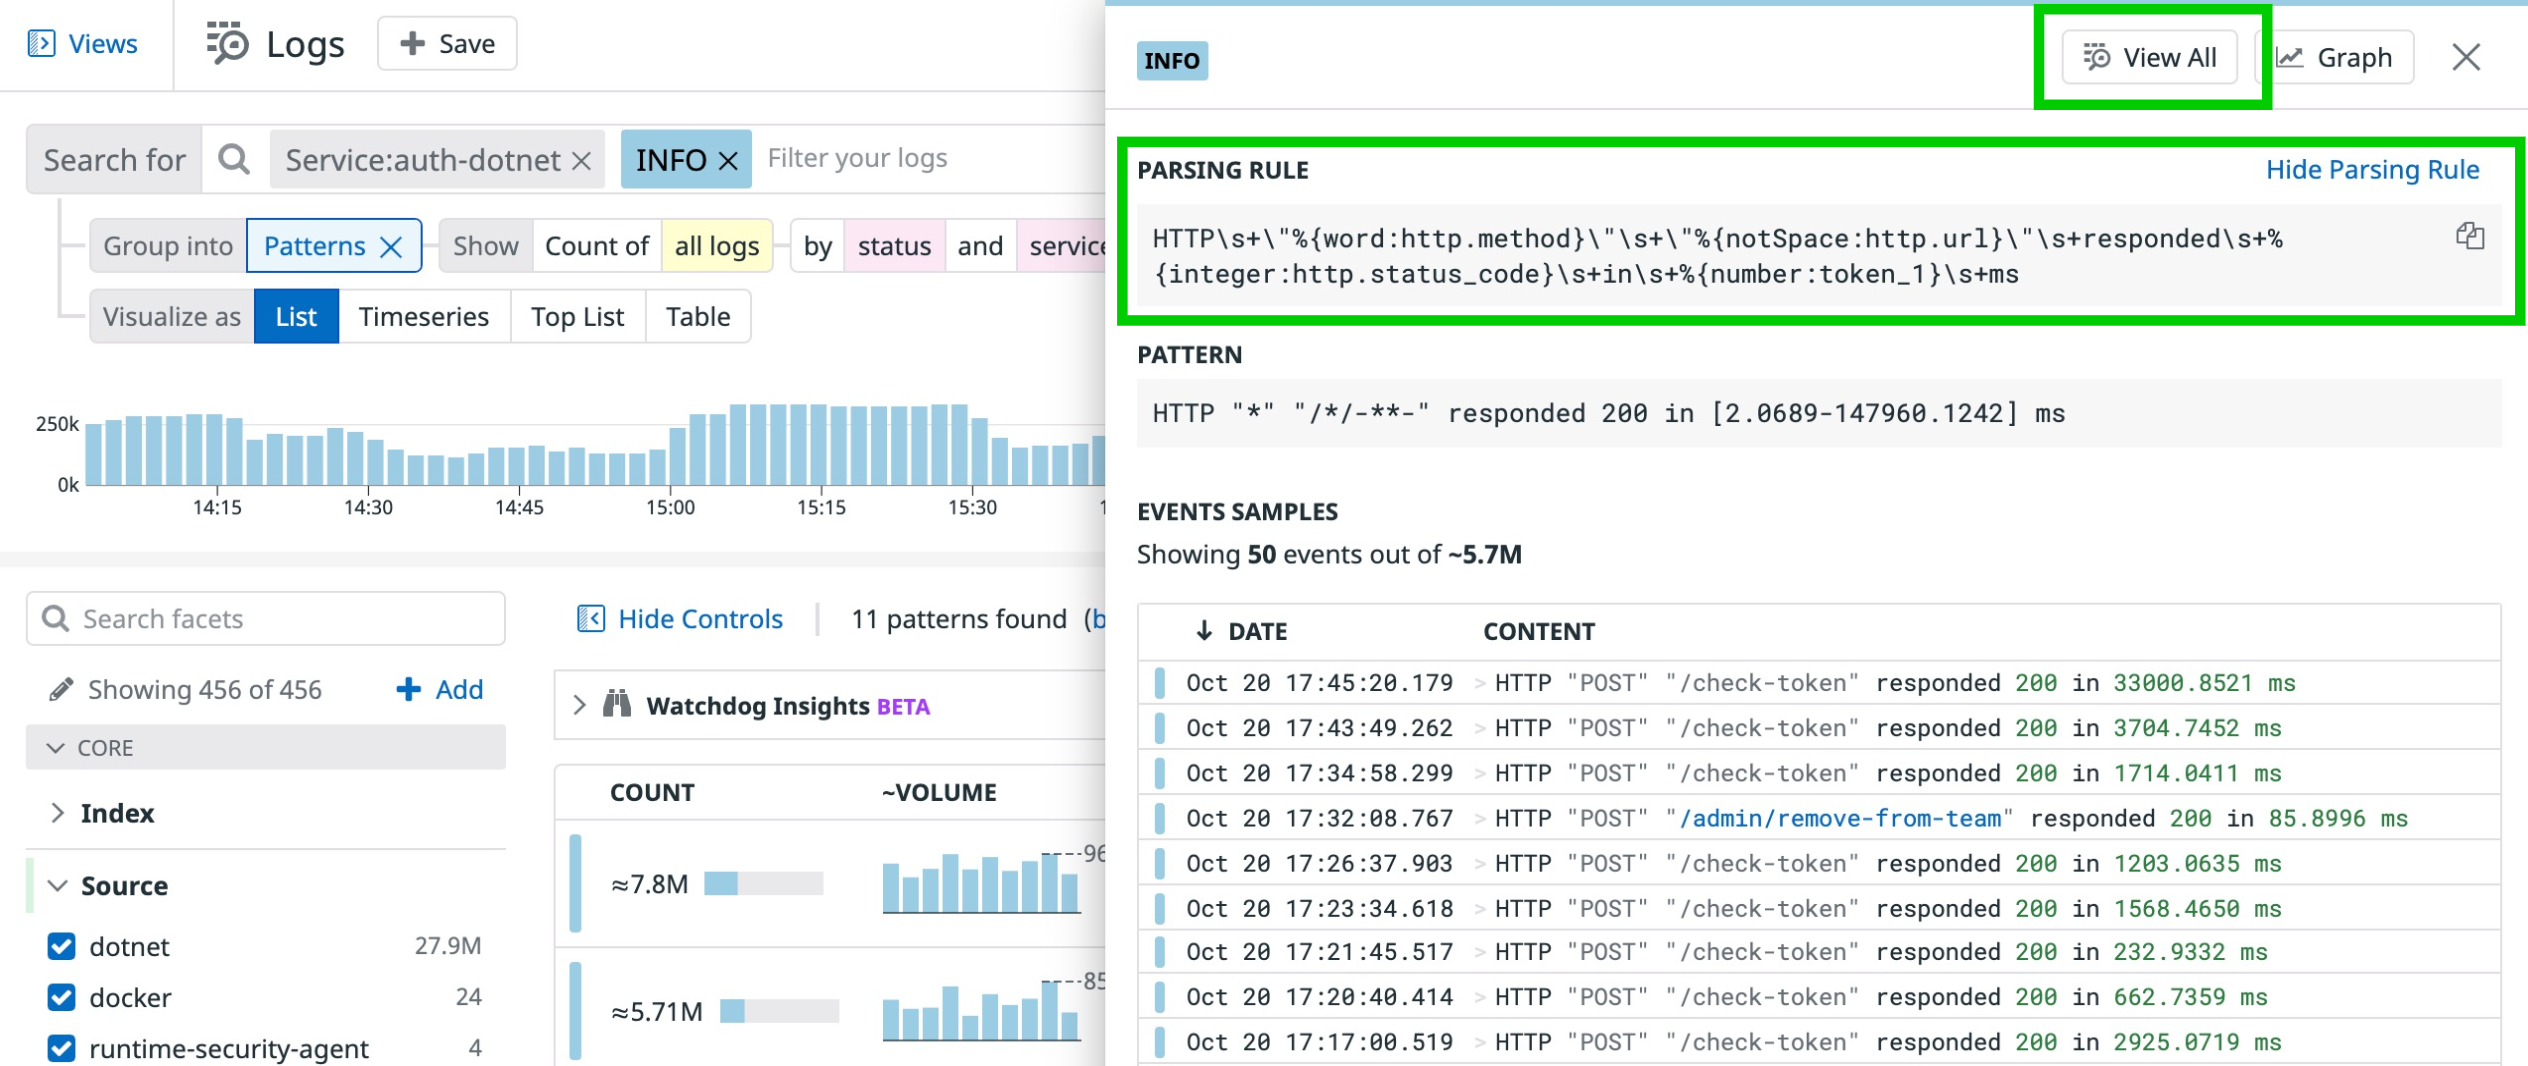
Patterns support the List visualization. Clicking a pattern in the list opens the pattern side panel from which you can:
- Access a sample of logs from that pattern
- Append the search filter to scope it down to logs from this pattern only
- Get a kickstart for a grok parsing rule to extract structured information logs of that pattern
Pattern Inspector
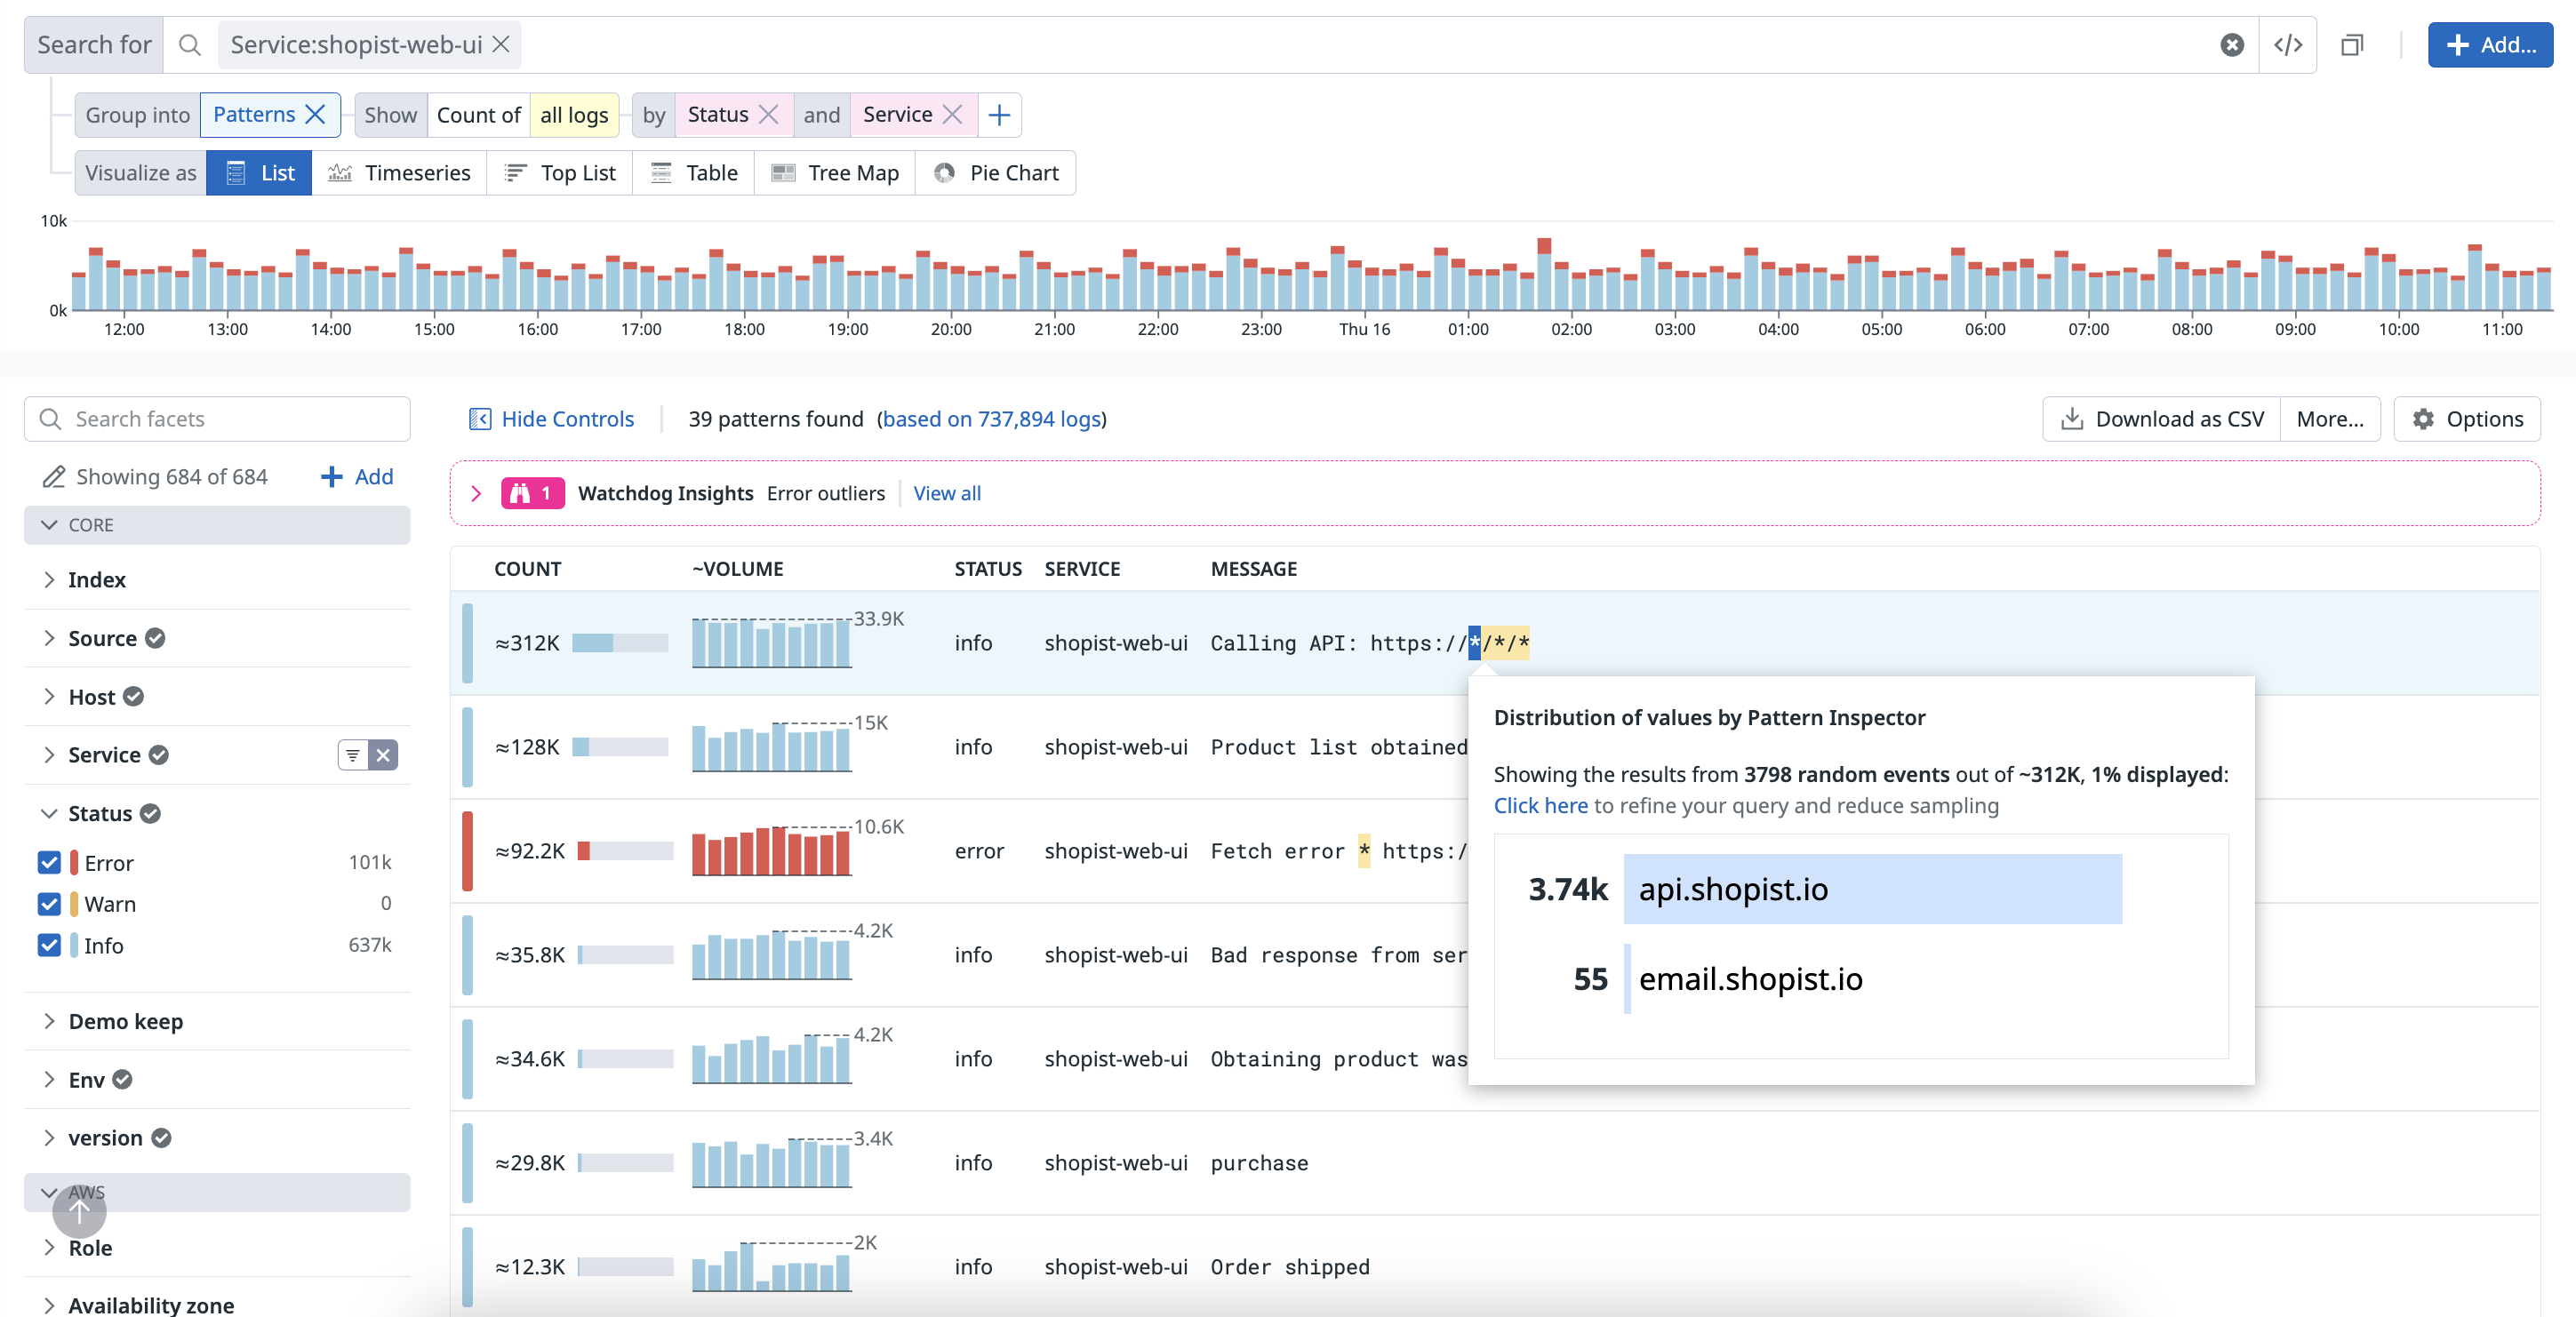
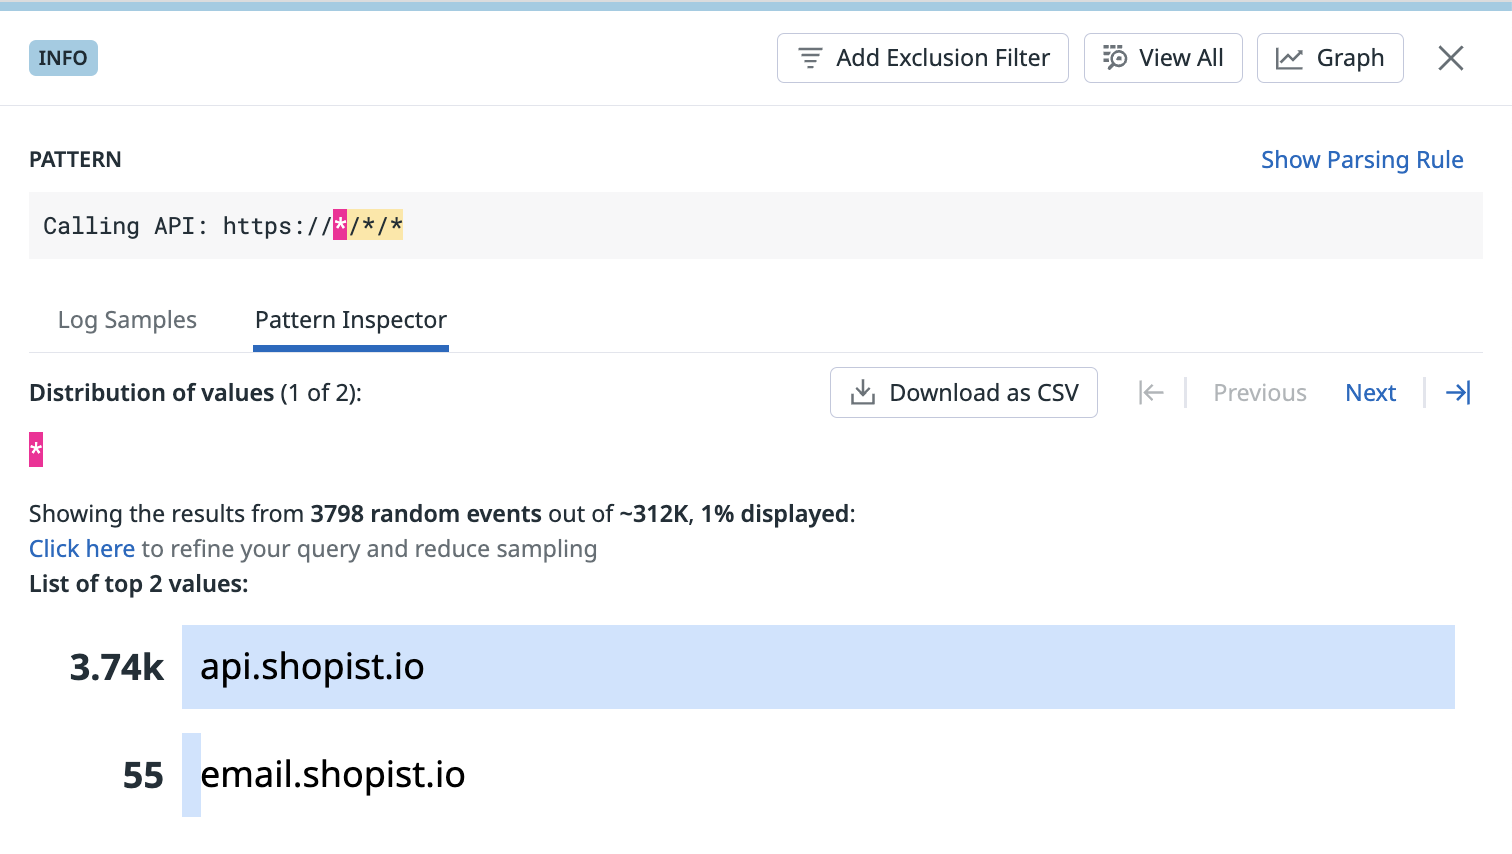
Use the Pattern Inspector to get a visual breakdown of the underlying values of a log pattern’s aggregation based on your search query.
For example, if you are investigating an issue, you could see how many hosts are involved or what regions or data centers are impacted.
- Navigate to the Log Explorer.
- Click Patterns in the Group into section. In the list of patterns, the aggregate values in the message section are highlighted in yellow. Hover over an aggregate value to get a preview of the visual distribution of its values.
- Click on an aggregate value to open the log pattern’s side panel and see more details in the Pattern Inspector tab.
Further reading
Additional helpful documentation, links, and articles:


