- Essentials
- Getting Started
- Datadog
- Datadog Site
- DevSecOps
- Serverless for AWS Lambda
- Agent
- Integrations
- Containers
- Dashboards
- Monitors
- Logs
- APM Tracing
- Profiler
- Tags
- API
- Service Catalog
- Session Replay
- Continuous Testing
- Synthetic Monitoring
- Incident Management
- Database Monitoring
- Cloud Security Management
- Cloud SIEM
- Application Security Management
- Workflow Automation
- CI Visibility
- Test Visibility
- Test Impact Analysis
- Code Analysis
- Learning Center
- Support
- Glossary
- Standard Attributes
- Guides
- Agent
- Integrations
- OpenTelemetry
- Developers
- Authorization
- DogStatsD
- Custom Checks
- Integrations
- Create an Agent-based Integration
- Create an API Integration
- Create a Log Pipeline
- Integration Assets Reference
- Build a Marketplace Offering
- Create a Tile
- Create an Integration Dashboard
- Create a Recommended Monitor
- Create a Cloud SIEM Detection Rule
- OAuth for Integrations
- Install Agent Integration Developer Tool
- Service Checks
- IDE Plugins
- Community
- Guides
- API
- Datadog Mobile App
- CoScreen
- Cloudcraft
- In The App
- Dashboards
- Notebooks
- DDSQL Editor
- Sheets
- Monitors and Alerting
- Infrastructure
- Metrics
- Watchdog
- Bits AI
- Service Catalog
- API Catalog
- Error Tracking
- Service Management
- Infrastructure
- Application Performance
- APM
- Continuous Profiler
- Database Monitoring
- Data Streams Monitoring
- Data Jobs Monitoring
- Digital Experience
- Real User Monitoring
- Product Analytics
- Synthetic Testing and Monitoring
- Continuous Testing
- Software Delivery
- CI Visibility
- CD Visibility
- Test Optimization
- Code Analysis
- Quality Gates
- DORA Metrics
- Security
- Security Overview
- Cloud SIEM
- Cloud Security Management
- Application Security Management
- AI Observability
- Log Management
- Observability Pipelines
- Log Management
- Administration
Log Facets
Overview
Facets are user-defined tags and attributes from your indexed logs. They are meant for either qualitative or quantitative data analysis. As such, you can use them in your Log Explorer to:
Facets also allow you to manipulate your logs in your log monitors, log widgets in dashboards, and notebooks.
Note: You do not need facets to support log processing, livetail search, log explorer search, metric generation from logs, archive forwarding, or rehydration. You also do not need facets for routing logs through to Pipelines and Indexes with filters, or excluding or sampling logs from indexes with exclusion filters.
In all these contexts, autocomplete capabilities rely on existing facets, but any input matching incoming logs would work.
Qualitative facets
Dimensions
Use qualitative facets when you need:
- To get relative insights for values. For instance, create a facet on
http.network.client.geoip.country.iso_codeto see the top countries most impacted per number of 5XX errors on your NGINX web access logs, enriched with the Datadog GeoIP Processor. - To count unique values. For instance, create a facet on
user.emailfrom your Kong logs to know how many users connect every day to your website. - To frequently filter your logs against particular values. For instance, create a facet on an
environmenttag to scope troubleshooting down to development, staging, or production environments.
Note: Although it is not required to create facets to filter on attribute values, defining them on attributes that you often use during investigations can help reduce your time to resolution.
Types
Qualitative facets can have a string or numerical (integer) type. While assigning string type to a dimension works in all case, using integer types on a dimension enables range filtering on top of all aforementioned capabilities. For instance, http.status_code:[200 TO 299] is a valid query to use on a integer-type dimension. See search syntax for reference.
Quantitative facets
Measures
Use measures when you need:
- To aggregate values from multiple logs. For instance, create a measure on the size of tiles served by the Varnish cache of a map server and keep track of the average daily throughput, or top-most referrers per sum of tile size requested.
- To range filter your logs. For instance, create a measure on the execution time of Ansible tasks, and see the list of servers having the most runs taking more than 10s.
- To sort logs against that value. For instance, create a measure on the amount of payments performed with your Python microservice. You can then search all the logs, starting with the one with the highest amount.
Types
Measures come with either a (long) integer or double value, for equivalent capabilities.
Units
Measures support units in time or size for easier handling of orders of magnitude at query time and display time.
| type | unit(s) |
|---|---|
| BYTES | bit / byte / kibibyte / mebibyte / gibibyte / tebibyte / pebibyte / exbibyte |
| TIME | nanosecond / microsecond / millisecond / second / minute / hour / day / week |
Unit is a property of the measure itself, not of the field. For example, consider a duration measure in nanoseconds: you have logs from service:A where duration:1000 stands for 1000 milliseconds, and other logs from service:B where duration:500 stands for 500 microseconds:
- Scale duration into nanoseconds for all logs flowing in with the arithmetic processor. Use a
*1000000multiplier on logs fromservice:A, and a*1000multiplier on logs fromservice:B. - Use
duration:>20ms(see search syntax for reference) to consistently query logs from both services at once, and see an aggregated result of max1 min.
Facet panel
The search bar provides the most comprehensive set of interactions to filter and group your data. However, for most cases, the facet panel is likely to be a more straightforward way to navigate into your data. Open a facet to see a summary of its content for the scope of the current query.
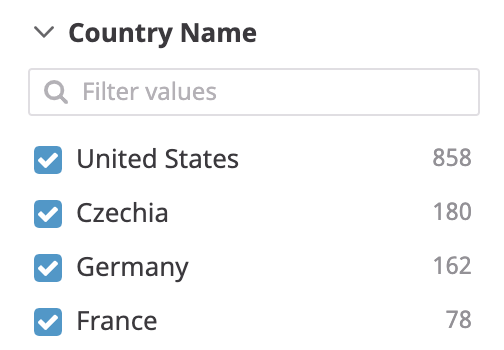
Facets (qualitative) come with a top list of unique values, and a count of logs matching each of them:
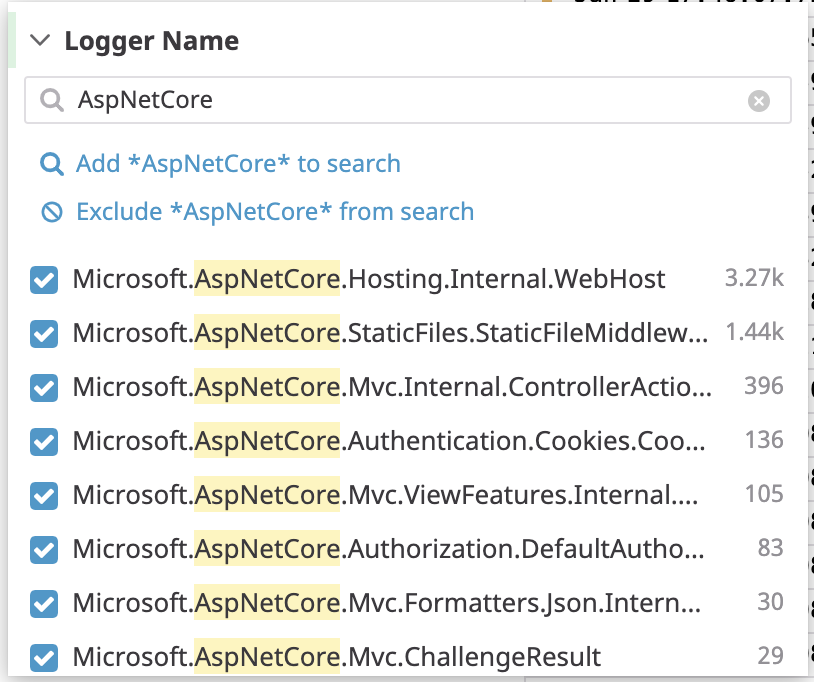
Scope the search query clicking on either value. Clicking on a value toggles the search on this unique value and all values. Clicking on checkboxes adds or removes this specific value from the list of all values, you can also search upon its content:
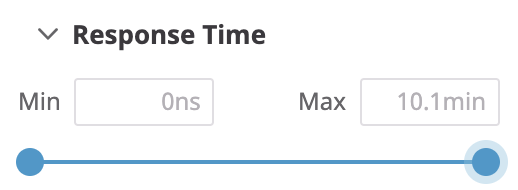
Measures come with a slider indicating minimum and maximum values. Use the slider, or input numerical values, to scope the search query to different bounds.
Hide facets
Your organization has a whole collection of facets to address its comprehensive set of use cases across all different teams using logs. Most likely, however, only a subset of these facets is valuable to you in a specific troubleshooting context. Hide facets you don’t need on a routine basis, to keep only the most relevant facets for your troubleshooting sessions.
- In the Logs Explorer, find the facet you want to hide.
- Click the cog icon next to the facet.
- Select Hide Facet.
Hidden facets are still visible in the facet search (see the Filter Facet section) in case you need it. Unhide hidden facets from there.
Hidden facets are also hidden from auto-complete in the search bar, and dropdowns (such as measure, group-by) in analytics for the Log Explorer. However, hidden facets are still valid for search queries (in case you copy-paste a log-explorer link for instance).
Hidden facets have no impact aside from the log explorer (for instance, live tail, monitors, or widget definitions in dashboards).
Hidden facets and teammates
Hiding facets is specific to your own troubleshooting context and does not impact your teammates’ view, unless you update a Saved View. Hidden facets is part of the context saved in a saved view.
Group facets
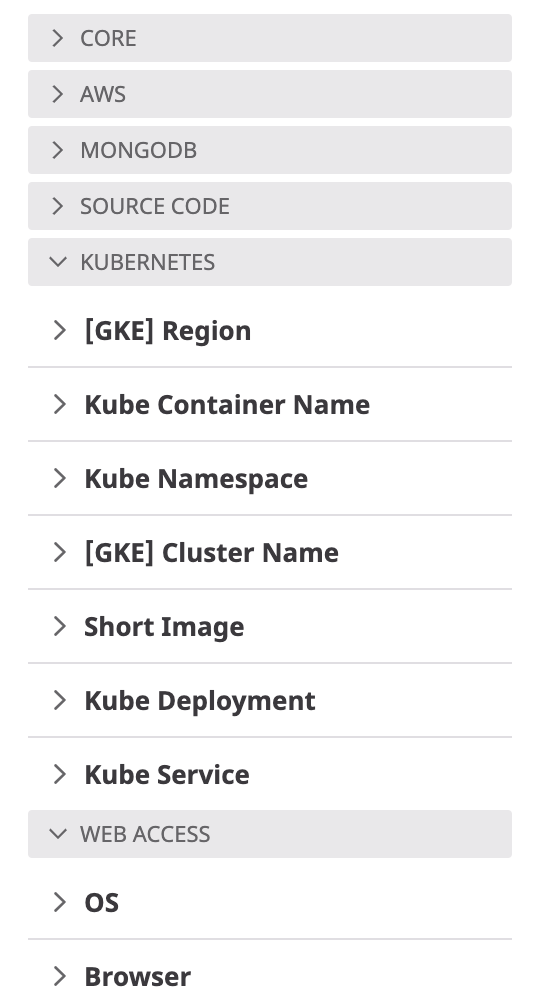
Facets are grouped into meaningful themes to ease navigation in the facet list. Assigning or reassigning a group for a facet only affects the display in the facet list and has no impact on search and analytics capabilities.
To group facets:
- Click the cog for the facet.
- Select Edit facet.
- Click the Advanced options section to expand it.
- In the Group field, enter the name of the group that you want the facet to be in.
- Click Update.
Filter facets
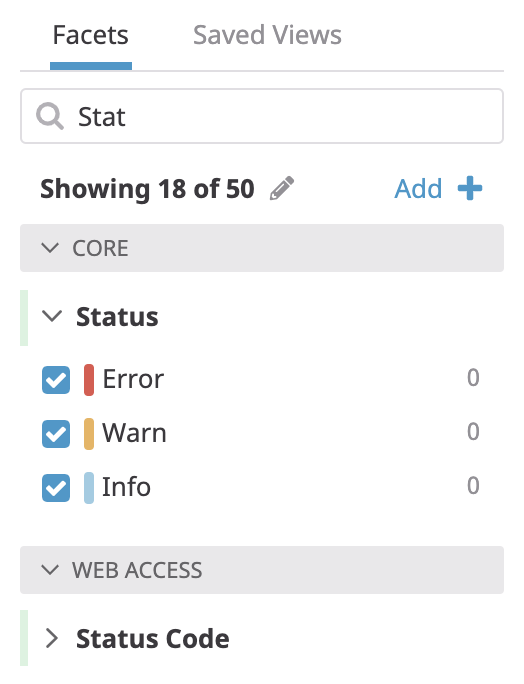
Use the search box on facets to scope down the whole facet list and navigate more quickly to the one you need to interact with. Facet search uses both facet display name and facet field name to scope results.
Aliased facets
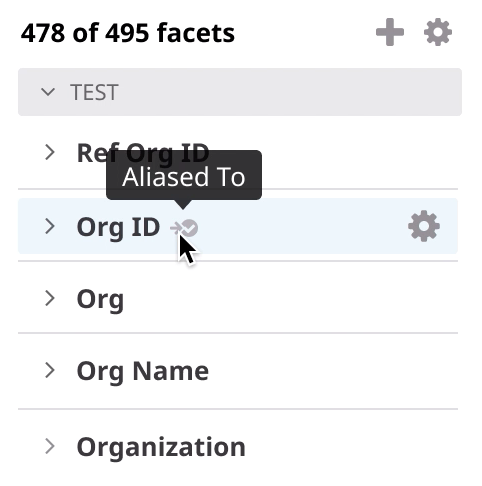
Some facets may have been aliased (see the alias facet section). Aliased facets are still valid for slicing and dicing, but are considered deprecated by your organization:
When troubleshooting, it is more likely for you to find content from other teams (alongside content from your team) in the standard facet rather than the aliased facet. This makes correlation on content from diverse origins more straightforward.
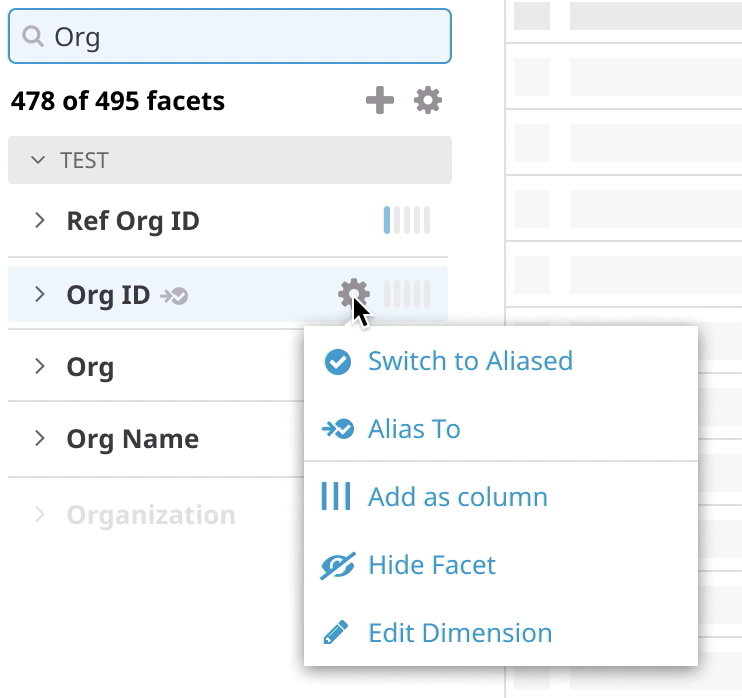
If you see an aliased facet in your facet list, consider using the standard facet instead by clicking the switch to alias menu item. This action hides the aliased facet and unhides the standard facet. If doing so makes you update a saved view, consider saving the saved view so that the aliasing applies to everyone using this saved view.
You may wish to keep the non-standard aliased version of the facet if you are troubleshooting against old content (before the aliasing for this facet has been setup by your organization).
Manage facets
Out-of-the-box facets
Most common facets such as Host and Service come out-of-the-box, so you can start troubleshooting right away once your logs are flowing into log indexes.
Facets on Reserved Attributes and most Standard Attributes are available by default.
Index facet
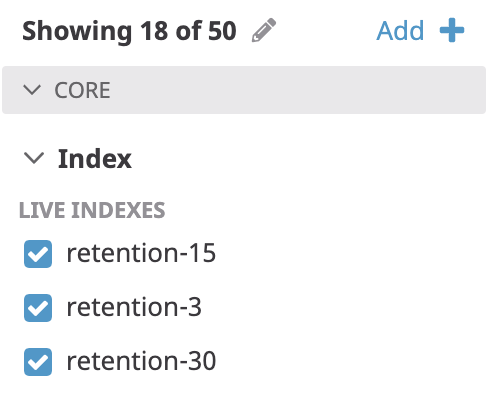
The index facet is a specific facet that appears only if your organization has multiple indexes, and/or if you have active historical views. Use this facet if you want to scope down your query to a subset of your indexes.
Create facets
As a matter of good practice, always consider using an existing facet rather than creating a new one (see the alias facets section). Using a unique facet for information of a similar nature fosters cross-team collaboration.
To create a facet on an array of JSON objects, first use a grok parser to extract the attribute and then create a facet for that attribute.
Note: Once a facet is created, its content is populated for all new logs. For an optimal usage of the Log Management solution, Datadog recommends using at most 1000 facets.
Log side panel
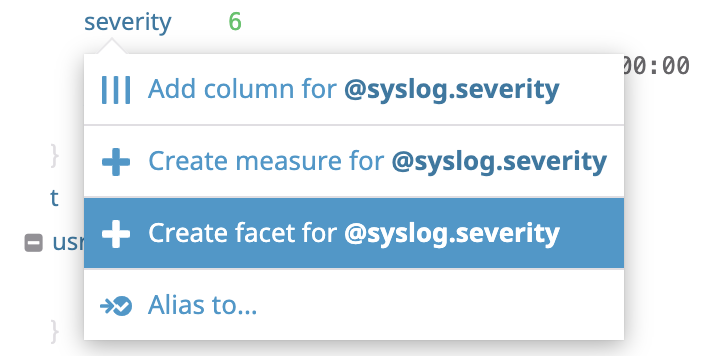
The easiest way to create a facet is to add it from the log side panel, where most of the facet details—such as the field name or the underlying type of data—are pre-filled and it’s only a matter of double-checking. Navigate in the Log Explorer to whichever log of interest bearing the field to create a facet on. Open the side-panel for this log, click on the corresponding field (either in tags or in attributes) and create a facet from there:
- If the field has a string value, only facet creation is available.
- If the field has a numerical value, both facet and measure creation are available.
Note: As a best practice, it is recommended to use no more than 1000 facets.
Facet list
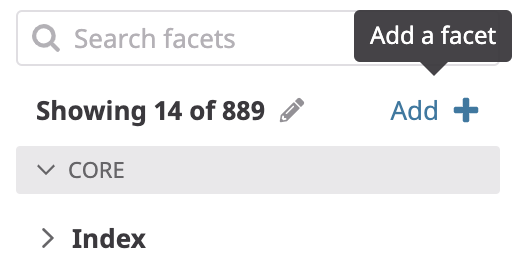
In case finding a matching log is not an option, create a new facet directly from the facet panel using the add facet button.
Define the underlying field (key) name for this facet:
- Use tag key name for tags.
- Use the attribute path for attributes, with
@prefix.
Autocomplete based on the content in logs of the current views helps you to define the proper field name. But you can use virtually any value here, specifically in the case that you don’t yet have matching logs flowing in your indexes.
Alias facets
Gathering similar content under a unique facet enables cross-team analytics and eases cross-team troubleshooting—see Naming Convention for reference.
Use aliasing as an option to smoothly realign teams that rely on inconsistent naming conventions. With aliasing, you can have them all using the standard facet emerging for your organization.
Aliasing facet to facet
This is the best option if multiple teams in your organization already created multiple facets for similar content.
When aliasing an aliased facet towards a standard facet:
- Users can use either aliased and standard facets for troubleshooting. You may prefer the standard one, which eases correlation of content flowing from diverse and possibly heterogeneous sources.
- Users are nudged to use the standard facet in place of the aliased one.
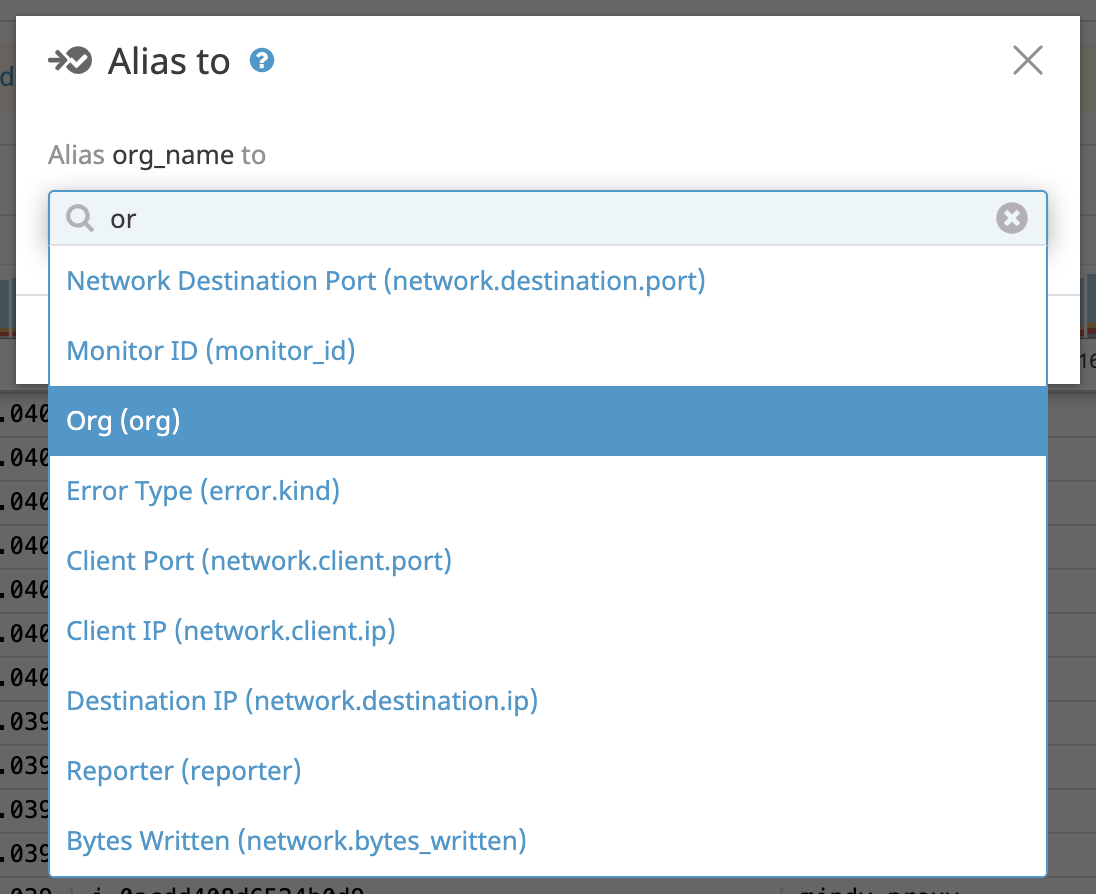
To alias a facet towards a standard one, select the Alias to... action item in the facet menu. Pick the destination facets from all the standard ones existing for your organization.
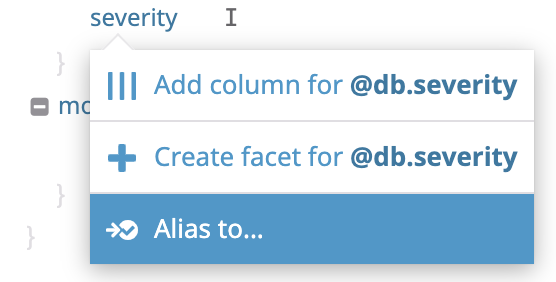
Aliasing attribute to facet
This is the best option if you onboard logs flowing from new sources. Rather than creating a facet for some field on those logs, and right after deprecating this facet by aliasing it to a standard facet, alias the field directly to an existing facet:
Delete a facet
Deleting a facet that is being used in indexes, monitors, dashboards, restriction queries, or by other teams can cause configurations to break.
To delete a facet, follow these steps:
- Click Showing xx of xx at the top of the facet panel.
- Search for your facet.
- Click the pencil icon for your facet.
- Click Delete.
Further Reading
Additional helpful documentation, links, and articles:
