- Essentials
- Getting Started
- Datadog
- Datadog Site
- DevSecOps
- Serverless for AWS Lambda
- Agent
- Integrations
- Containers
- Dashboards
- Monitors
- Logs
- APM Tracing
- Profiler
- Tags
- API
- Service Catalog
- Session Replay
- Continuous Testing
- Synthetic Monitoring
- Incident Management
- Database Monitoring
- Cloud Security Management
- Cloud SIEM
- Application Security Management
- Workflow Automation
- CI Visibility
- Test Visibility
- Test Impact Analysis
- Code Analysis
- Learning Center
- Support
- Glossary
- Standard Attributes
- Guides
- Agent
- Integrations
- OpenTelemetry
- Developers
- Authorization
- DogStatsD
- Custom Checks
- Integrations
- Create an Agent-based Integration
- Create an API Integration
- Create a Log Pipeline
- Integration Assets Reference
- Build a Marketplace Offering
- Create a Tile
- Create an Integration Dashboard
- Create a Recommended Monitor
- Create a Cloud SIEM Detection Rule
- OAuth for Integrations
- Install Agent Integration Developer Tool
- Service Checks
- IDE Plugins
- Community
- Guides
- API
- Datadog Mobile App
- CoScreen
- Cloudcraft
- In The App
- Dashboards
- Notebooks
- DDSQL Editor
- Sheets
- Monitors and Alerting
- Infrastructure
- Metrics
- Watchdog
- Bits AI
- Service Catalog
- API Catalog
- Error Tracking
- Service Management
- Infrastructure
- Application Performance
- APM
- Continuous Profiler
- Database Monitoring
- Data Streams Monitoring
- Data Jobs Monitoring
- Digital Experience
- Real User Monitoring
- Product Analytics
- Synthetic Testing and Monitoring
- Continuous Testing
- Software Delivery
- CI Visibility
- CD Visibility
- Test Optimization
- Code Analysis
- Quality Gates
- DORA Metrics
- Security
- Security Overview
- Cloud SIEM
- Cloud Security Management
- Application Security Management
- AI Observability
- Log Management
- Observability Pipelines
- Log Management
- Administration
Search Logs
Overview
While information from individual logs can be useful visualized as a list, sometimes valuable information can be accessed through aggregation. To access this information, search for logs in the Log Explorer and display them as timeseries, top lists, tree maps, pie charts, or tables.
Log Explorer search consists of a time range and a search query, mixing key:value and full-text search.
Search query
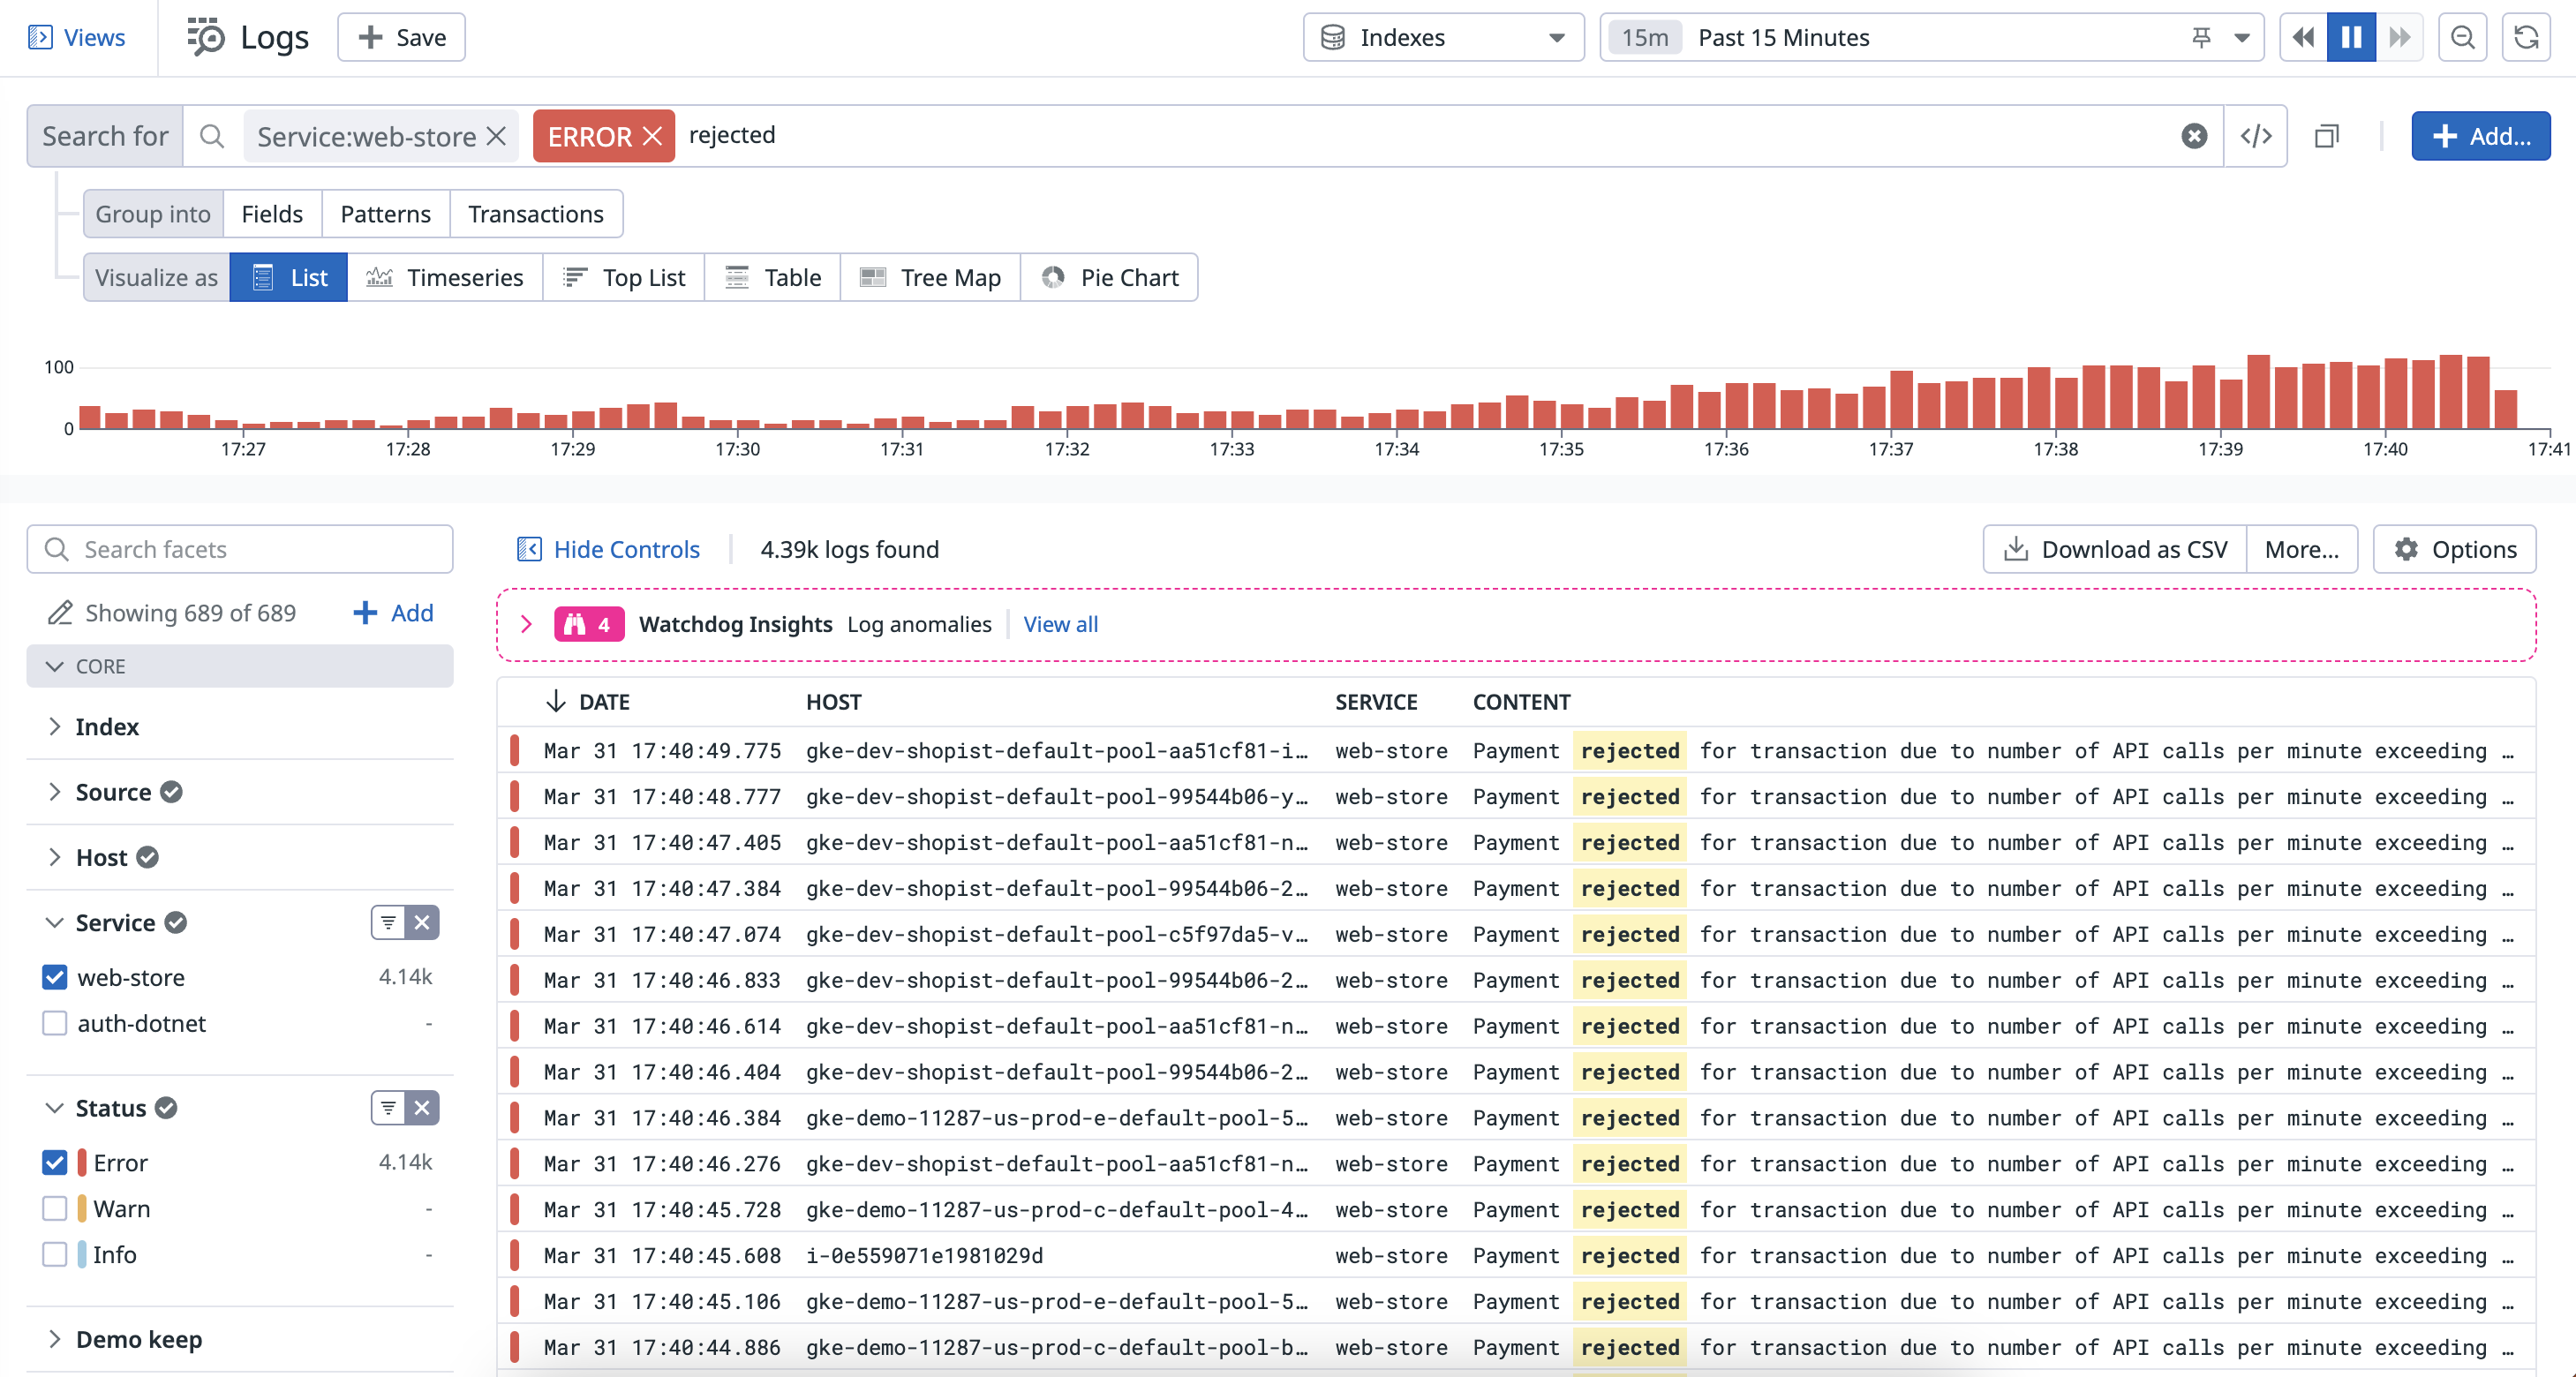
For example, to filter on logs produced by a web store service, with an error status, over the past fifteen minutes, create a custom query like service:payment status:error rejected and set the time range to the Past 15 minutes:
Indexed Logs support both full-text search and key:value search queries.
Note: key:value queries do not require that you declare a facet beforehand.
Autocomplete
Use the search bar’s autocomplete feature to complete your query using:
- Existing keys and values in your logs
- Your recent searches (recent searches from other users are not displayed)
- Saved views
Autocomplete facets and values
The search bar autosuggests facets based on your input in the search bar. These facets are displayed in the same order in which they are positioned in the facet panel. If a facet has a defined display name, it is displayed on the right-hand side of the dropdown menu. Facets that are not configured to be displayed in the facet panel are not autosuggested for a search.
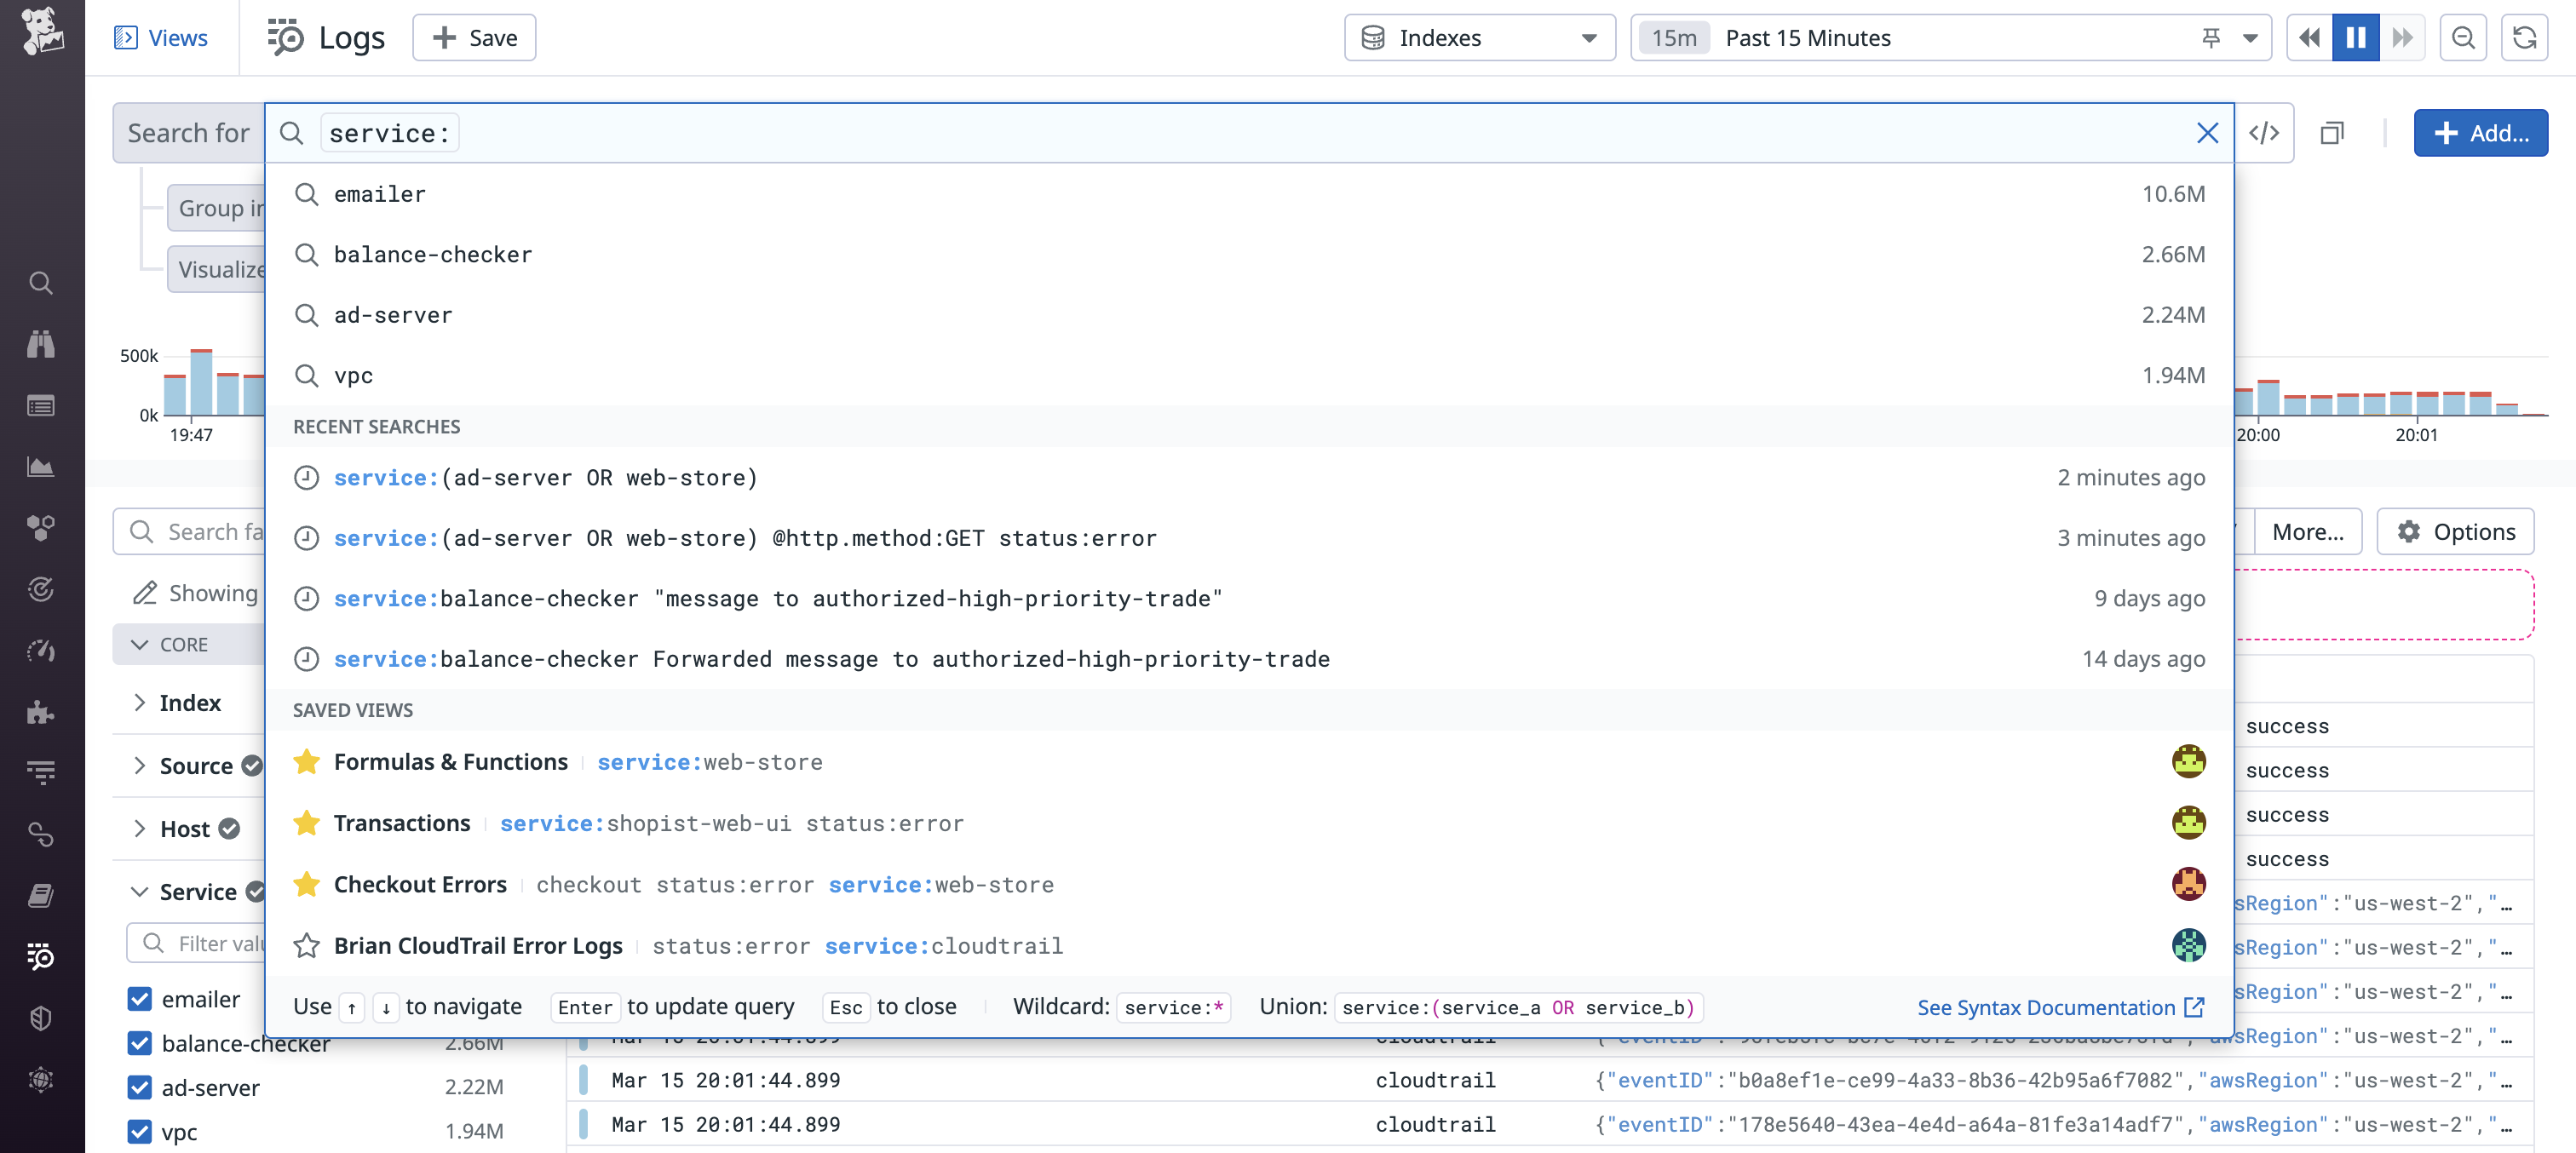
After you select a facet and input the : character, the search bar autosuggests values. These values are displayed in descending order of how many logs contain that facet:value pair in the past 15 minutes. The estimated number of logs containing that value is displayed on the right-hand side of the dropdown menu. For example, the balance-checker service is positioned first in the autosuggested list of values for the service facet, indicated by the 2.66M, representing the highest log count:
Autocomplete recent searches
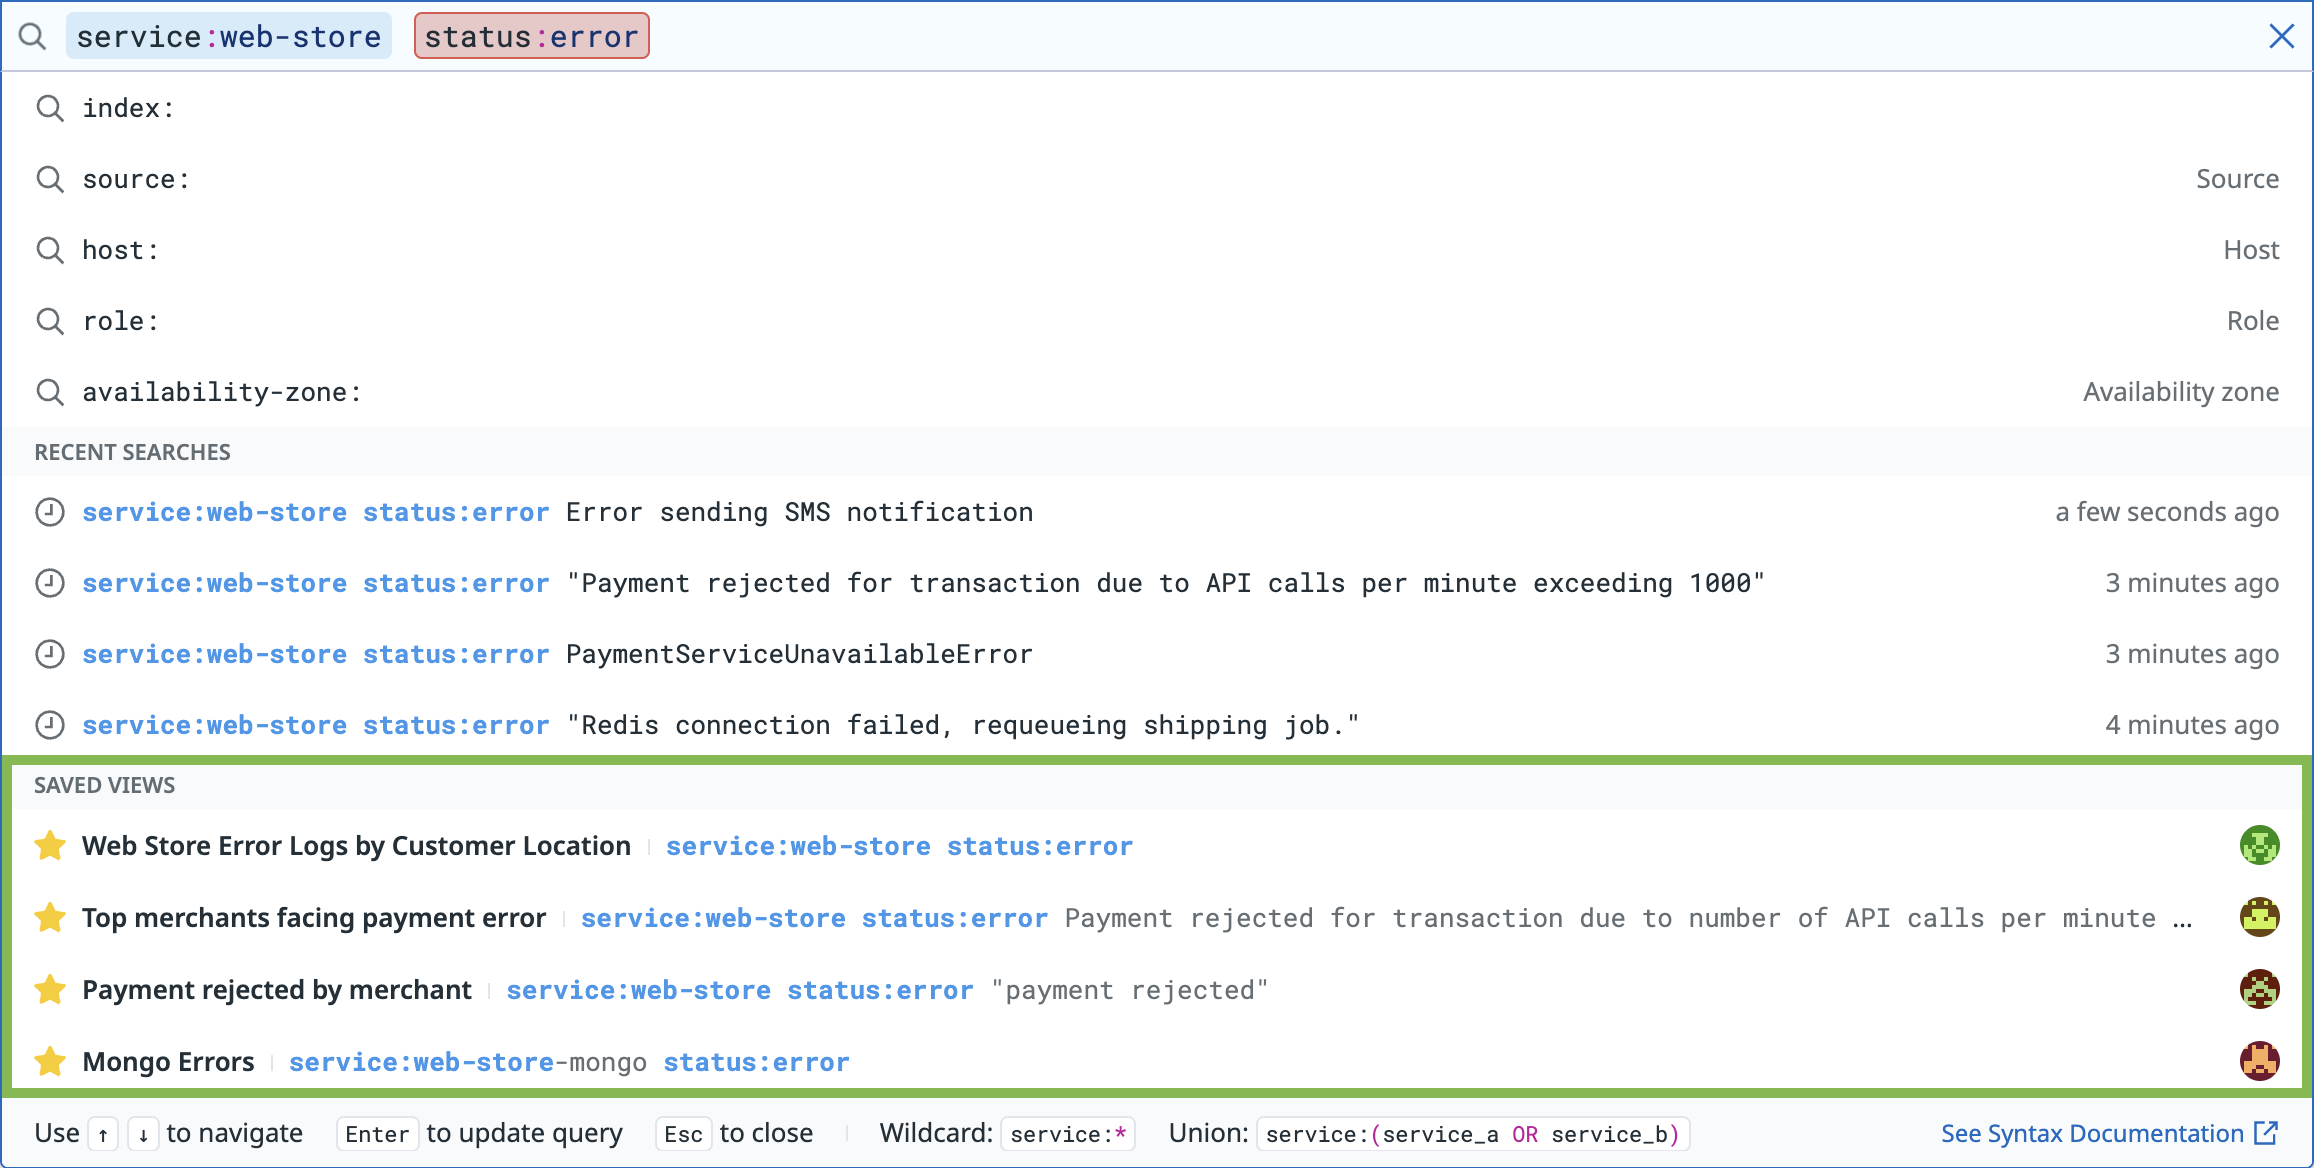
Your 100 most recent searches in the Log Explorer are retained. Recent searches from other users are not retained or displayed. The search bar autosuggests the four most recent searches that match your input in the search bar, with the most recent search displayed first. The search bar also shows how long ago each recent search was run. For example, if you input service:web-store status:error in the search bar, the four most recent searches containing these terms are displayed in order of recency, each one specifying a different error:
Autocomplete Saved Views
You can create Saved Views in the Log Explorer to save queries and additional context for the future and for centralized access. The search bar autosuggests Saved Views that match your input in the search bar. Saved Views are displayed in the same order in which they are positioned in the Saved Views panel, with starred Saved Views displayed first. The Saved View name, saved query, and profile picture of the user who last updated it are displayed in the dropdown menu. If a Saved View query is too long to be displayed in the dropdown, the full query is displayed in a tooltip on hover. The email of the user who last updated a Saved View is also displayed in a tooltip on hover over their profile picture.
Search syntax
Syntax highlighting clearly differentiates input types, such as keys (for example, an attribute such as @merchant_name), values (for example, the name of a particular merchant), free text (for example, keywords in a log messages such as responded 500), and control characters (for example, parentheses and colons). Status attributes are also highlighted in colors representing the status, such as red for error and blue for info.
Clear error states inform you which part of the query contains syntax errors and how to remediate them. For example,
- If you input the query
service:with no value, the message “Missing value in key:value pair” is displayed when you hover over the query. - If you input brackets for a range query, but do not fill in the high and low values, the message “Expected term but end of input found” is displayed.
- If you input multiple values for a log field but miss the closing parenthesis character, such as
service:(web-store OR auth-dotnet, the messageMissing closing parenthesis characteris displayed.
To start searching for logs and customizing the time frame in the Log Explorer, read the Search Syntax documentation and the Custom Time Frames documentation.
Disable styling and autocomplete for search bar
Toggle the button to the right of the search bar to search in raw mode, where syntax highlighting, search pills styling, and autocomplete are removed:
You can interact with the search bar with your mouse, as well as by using keyboard commands. For example, use CMD-A for selecting text, CMD-C for copying text, CMD-X for cutting text, and CMD-V for pasting text.
Further Reading
Additional helpful documentation, links, and articles:


