- Essentials
- Getting Started
- Datadog
- Datadog Site
- DevSecOps
- Serverless for AWS Lambda
- Agent
- Integrations
- Containers
- Dashboards
- Monitors
- Logs
- APM Tracing
- Profiler
- Tags
- API
- Service Catalog
- Session Replay
- Continuous Testing
- Synthetic Monitoring
- Incident Management
- Database Monitoring
- Cloud Security Management
- Cloud SIEM
- Application Security Management
- Workflow Automation
- CI Visibility
- Test Visibility
- Test Impact Analysis
- Code Analysis
- Learning Center
- Support
- Glossary
- Standard Attributes
- Guides
- Agent
- Integrations
- OpenTelemetry
- Developers
- Authorization
- DogStatsD
- Custom Checks
- Integrations
- Create an Agent-based Integration
- Create an API Integration
- Create a Log Pipeline
- Integration Assets Reference
- Build a Marketplace Offering
- Create a Tile
- Create an Integration Dashboard
- Create a Recommended Monitor
- Create a Cloud SIEM Detection Rule
- OAuth for Integrations
- Install Agent Integration Developer Tool
- Service Checks
- IDE Plugins
- Community
- Guides
- API
- Datadog Mobile App
- CoScreen
- Cloudcraft
- In The App
- Dashboards
- Notebooks
- DDSQL Editor
- Sheets
- Monitors and Alerting
- Infrastructure
- Metrics
- Watchdog
- Bits AI
- Service Catalog
- API Catalog
- Error Tracking
- Service Management
- Infrastructure
- Application Performance
- APM
- Continuous Profiler
- Database Monitoring
- Data Streams Monitoring
- Data Jobs Monitoring
- Digital Experience
- Real User Monitoring
- Product Analytics
- Synthetic Testing and Monitoring
- Continuous Testing
- Software Delivery
- CI Visibility
- CD Visibility
- Test Optimization
- Code Analysis
- Quality Gates
- DORA Metrics
- Security
- Security Overview
- Cloud SIEM
- Cloud Security Management
- Application Security Management
- AI Observability
- Log Management
- Observability Pipelines
- Log Management
- Administration
Log Side Panel
Overview
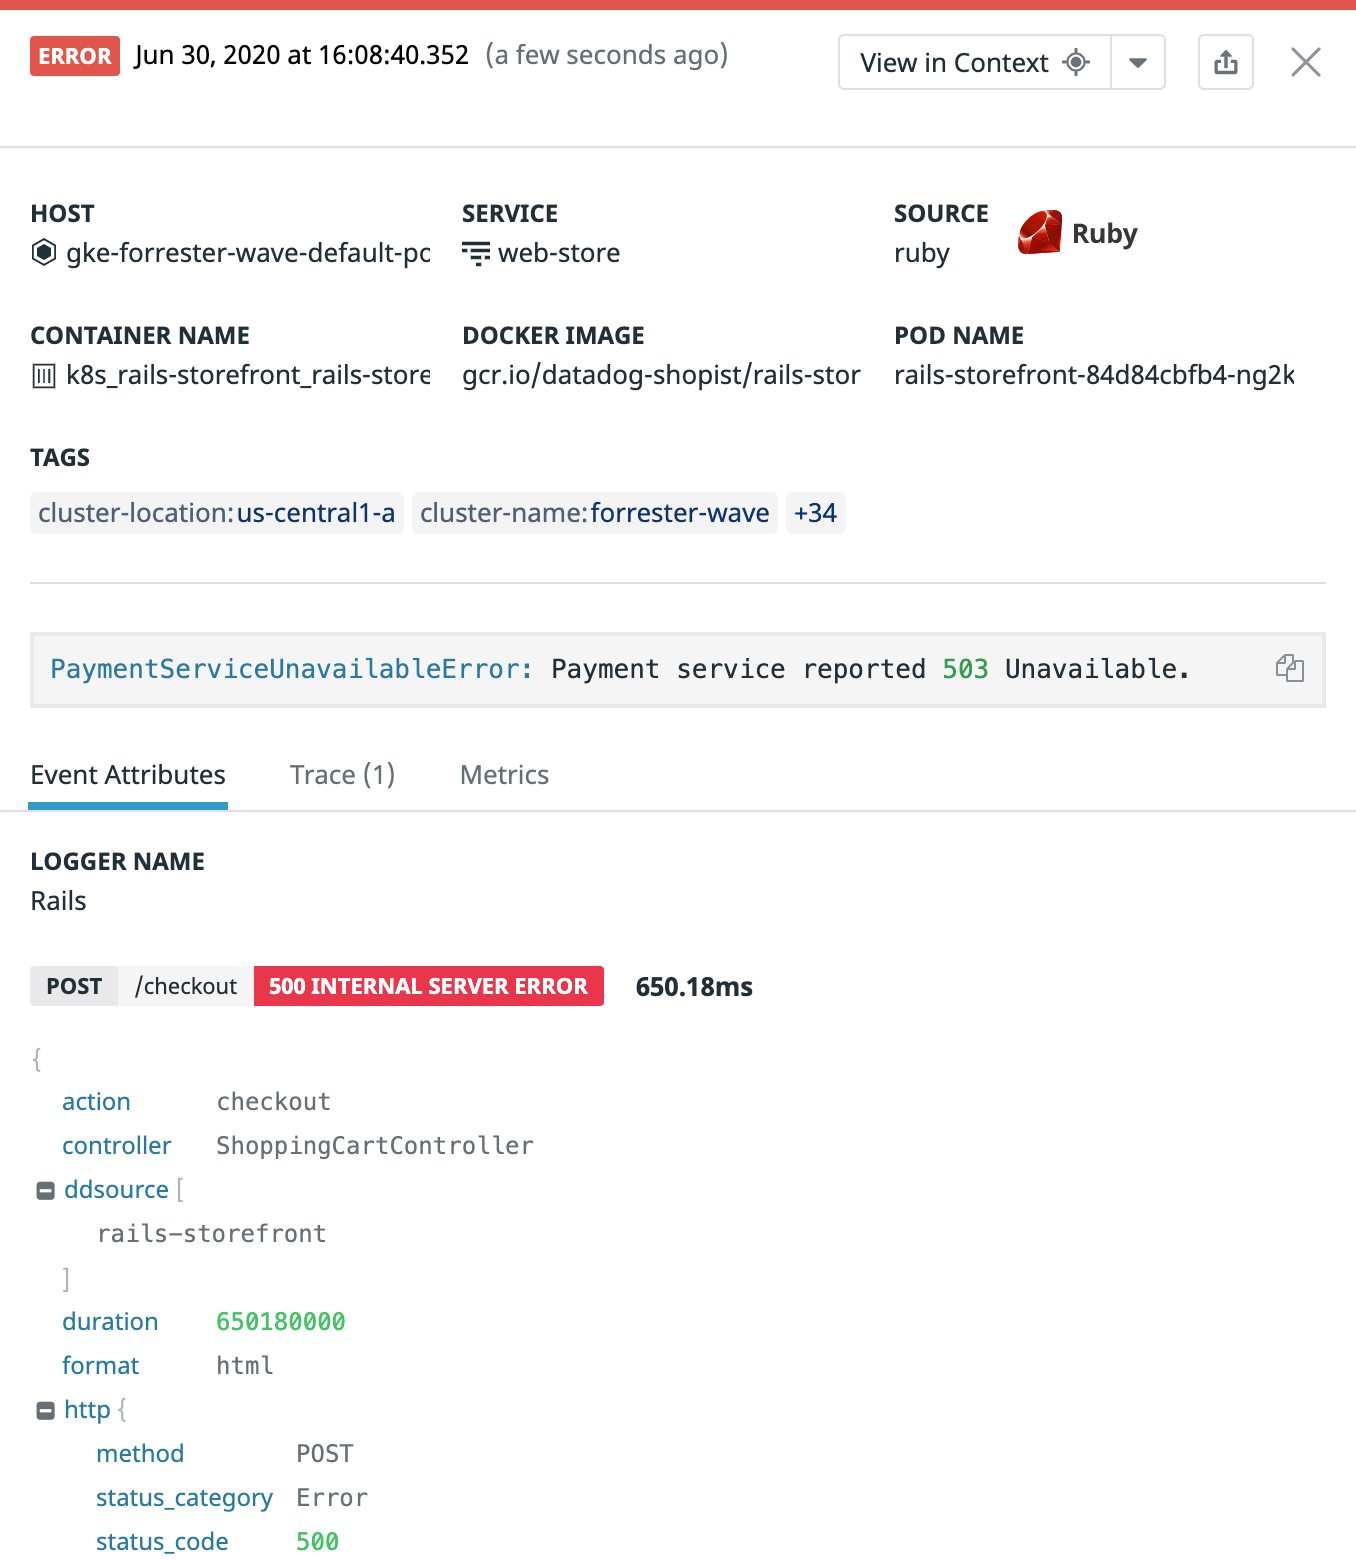
Datadog displays individual logs following this general side panel layout:
- The upper part of the panel displays general context information
- The lower part of the panel displays the actual content of the log
Context refers to the infrastructure and application context which the log has generated. Information is gathered from tags, whether automatically attached (host name, container name, log file name, serverless function name, etc.) or added through custom tags (team in charge, environment, application version, etc.) to the log by the Datadog Agent or Log Forwarder.
Content refers to the log itself. This includes the log message, as well as all structured information extracted and enriched from the logs through Log Pipelines. For logs generated by common components of a technical stack, parsing and enriching comes out-of-the-box.
- For file log collection, make sure you properly set up the source field, which triggers file log collection. See Log Integrations for reference.
- For container log collection, use Autodiscovery.
Some standard fields, for instance error.stack, http.method, or duration, have specific enhanced displays in the Log Panel for better readability. Extract corresponding information from your logs and remap your attributes with standard attribute remappers.
Hub to other data sources
Correlate with infrastructure data
The View in context button updates the search request in order to show you the log lines dated just before and after a selected log, even if they don’t match your filter. This context is different according to the situation, as Datadog uses the Hostname, Service, filename, and container_id attributes, along with tags, in order find the appropriate context for your logs.
Click on the Metrics tab and access underlying infrastructure metrics in a 30 minutes time frame around the log.
Interact with Host in the upper reserved attributes section, the related host dashboard, or Network Analytics page. Interact with Container sections to navigate to the container page scoped with the underlying parameters.
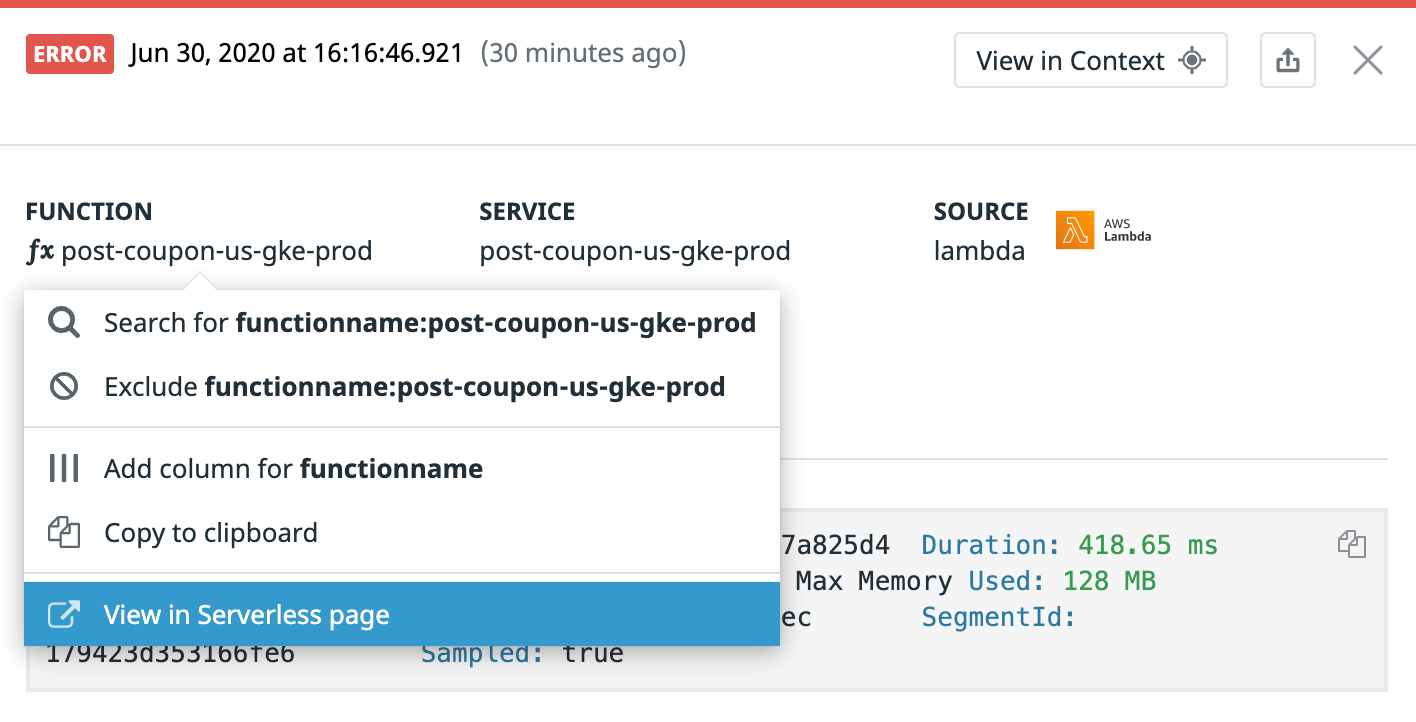
When logs come from a serverless source, the Host Section is replaced with a Serverless section that links to the corresponding serverless page.
Correlate with APM data
Make sure you enable trace injection in logs and follow the Unified Service Tagging best practices to benefit from all the capabilities of Logs and APM correlation.
Click on the Trace tab and see a log in the context of its entire trace, with upstream and downstream services running. Deep dive into the corresponding APM data by clicking on View Trace Details.
Interact with the Service section to highlight the part of the trace that corresponds with the selected service. Use this information to refocus your query in the Log Explorer and view other logs from the same trace.
Configure your troubleshooting context
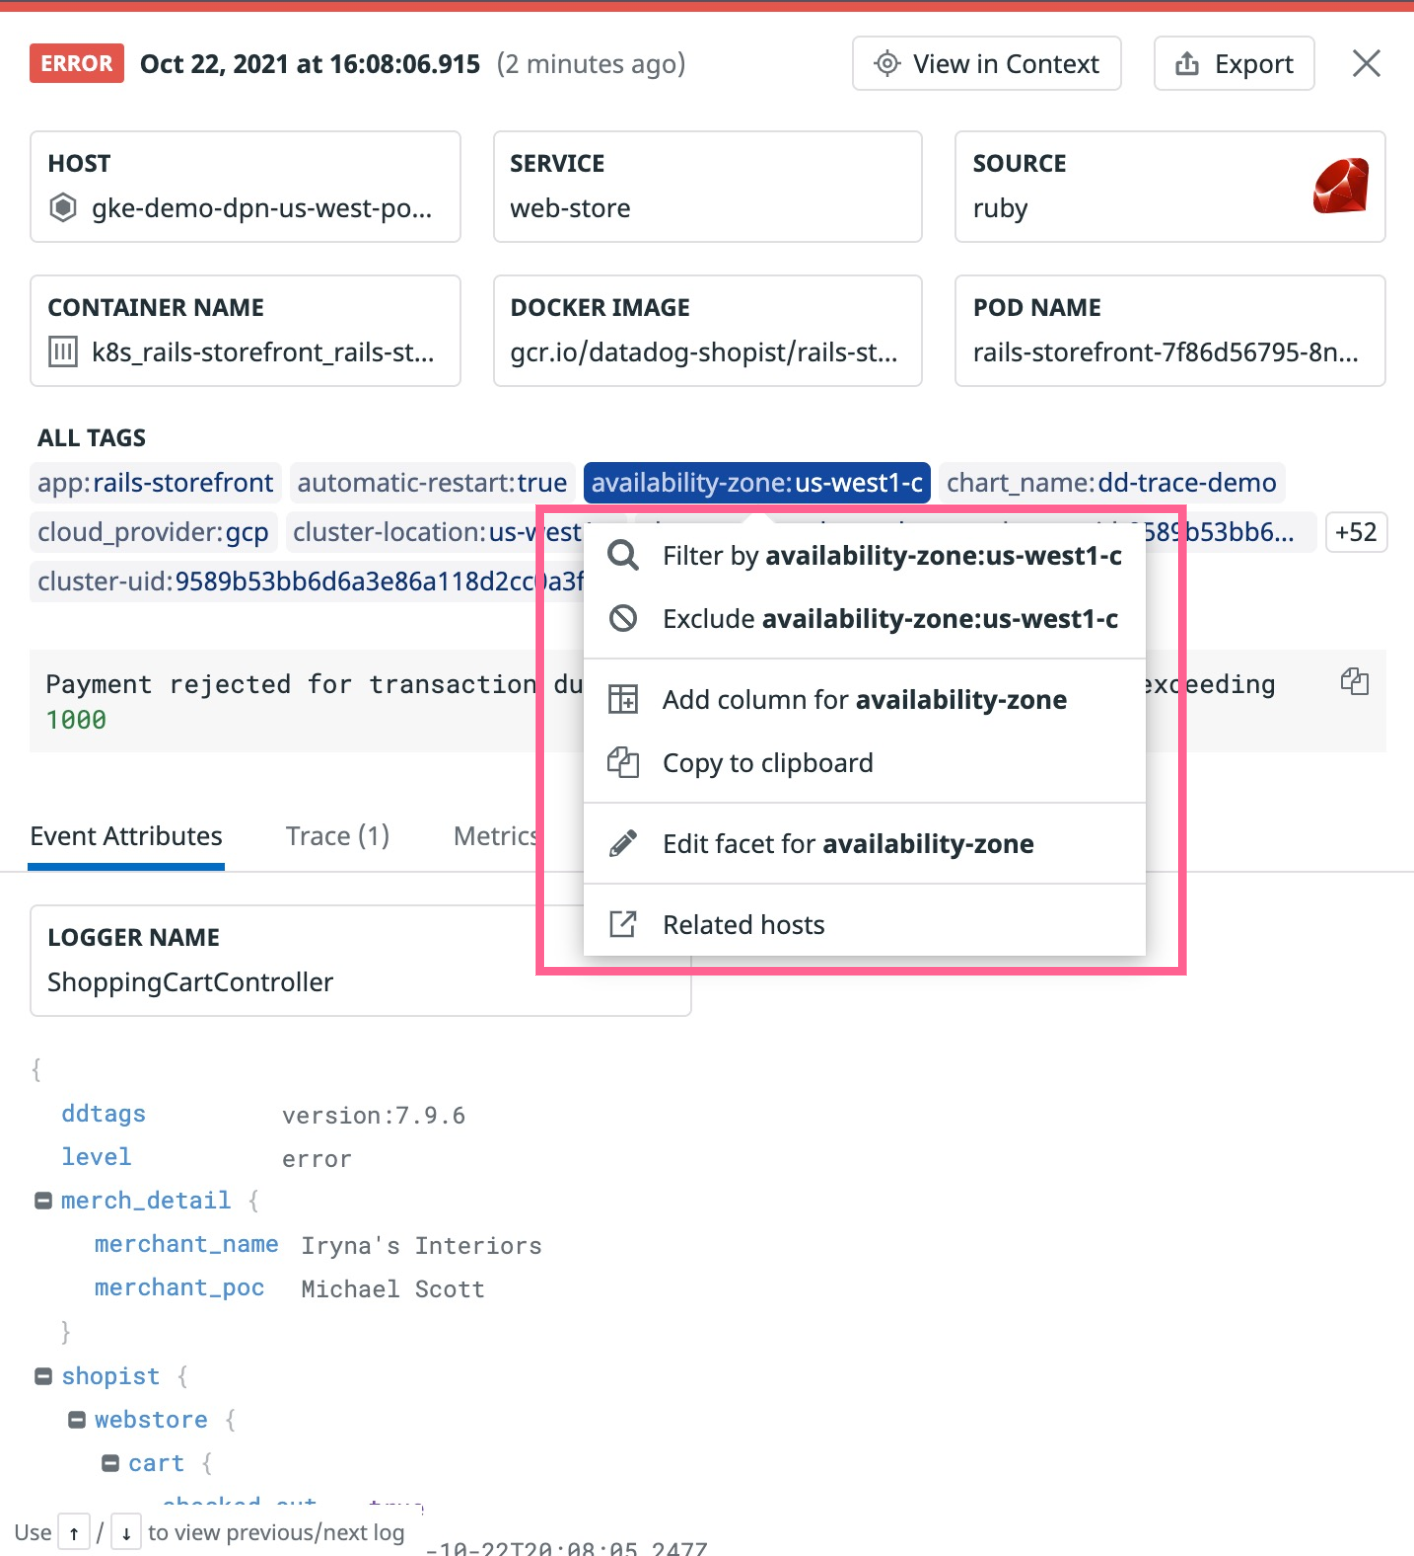
Interact with the attributes names and values in the lower JSON section to:
- Add or remove a column from the logs table
- Append the search request with specific values (include or exclude)
- Build or edit a facet or measure from an attribute. See Log Facets.
- Build or edit a calculated field from an attribute. See Calculated Fields.
Share a log
Use the Share button to share the log opened in side panel to other contexts.
- Copy to clipboard or
Ctrl+C/Cmd+Ccopies the log JSON to your clipboard. - Share Event shares the log (along with the underlying view) with teammates through email, Slack, and more. See all Datadog notification integrations available.
Further Reading
Additional helpful documentation, links, and articles:


