- Essentials
- Getting Started
- Datadog
- Datadog Site
- DevSecOps
- Serverless for AWS Lambda
- Agent
- Integrations
- Containers
- Dashboards
- Monitors
- Logs
- APM Tracing
- Profiler
- Tags
- API
- Service Catalog
- Session Replay
- Continuous Testing
- Synthetic Monitoring
- Incident Management
- Database Monitoring
- Cloud Security Management
- Cloud SIEM
- Application Security Management
- Workflow Automation
- CI Visibility
- Test Visibility
- Test Impact Analysis
- Code Analysis
- Learning Center
- Support
- Glossary
- Standard Attributes
- Guides
- Agent
- Integrations
- OpenTelemetry
- Developers
- Authorization
- DogStatsD
- Custom Checks
- Integrations
- Create an Agent-based Integration
- Create an API Integration
- Create a Log Pipeline
- Integration Assets Reference
- Build a Marketplace Offering
- Create a Tile
- Create an Integration Dashboard
- Create a Recommended Monitor
- Create a Cloud SIEM Detection Rule
- OAuth for Integrations
- Install Agent Integration Developer Tool
- Service Checks
- IDE Plugins
- Community
- Guides
- API
- Datadog Mobile App
- CoScreen
- Cloudcraft
- In The App
- Dashboards
- Notebooks
- DDSQL Editor
- Sheets
- Monitors and Alerting
- Infrastructure
- Metrics
- Watchdog
- Bits AI
- Service Catalog
- API Catalog
- Error Tracking
- Service Management
- Infrastructure
- Application Performance
- APM
- Continuous Profiler
- Database Monitoring
- Data Streams Monitoring
- Data Jobs Monitoring
- Digital Experience
- Real User Monitoring
- Product Analytics
- Synthetic Testing and Monitoring
- Continuous Testing
- Software Delivery
- CI Visibility
- CD Visibility
- Test Optimization
- Code Analysis
- Quality Gates
- DORA Metrics
- Security
- Security Overview
- Cloud SIEM
- Cloud Security Management
- Application Security Management
- AI Observability
- Log Management
- Observability Pipelines
- Log Management
- Administration
Indexes
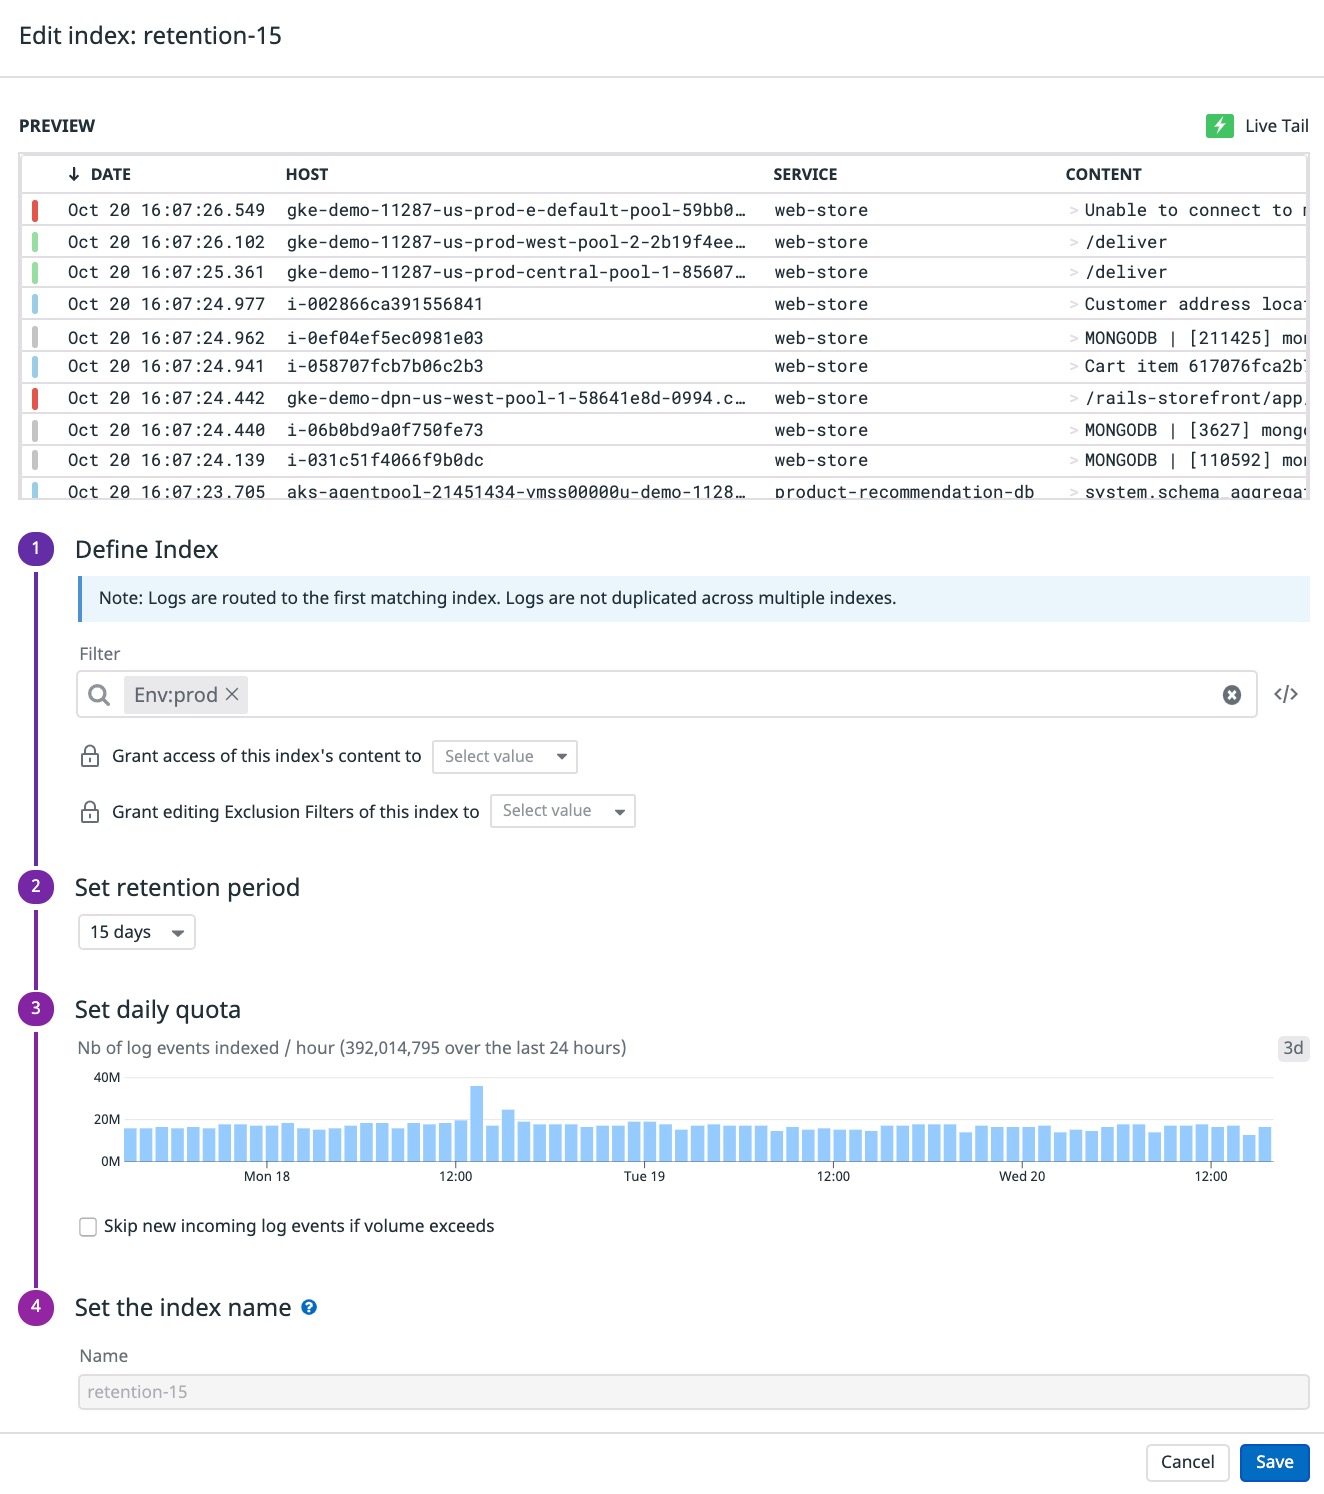
Log Indexes provide fine-grained control over your Log Management budget by allowing you to segment data into value groups for differing retention, quotas, usage monitoring, and billing. Indexes are located on the Configuration page in the Indexes section. Double click on them or click on the edit button to see more information about the number of logs that were indexed in the past 3 days, as well as the retention period for those logs:
You can use indexed logs for faceted searching, patterns, analytics, and monitoring.
Multiple indexes
By default, each new account gets a single index representing a monolithic set of all your logs. Datadog recommends using multiple indexes if you require:
- Multiple retention periods
- Multiple daily quotas, for finer budget control.
The Log Explorer supports queries across multiple indexes.
Add indexes
Use the “New Index” button to create a new index. There is a maximum number of indexes you can create for each account, set to 100 by default.
Note: Index names must start with a letter and can only contain lowercase letters, numbers, or the ‘-’ character.
Contact Datadog support if you need to increase the maximum number of indexes for your account.
Delete indexes
To delete an index from your organization, use the “Delete icon” in the index action tray. Only users with the Logs delete data permission can use this option.
You cannot recreate an index with the same name as the deleted one.
Note: The deleted index will no longer accept new incoming logs. The logs in the deleted index are no longer available for querying. After all logs have aged out according to the applicable retention period, the index will no longer show up in the Index page.
Indexes filters
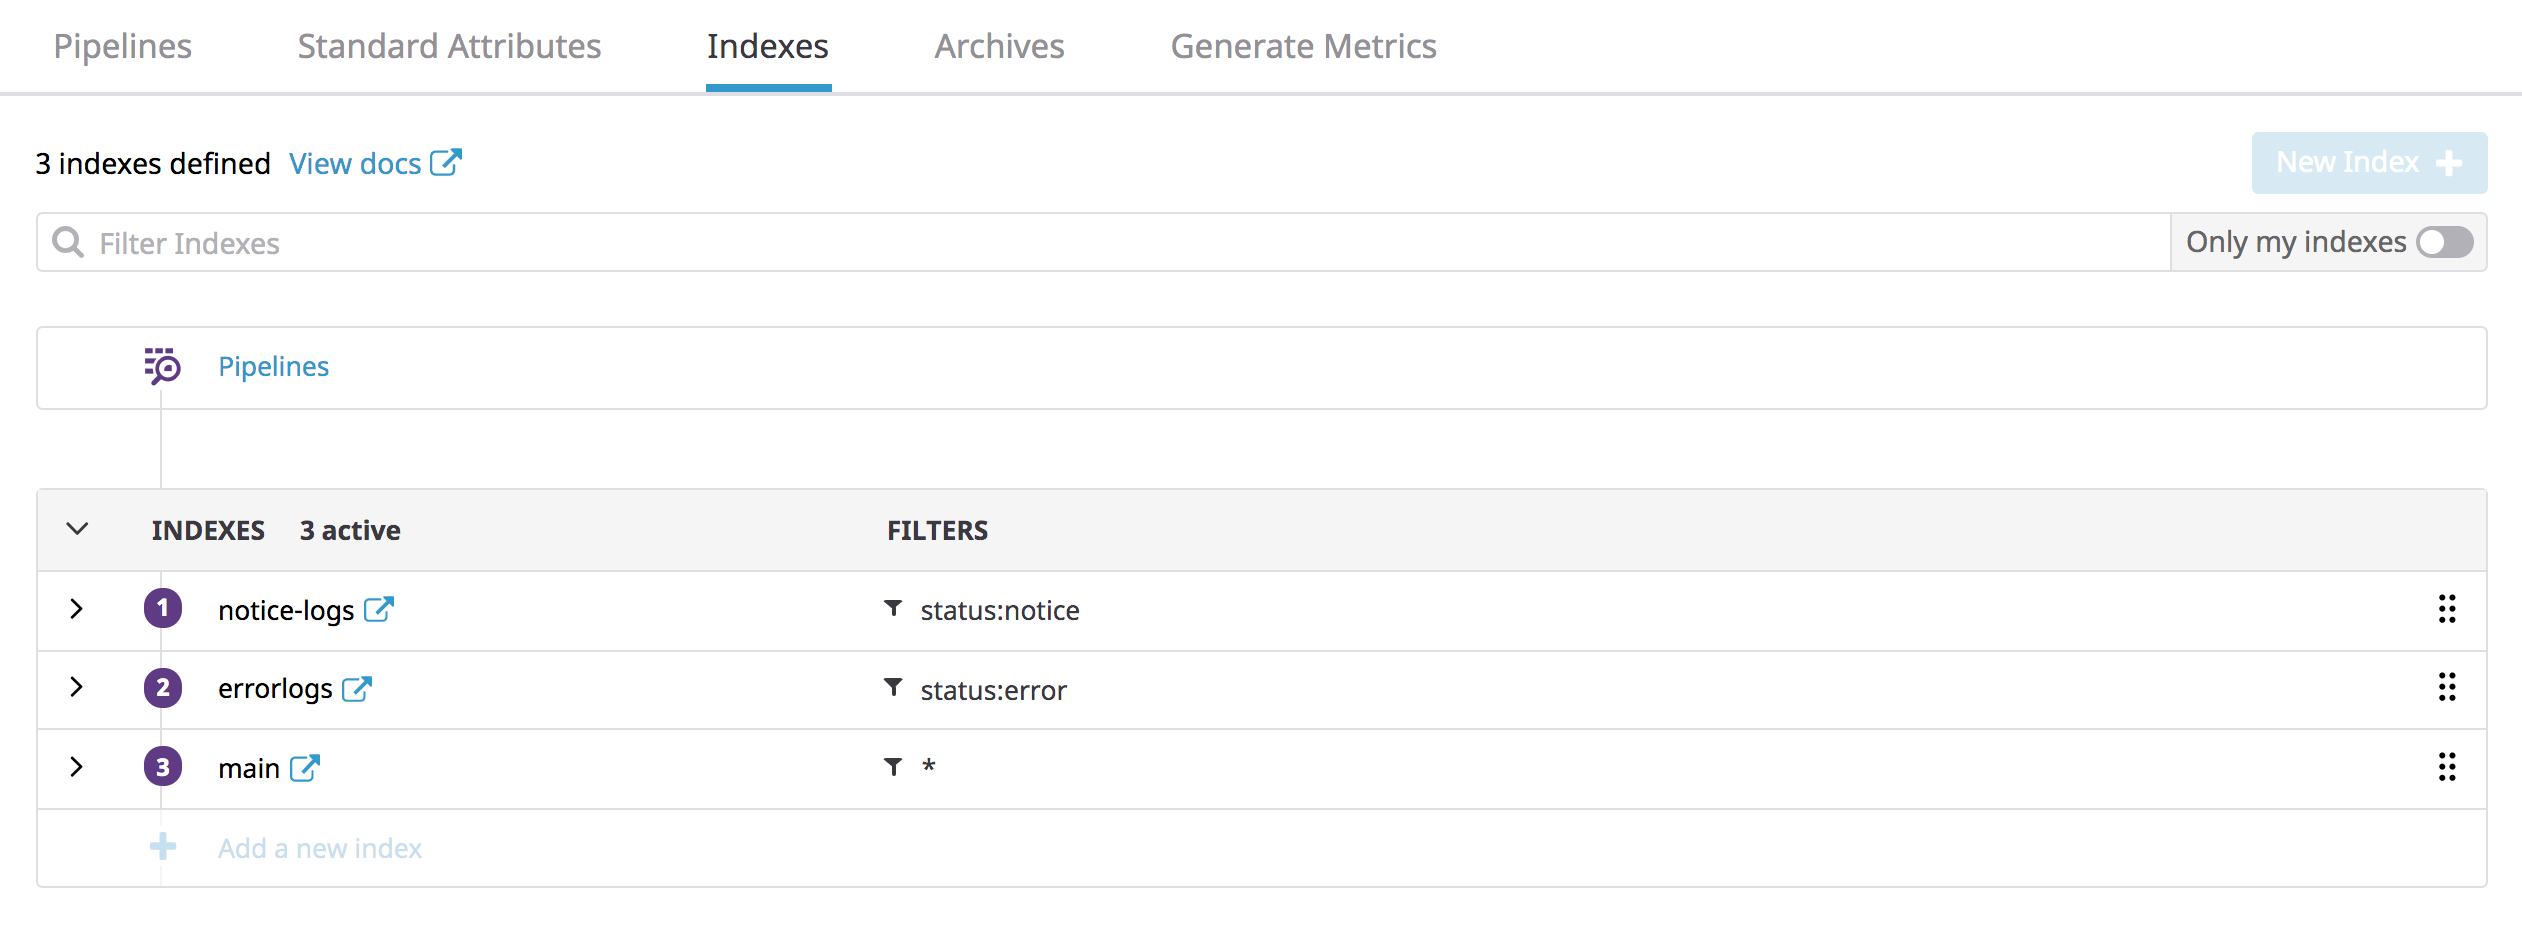
Index filters allow dynamic control over which logs flow into which indexes. For example, if you create a first index filtered on the status:notice attribute, a second index filtered to the status:error attribute, and a final one without any filter (the equivalent of *), all your status:notice logs would go to the first index, all your status:error logs to the second index, and the rest would go to the final one.
Note: Logs enter the first index whose filter they match on, use drag and drop on the list of indexes to reorder them according to your use-case.
Exclusion filters
By default, logs indexes have no exclusion filter: that is to say all logs matching the Index Filter are indexed.
But because your logs are not all and equally valuable, exclusion filters control which logs flowing in your index should be removed. Excluded logs are discarded from indexes, but still flow through the Livetail and can be used to generate metrics and archived.
To add an exclusion filter:
- Navigate to Log Indexes.
- Expand the pipeline for which you want to add an exclusion filter.
- Click Add an Exclusion Filter.
Exclusion filters are defined by a query, a sampling rule, and an active/inactive toggle:
- Default query is
*, meaning all logs flowing in the index would be excluded. Scope down exclusion filter to only a subset of logs with a log query. - Default sampling rule is
Exclude 100% of logsmatching the query. Adapt sampling rate from 0% to 100%, and decide if the sampling rate applies on individual logs, or group of logs defined by the unique values of any attribute. - Default toggle is active, meaning logs flowing in the index are actually discarded according to the exclusion filter configuration. Toggle this to inactive to ignore this exclusion filter for new logs flowing in the index.
Note: Index filters for logs are only processed with the first active exclusion filter matched. If a log matches an exclusion filter (even if the log is not sampled out), it ignores all following exclusion filters in the sequence.
Use drag and drop on the list of exclusion filters to reorder them according to your use case.
Examples
Switch off, switch on
You might not need your DEBUG logs until you actually need them when your platform undergoes an incident, or want to carefully observe the deployment of a critical version of your application. Setup a 100% exclusion filter on the status:DEBUG, and toggle it on and off from Datadog UI or through the API when required.
Keep an eye on trends
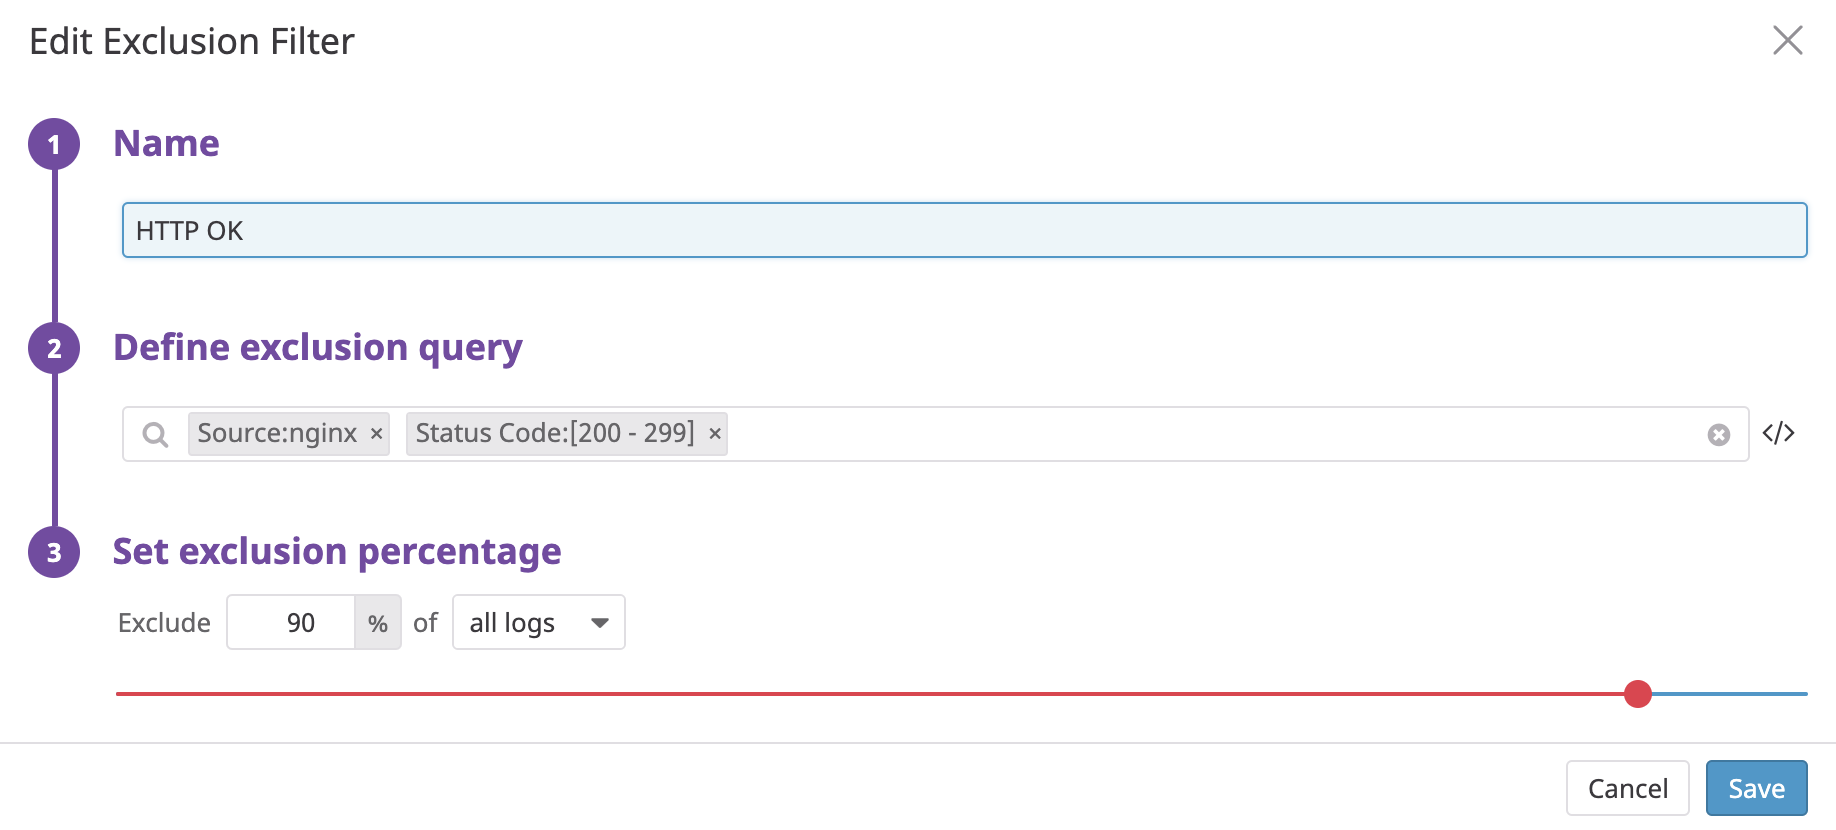
What if you don’t want to keep all logs from your web access server requests? You could choose to index all 3xx, 4xx, and 5xx logs, but exclude 95% of the 2xx logs: source:nginx AND http.status_code:[200 TO 299] to keep track of the trends.
Tip: Transform web access logs into meaningful KPIs with a metric generated from your logs, counting number of requests and tagged by status code, browser and country.
Sampling consistently with higher-level entities
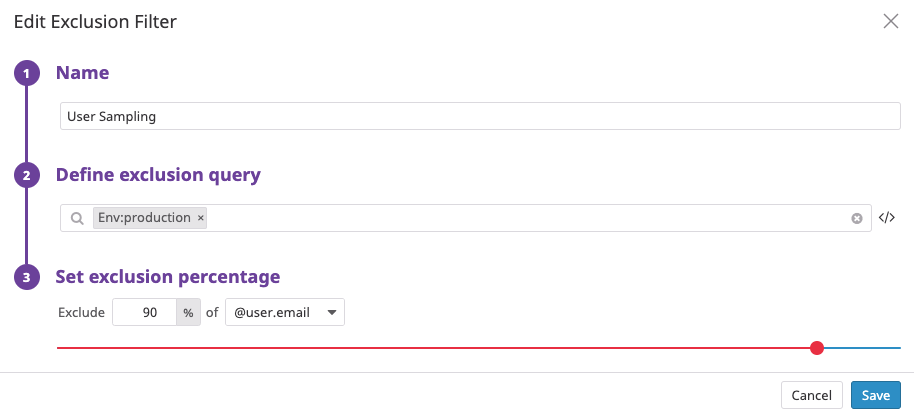
You have millions of users connecting to your website everyday. And although you don’t need observability on every single user, you still want to keep the full picture for some. Set up an exclusion filter applying to all production logs (env:production) and exclude logs for 90% of the @user.email:
You can use APM in conjunction with Logs, thanks to trace ID injection in logs. As for users, you don’t need to keep all your logs but making sure logs always give the full picture to a trace is critical for troubleshooting.
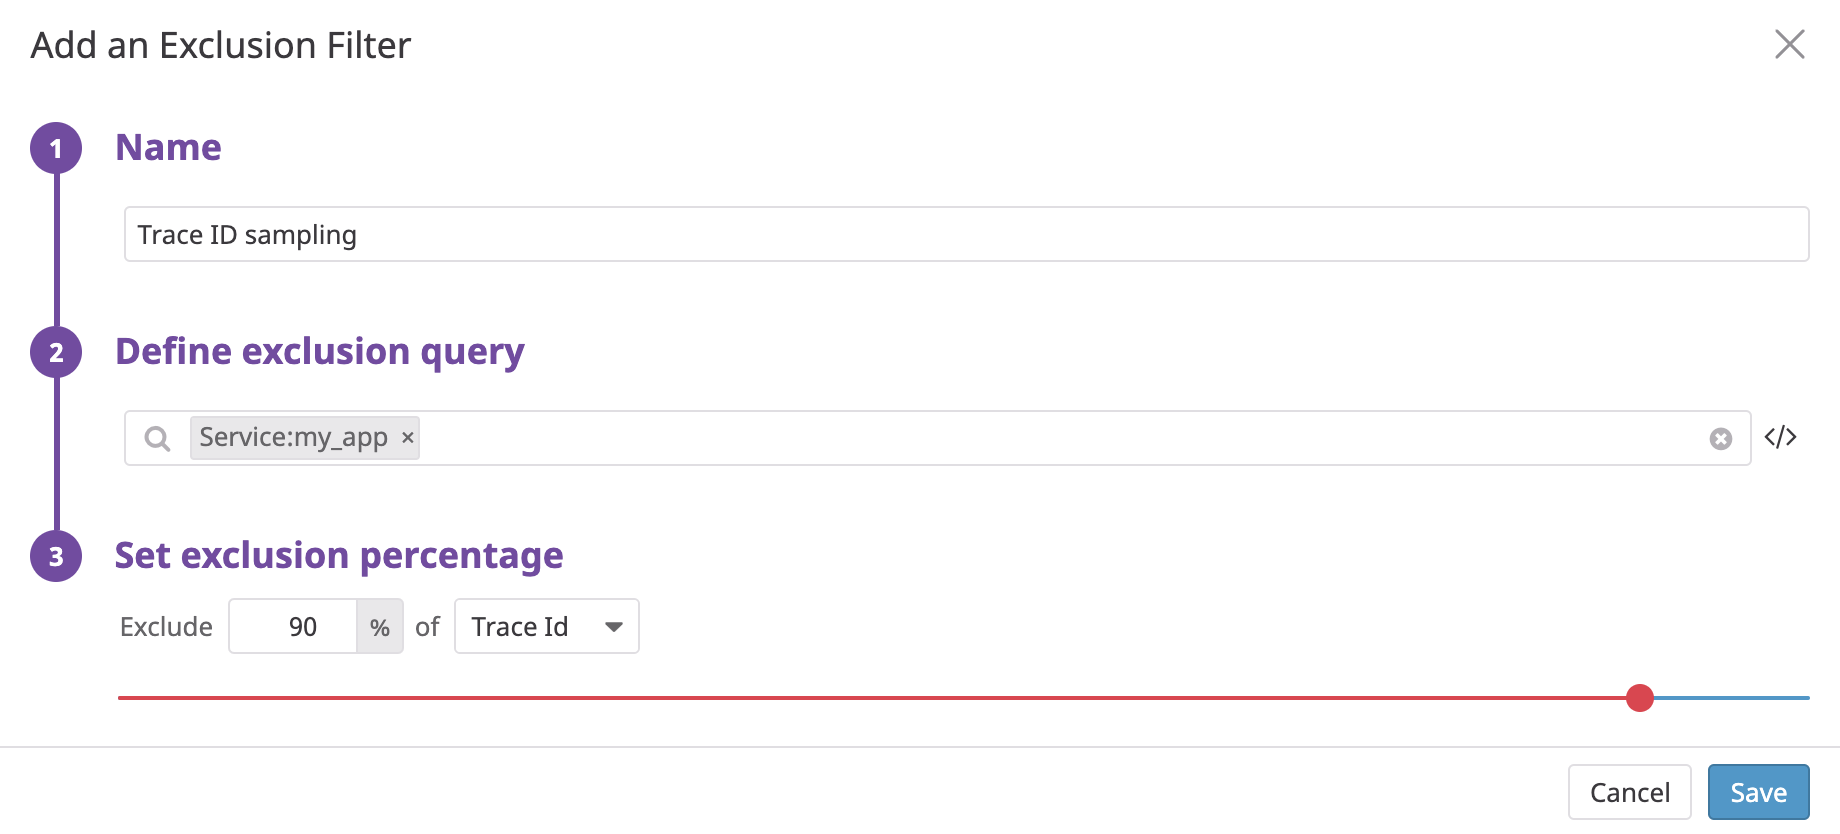
Set up an exclusion filter applied to logs from your instrumented service (service:my_python_app) and exclude logs for 50% of the Trace ID - make sure to use the trace ID remapper upstream in your pipelines.
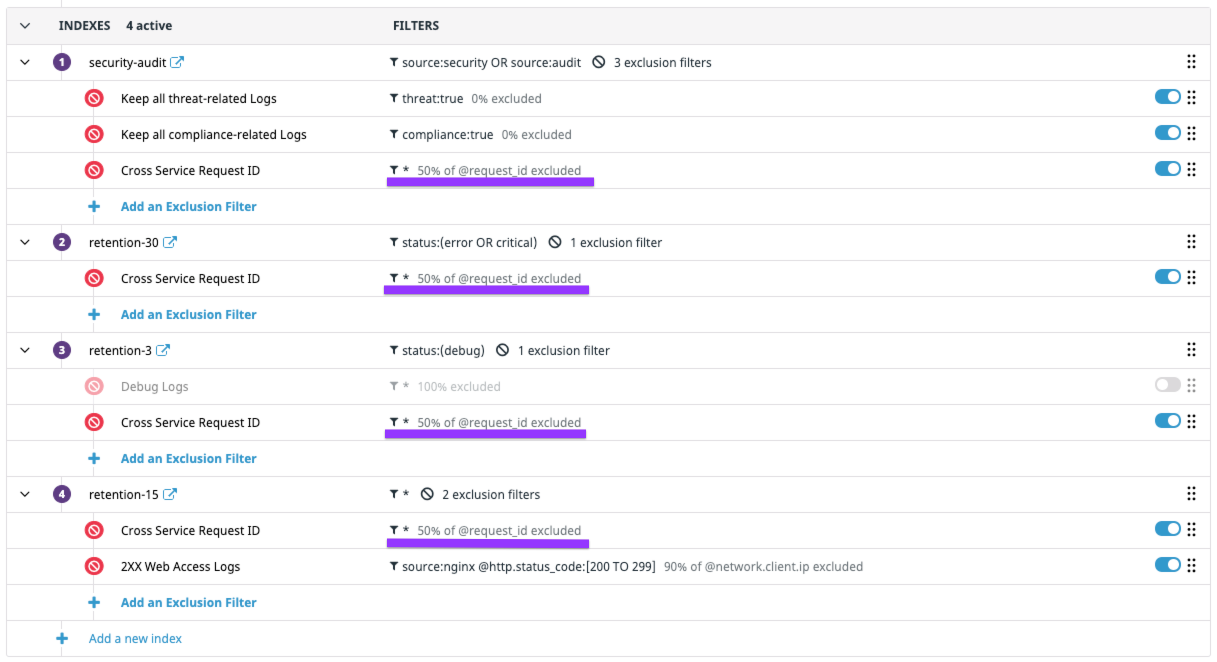
To ensure sampling consistency across multiple indexes:
- Create one exclusion rule in each index.
- Use the same sampling rate and the same attribute defining the higher level entity for all exclusion rules.
- Double-check exclusion rules, filters, and respective order (logs only pass through the first matching exclusion rule).
In the following example:
- In general, all logs with a specific
request_idare either kept or excluded (with 50% probability). - Logs with a
threat:trueorcompliance:truetag are kept regardless of therequest_id. DEBUGlogs are indexed consistently with therequest_idsampling rule, unless the debug logs exclusion filter is enabled in which case they are sampled.- 50% of the
2XXweb access logs with an actualrequest_idare kept. All other2XXweb access logs are sampled based on the 90% exclusion filter rule.
Update log retention
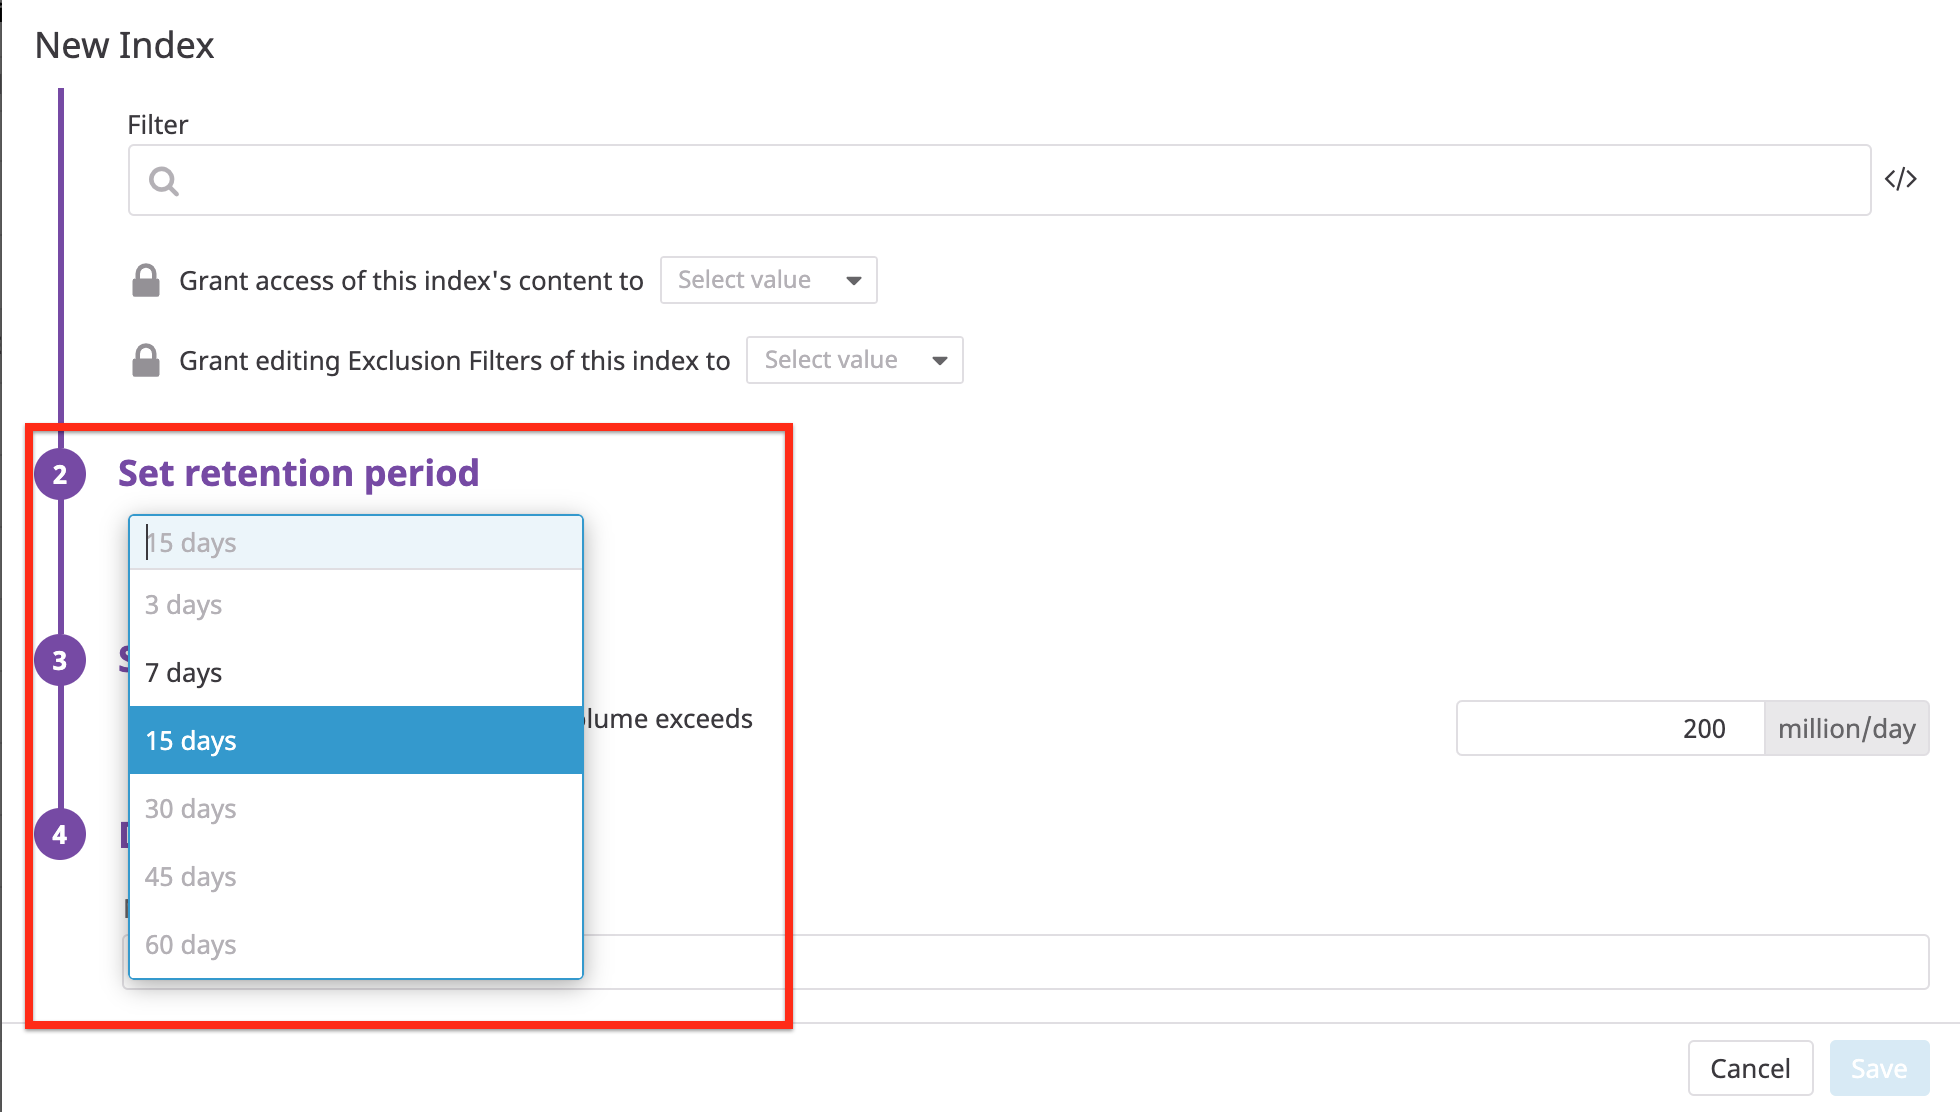
The index retention setting determines how long logs are stored and searchable in Datadog. You can set the retention to any value allowed in your account configuration.
To enable adding additional retentions that are not in your current contract, contact Customer Success at: success@datadoghq.com. After additional retentions have been enabled, you need to update the retention periods for your indexes.
Note: To use retentions which are not in your current contract, the option must be enabled by an admin in your organisation settings.
Set daily quota
You can set a daily quota to hard-limit the number of logs that are stored within an Index per day. This quota is applied for all logs that should have been stored (such as after exclusion filters are applied). After the daily quota is reached, logs are no longer indexed but are still available in the livetail, sent to your archives, and used to generate metrics from logs.
You can configure or remove this quota at any time when editing the Index:
- Set a daily quota in millions of logs
- (Optional) Set a custom reset time; by default, index daily quotas reset automatically at 2:00pm UTC
- (Optional) Set a warning threshold as a percentage of the daily quota (minimum 50%)
Note: Changes to daily quotas and warning thresholds take effect immediately.
An event is generated when either the daily quota or the warning threshold is reached:
See Monitor log usage on how to monitor and alert on your usage.
Further Reading
Additional helpful documentation, links, and articles:
*Logging without Limits is a trademark of Datadog, Inc.
